Do-Wan Lee1, Hwon Heo2, Chul‐Woong Woo3, Jae-Im Kwon3, Joongkee Min3, Monica Young Choi2, Yeon Ji Chae2, Dong‐Cheol Woo2,3, Kyung Won Kim1, Jeong Kon Kim1, Hyo Jeong Chin4, and Dong‐Hoon Lee4
1Department of Radiology, Asan Medical Center, University of Ulsan College of Medicine, Seoul, Korea, Republic of, 2Department of Convergence Medicine, Asan Medical Center, University of Ulsan College of Medicine, Seoul, Korea, Republic of, 3Convergence Medicine Research Center, Asan Institute for Life Sciences, Asan Medical Center, Seoul, Korea, Republic of, 4Department of Radiological Science, College of Health Sciences, Yonsei University, Wonju, Korea, Republic of
1Department of Radiology, Asan Medical Center, University of Ulsan College of Medicine, Seoul, Korea, Republic of, 2Department of Convergence Medicine, Asan Medical Center, University of Ulsan College of Medicine, Seoul, Korea, Republic of, 3Convergence Medicine Research Center, Asan Institute for Life Sciences, Asan Medical Center, Seoul, Korea, Republic of, 4Department of Radiological Science, College of Health Sciences, Yonsei University, Wonju, Korea, Republic of
Amide proton transfer-weighted (APTw) 7T MRI
allows the monitoring of changes in amide proton concentration levels in the
brain regions of demyelination and remyelination.
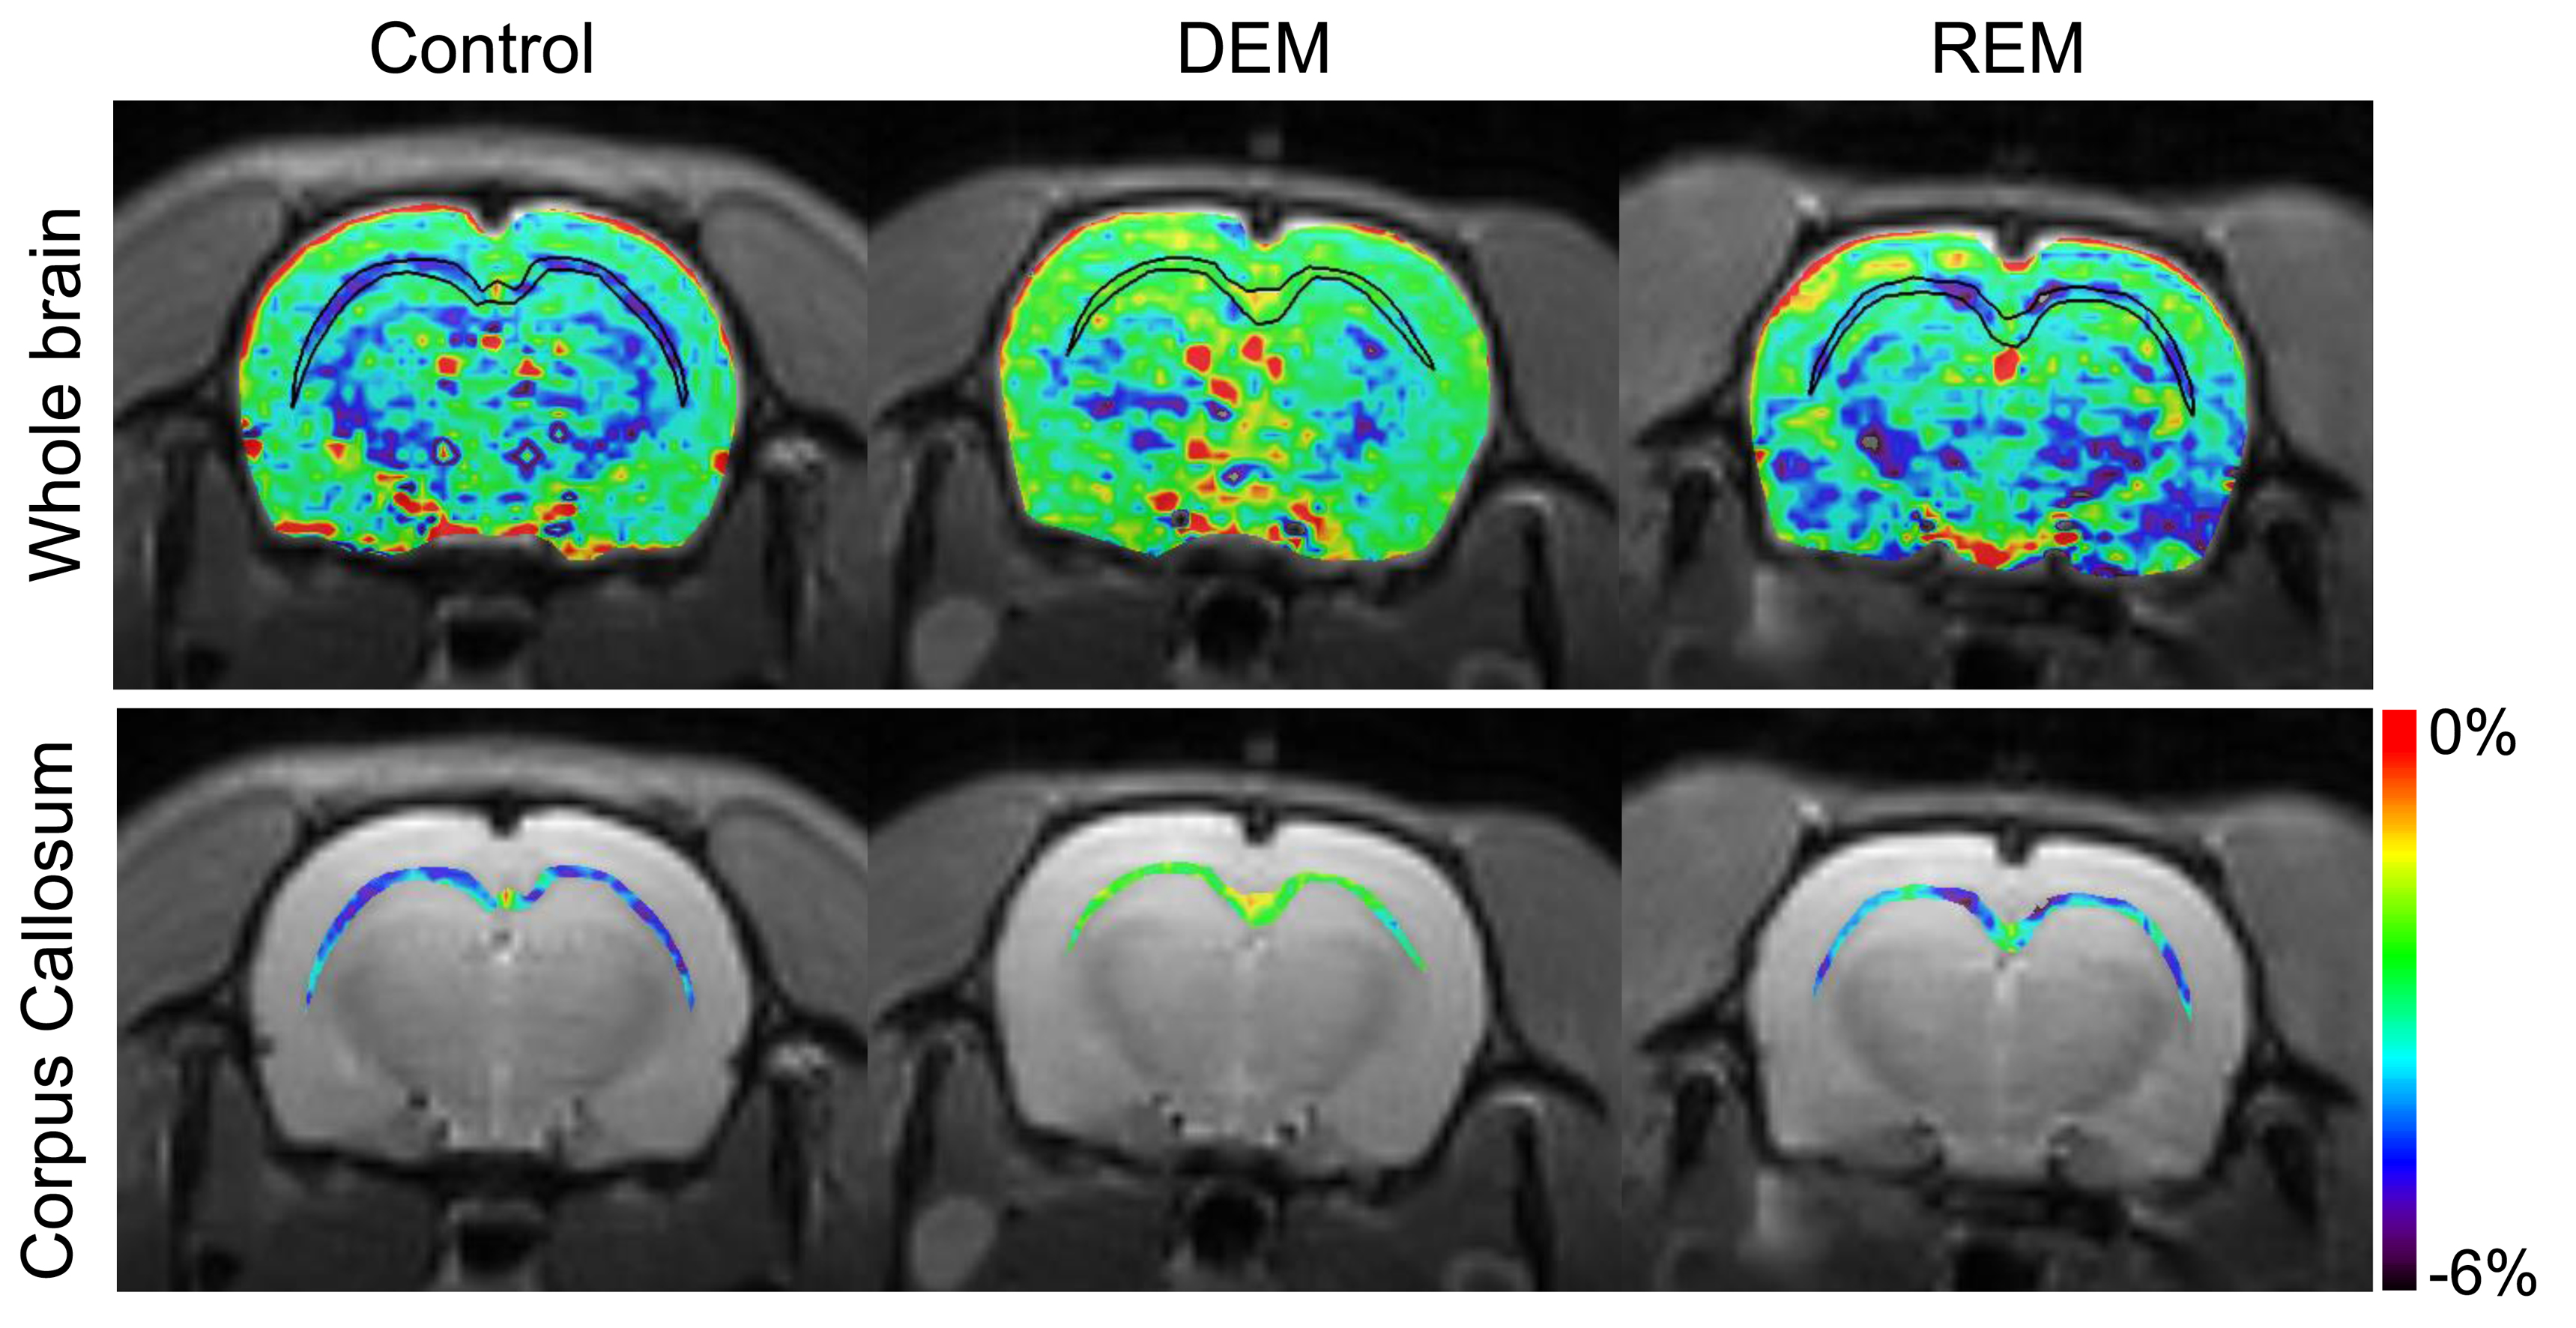
Figure 3. Reconstructed and
overlaid amide proton transfer-weighted (APTw) image of the whole-brain and the corpus callosum in an unsaturated
image of a typical rat in each group (control group, normal control group; DEM,
demyelinated group; and REM, remyelinated group). The black lines in the images
of the whole-brain area for all groups indicate the contour of the corpus
callosum. The color bar represents the range of calculated APTw signal (%).
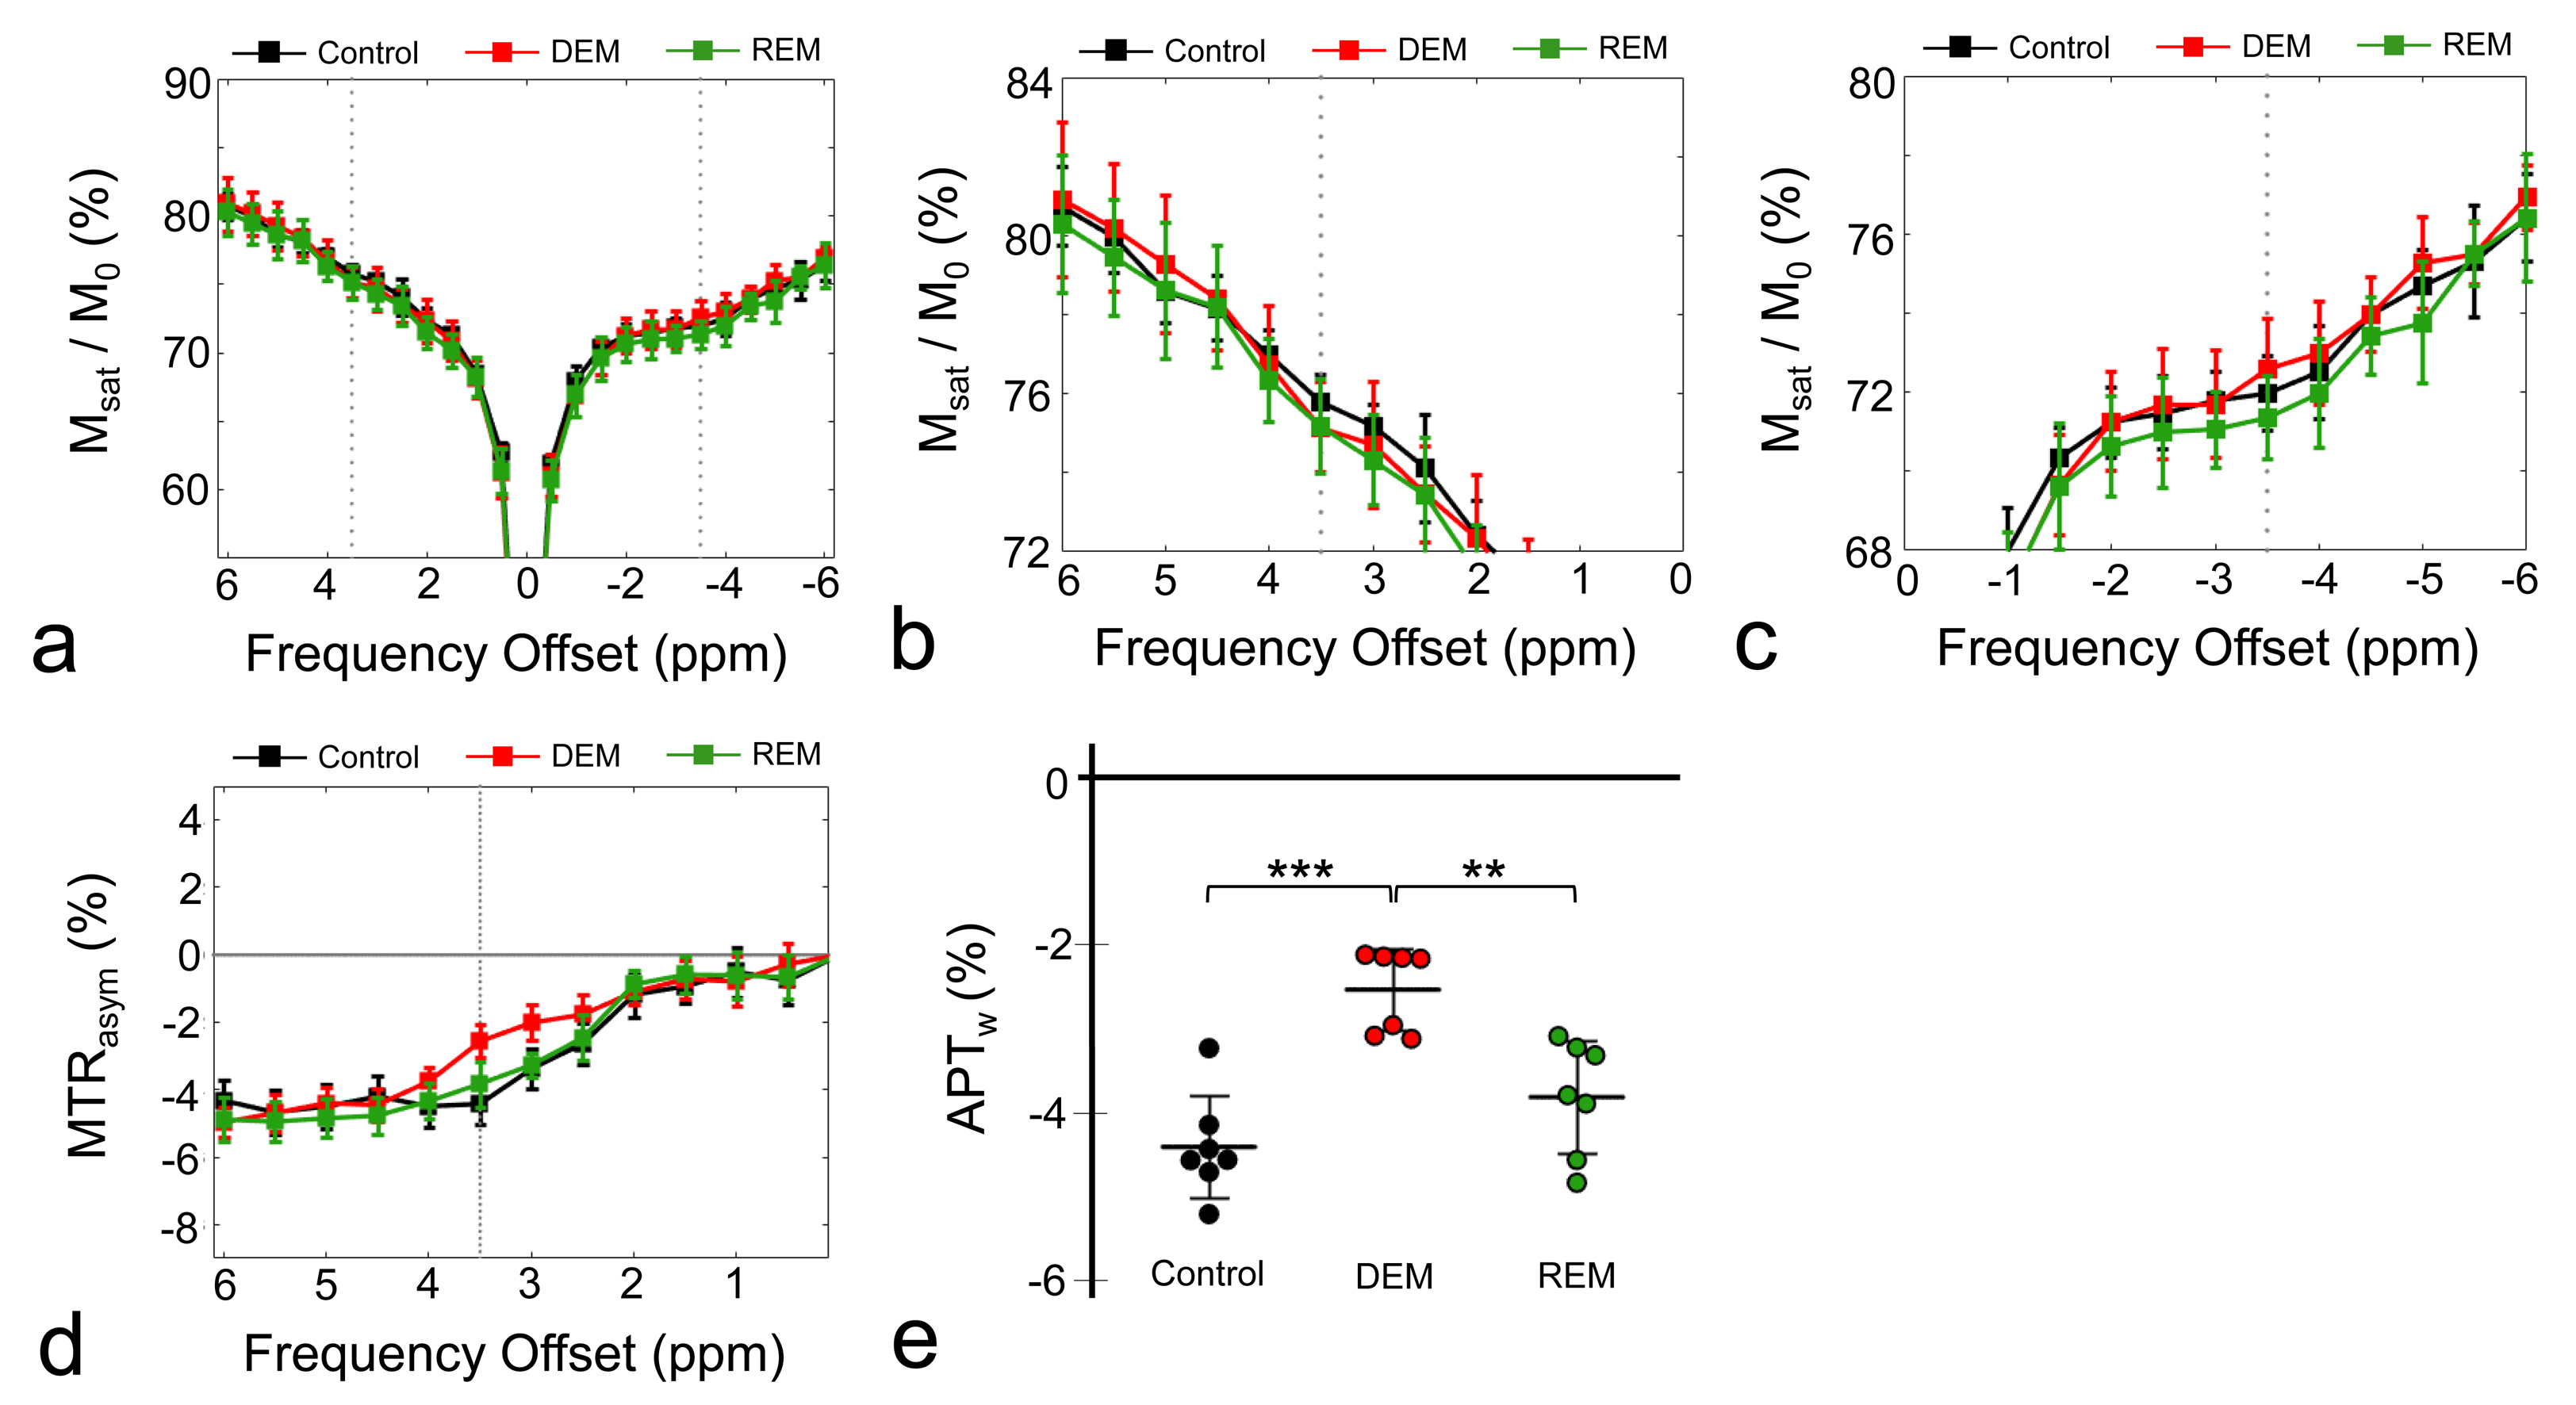
Figure 2. Averaged Z-spectra (a),
magnified Z-spectra from 0 to 6 ppm (b), magnified Z-spectra from -6 to 0 ppm
(c) , magnetization transfer ratio asymmetry (MTRasym) curves (d), and amide
proton transfer-weighted (APTw) signals calculated in the corpus callosum at
each group (e) (Msat, signal intensity with RF saturation; M0, signal intensity
without RF saturation; controls, black; DEM, demyelinated group, red; and REM,
remyelinated group, green). **p = .009 and ***p < .001.