Zhichao Wang1, Yu Zhao2, Xu Yan3, Zhongshuai Zhang3, Caixia Fu3, Hui Tang4, and Jianqi Li1
1Shanghai Key Laboratory of Magnetic Resonance, School of Physics and Electronic Science, East China Normal University, Shanghai, China, 2Institute of Imaging Science, Vanderbilt University, Nashville, TN, United States, 3MR Collaboration NE Asia, Siemens Healthcare, Shanghai, China, 4Department of Radiology, Renji Hospital affiliated to Shanghai Jiao Tong University Medical College, Shanghai, China
1Shanghai Key Laboratory of Magnetic Resonance, School of Physics and Electronic Science, East China Normal University, Shanghai, China, 2Institute of Imaging Science, Vanderbilt University, Nashville, TN, United States, 3MR Collaboration NE Asia, Siemens Healthcare, Shanghai, China, 4Department of Radiology, Renji Hospital affiliated to Shanghai Jiao Tong University Medical College, Shanghai, China
Separating different targets is highly valuable for clinical application of CEST. In this study, the background
Z-spectra including only the magnetization transfer and direct saturation
effects was fitted by using neural network, then CEST and NOE maps were
obtained simultaneously.
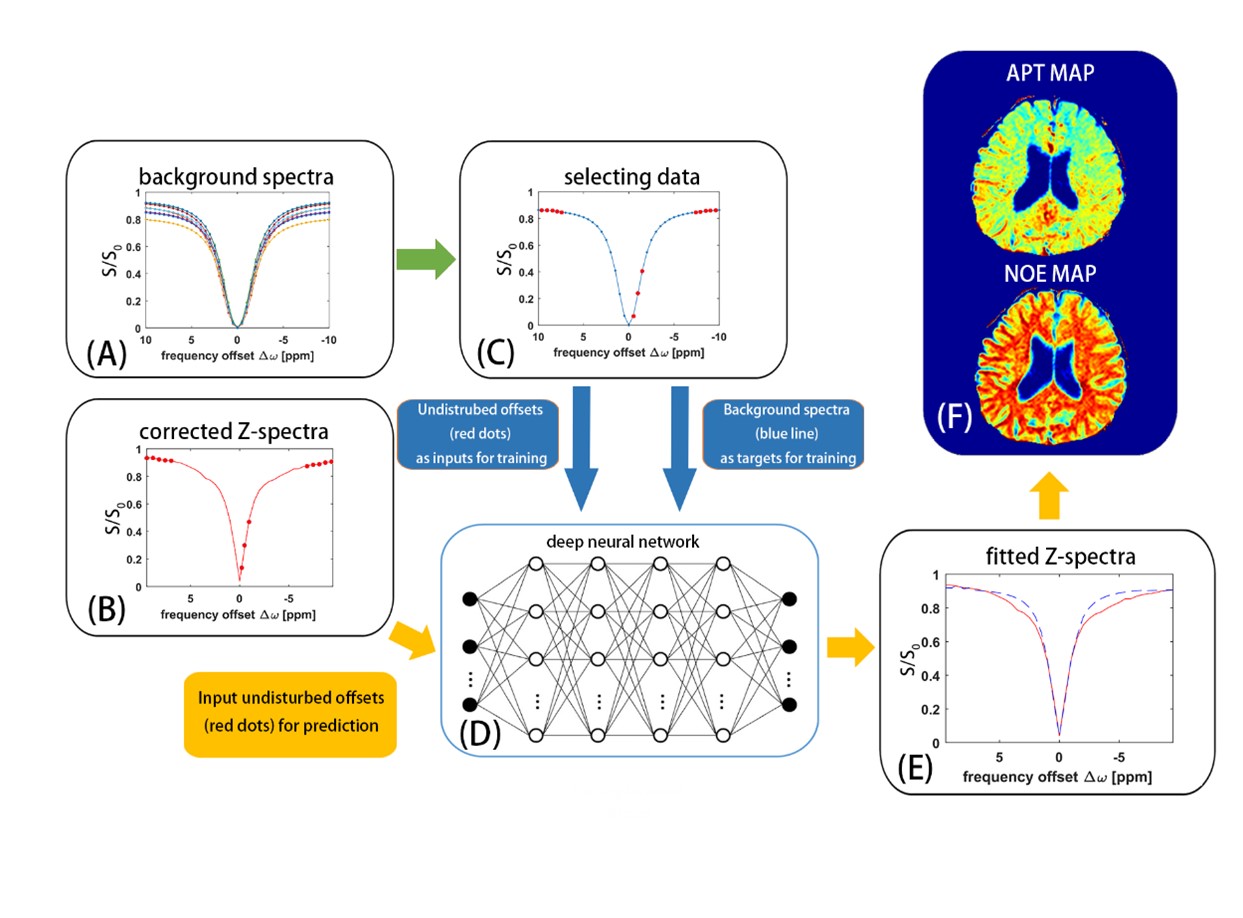
FIGURE 1 Schematic of data processing pipeline. Simulated background Z-spectrum
(A) are generated. In each simulated background Z-spectrum (C), the data marked
as red solid dots are inputted for training and the data in blue line are target
for training. (D)The feedforward neural network. (B) The data marked as red
solid dots from the acquired Z-spectrum are inputted for prediction. (E) The
background Z-spectrum (marked as dashed blue curve) is obtained from the network.
(F)The APT map and NOE map are obtained by subtracting background Z-spectrum from
the acquired Z-spectrum.
FIGURE
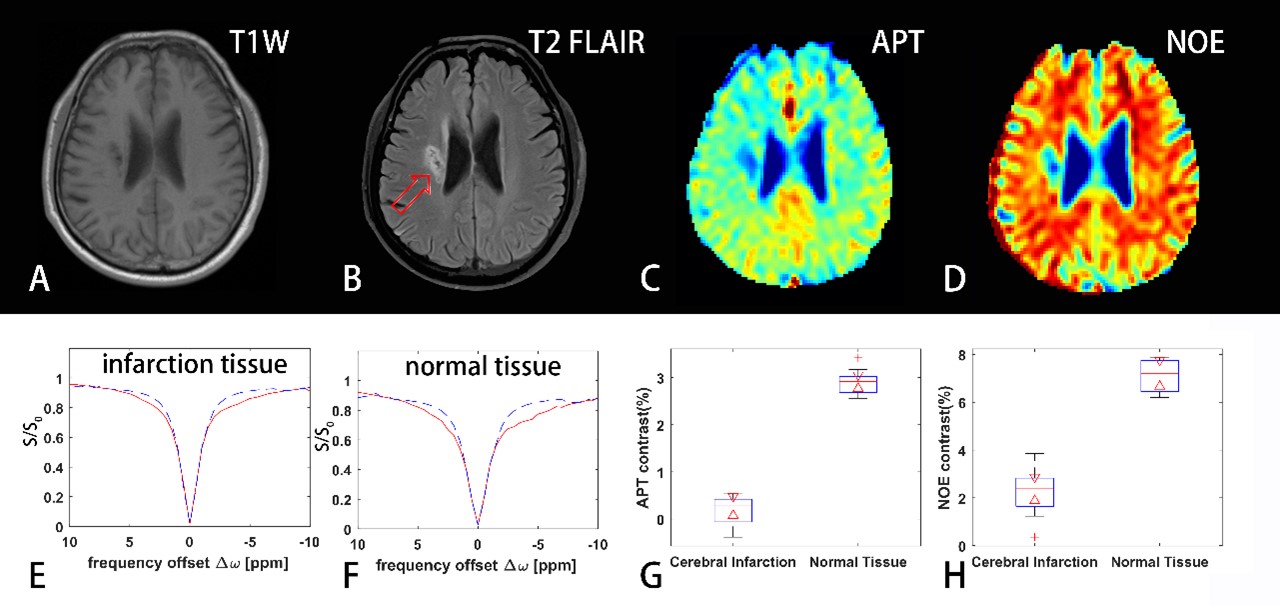
3 The
results from a patient with cerebral infarction. The 1st row
includes the
conventional T1-weighted image (A), T2-weighted FLAIR image (B), APT map (C) and
NOE map (D). The 2nd row includes the fitting Z- spectrum of infarction tissue (E) and normal
tissue (F), boxplots of APT contrast (G) and NOE contrast (H) between
infarction and normal tissues. In (E) and (F), the red curves are B0-corrected
Z- spectra, and the blue lines are background
Z- spectra from neural network fitting. The red arrow
in the T2W FLAIR image indicates the area of the lesion.