David Jing Ma1, Sabrina Gjerswold-Selleck2, Yanping Sun3, Matt Mattingly Mattingly4, and Jia Guo5
1Biomedical Engineering, Columbia University, New York, NY, United States, 2Columbia University, New York, NY, United States, 3Herbert Irving Comprehensive Cancer Centre, Columbia University, New York, NY, United States, 4Bruker BioSpin, Billerica, MA, United States, 5Department of Psychiatry, Columbia University, New York, NY, United States
1Biomedical Engineering, Columbia University, New York, NY, United States, 2Columbia University, New York, NY, United States, 3Herbert Irving Comprehensive Cancer Centre, Columbia University, New York, NY, United States, 4Bruker BioSpin, Billerica, MA, United States, 5Department of Psychiatry, Columbia University, New York, NY, United States
MEGA-PRESS is a feasible technique to measure GSH in the mouse brain in vivo at 9.4T.
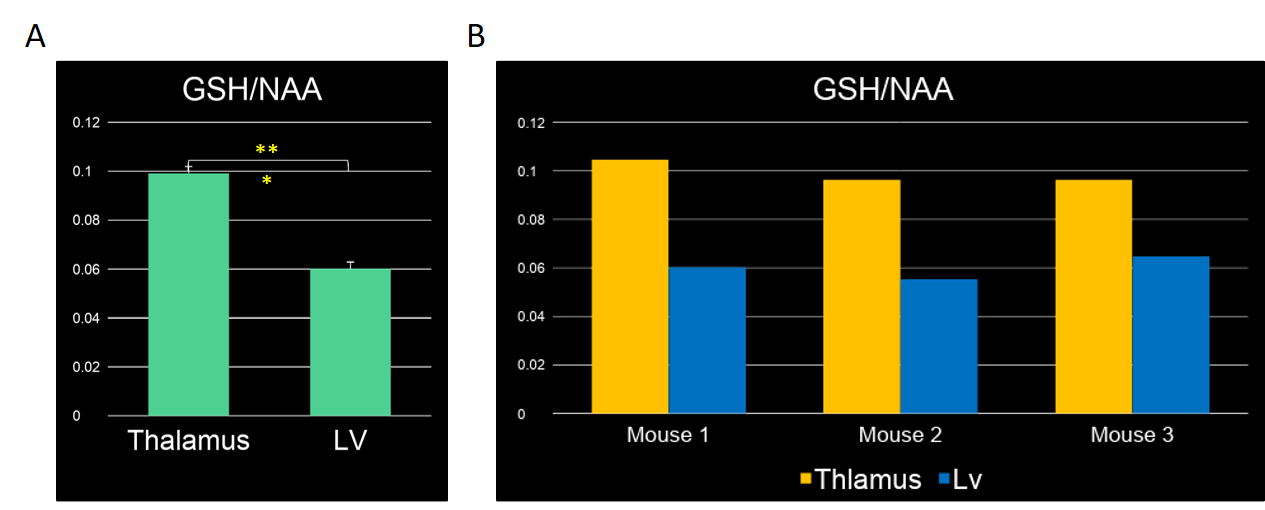
Figure 4: Graphical representation of the GSH content in different brain regions. [A] Bar graphs of GSH/NAA at the thalamus and at the lateral ventricle with Student's t‐test result. It can be seen that there is a significantly less GSH/NAA content in the region around the lateral ventricle compared to the thalamus. [B] Bar graphs of GSH/NAA for the thalamus and lateral ventricular for each individual mouse. It can be seen that thalamus has significantly greater GSH/NAA than the lateral ventricle.
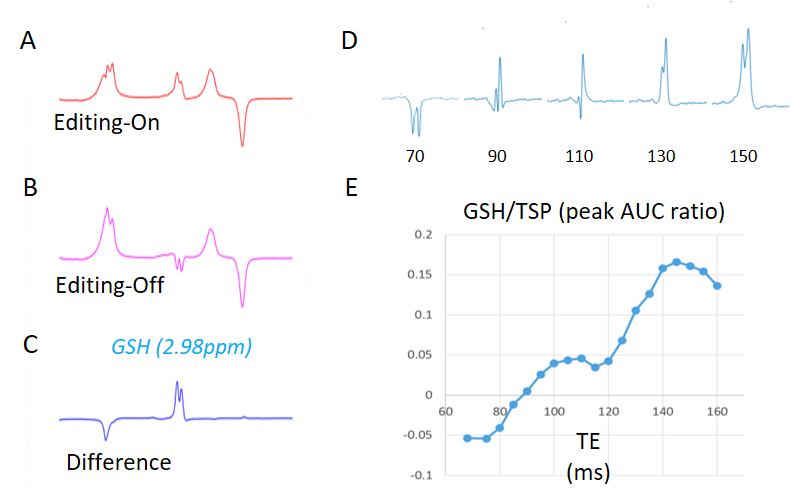
Figure 2: GSH detection in the phantom solution with J-edited 1H MRS. Figure indicates single-voxel spectra of the 30 mM GSH phosphate buffer solution (PBS) acquired at 37 ºC in 4 min. [A] ‘ON’ Spectra with editing pulse applied at 4.56 ppm. [B] ‘OFF’ spectra with editing pulse applied at 8 ppm. [C] Difference spectra between [A] and [B] showing edited GSH resonance at 2.98 ppm. [D] GSH peak graphs at the following TE: 68, 90, 110, 130 and 150. [E] Plot of the GSH peak area under the curve versus TE.