Charles S. Springer1, Brendan Moloney1, Eric Baker1, Martin M. Pike1, and Xin Li1
1Advanced Imaging Research Center, Oregon Health & Science University, Portland, OR, United States
1Advanced Imaging Research Center, Oregon Health & Science University, Portland, OR, United States
A map of awake, resting human brain homeostatic metabolic activity is shown for the first time. Sodium Pump enzymatic turnover [fmol(ATP)consumed/s/cell] is particularly high in brain white matter. This may have significant implications.
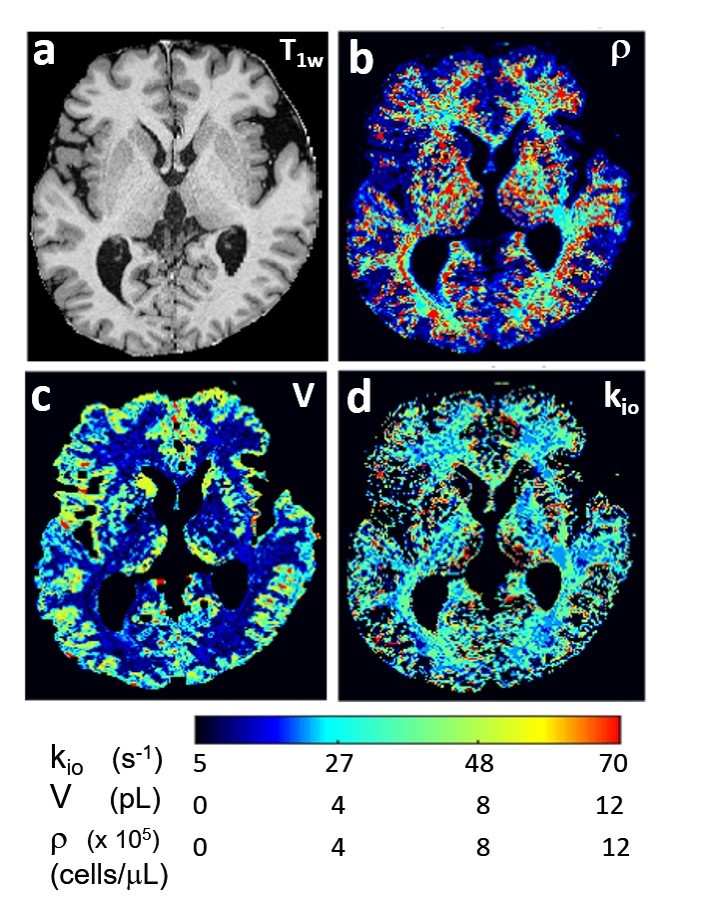
Figure 1. The first aMRI maps of an axial image slice of the awake, healthy resting human brain. Panel (a) is the T1-weighted image. Panel (b) maps the cell density, r (cells/μL). Panel (c) maps the average cell volume, V (pL). Panel (d) maps the cellular water efflux rate constant, kio (s-1), reflecting cytoplasmic Sodium Pump enzymatic turnover. Note the particularly large kio values in white matter [panel (d)].