Kaia Ingerdatter Sørland1, Mohammed R. S. Sunoqrot1, Pål Erik Goa2,3, Elise Sandsmark3, Sverre Langørgen3, Helena Bertilsson4,5, Gigin Lin6, Tone F. Bathen1,3, and Mattijs Elschot1,3
1Department of Circulation and Medical Imaging, Norwegian University of Science and Technology, Trondheim, Norway, 2Department of Physics, Norwegian University of Science and Technology, Trondheim, Norway, 3Department of Radiology and Nuclear Medicine, St. Olavs University Hospital, Trondheim, Norway, 4Department of Cancer Research and Molecular Medicine, Norwegian University of Science and Technology, Trondheim, Norway, 5Department of Urology, St. Olavs University Hospital, Trondheim, Norway, 6Department of Medical Imaging and Intervention, Chang Gung Memorial Hospital at Linkou, Institute for Radiological Research, Chang Gung University, Taoyuan, Taiwan
1Department of Circulation and Medical Imaging, Norwegian University of Science and Technology, Trondheim, Norway, 2Department of Physics, Norwegian University of Science and Technology, Trondheim, Norway, 3Department of Radiology and Nuclear Medicine, St. Olavs University Hospital, Trondheim, Norway, 4Department of Cancer Research and Molecular Medicine, Norwegian University of Science and Technology, Trondheim, Norway, 5Department of Urology, St. Olavs University Hospital, Trondheim, Norway, 6Department of Medical Imaging and Intervention, Chang Gung Memorial Hospital at Linkou, Institute for Radiological Research, Chang Gung University, Taoyuan, Taiwan
The Autoref reference tissue normalization of T2-weighted (T2W) MR images of the prostate significantly reduced inter-scan variation in a large, multicenter dataset of 989 axial T2W. This may be important for quantitative analysis of prostate cancer of T2W images.
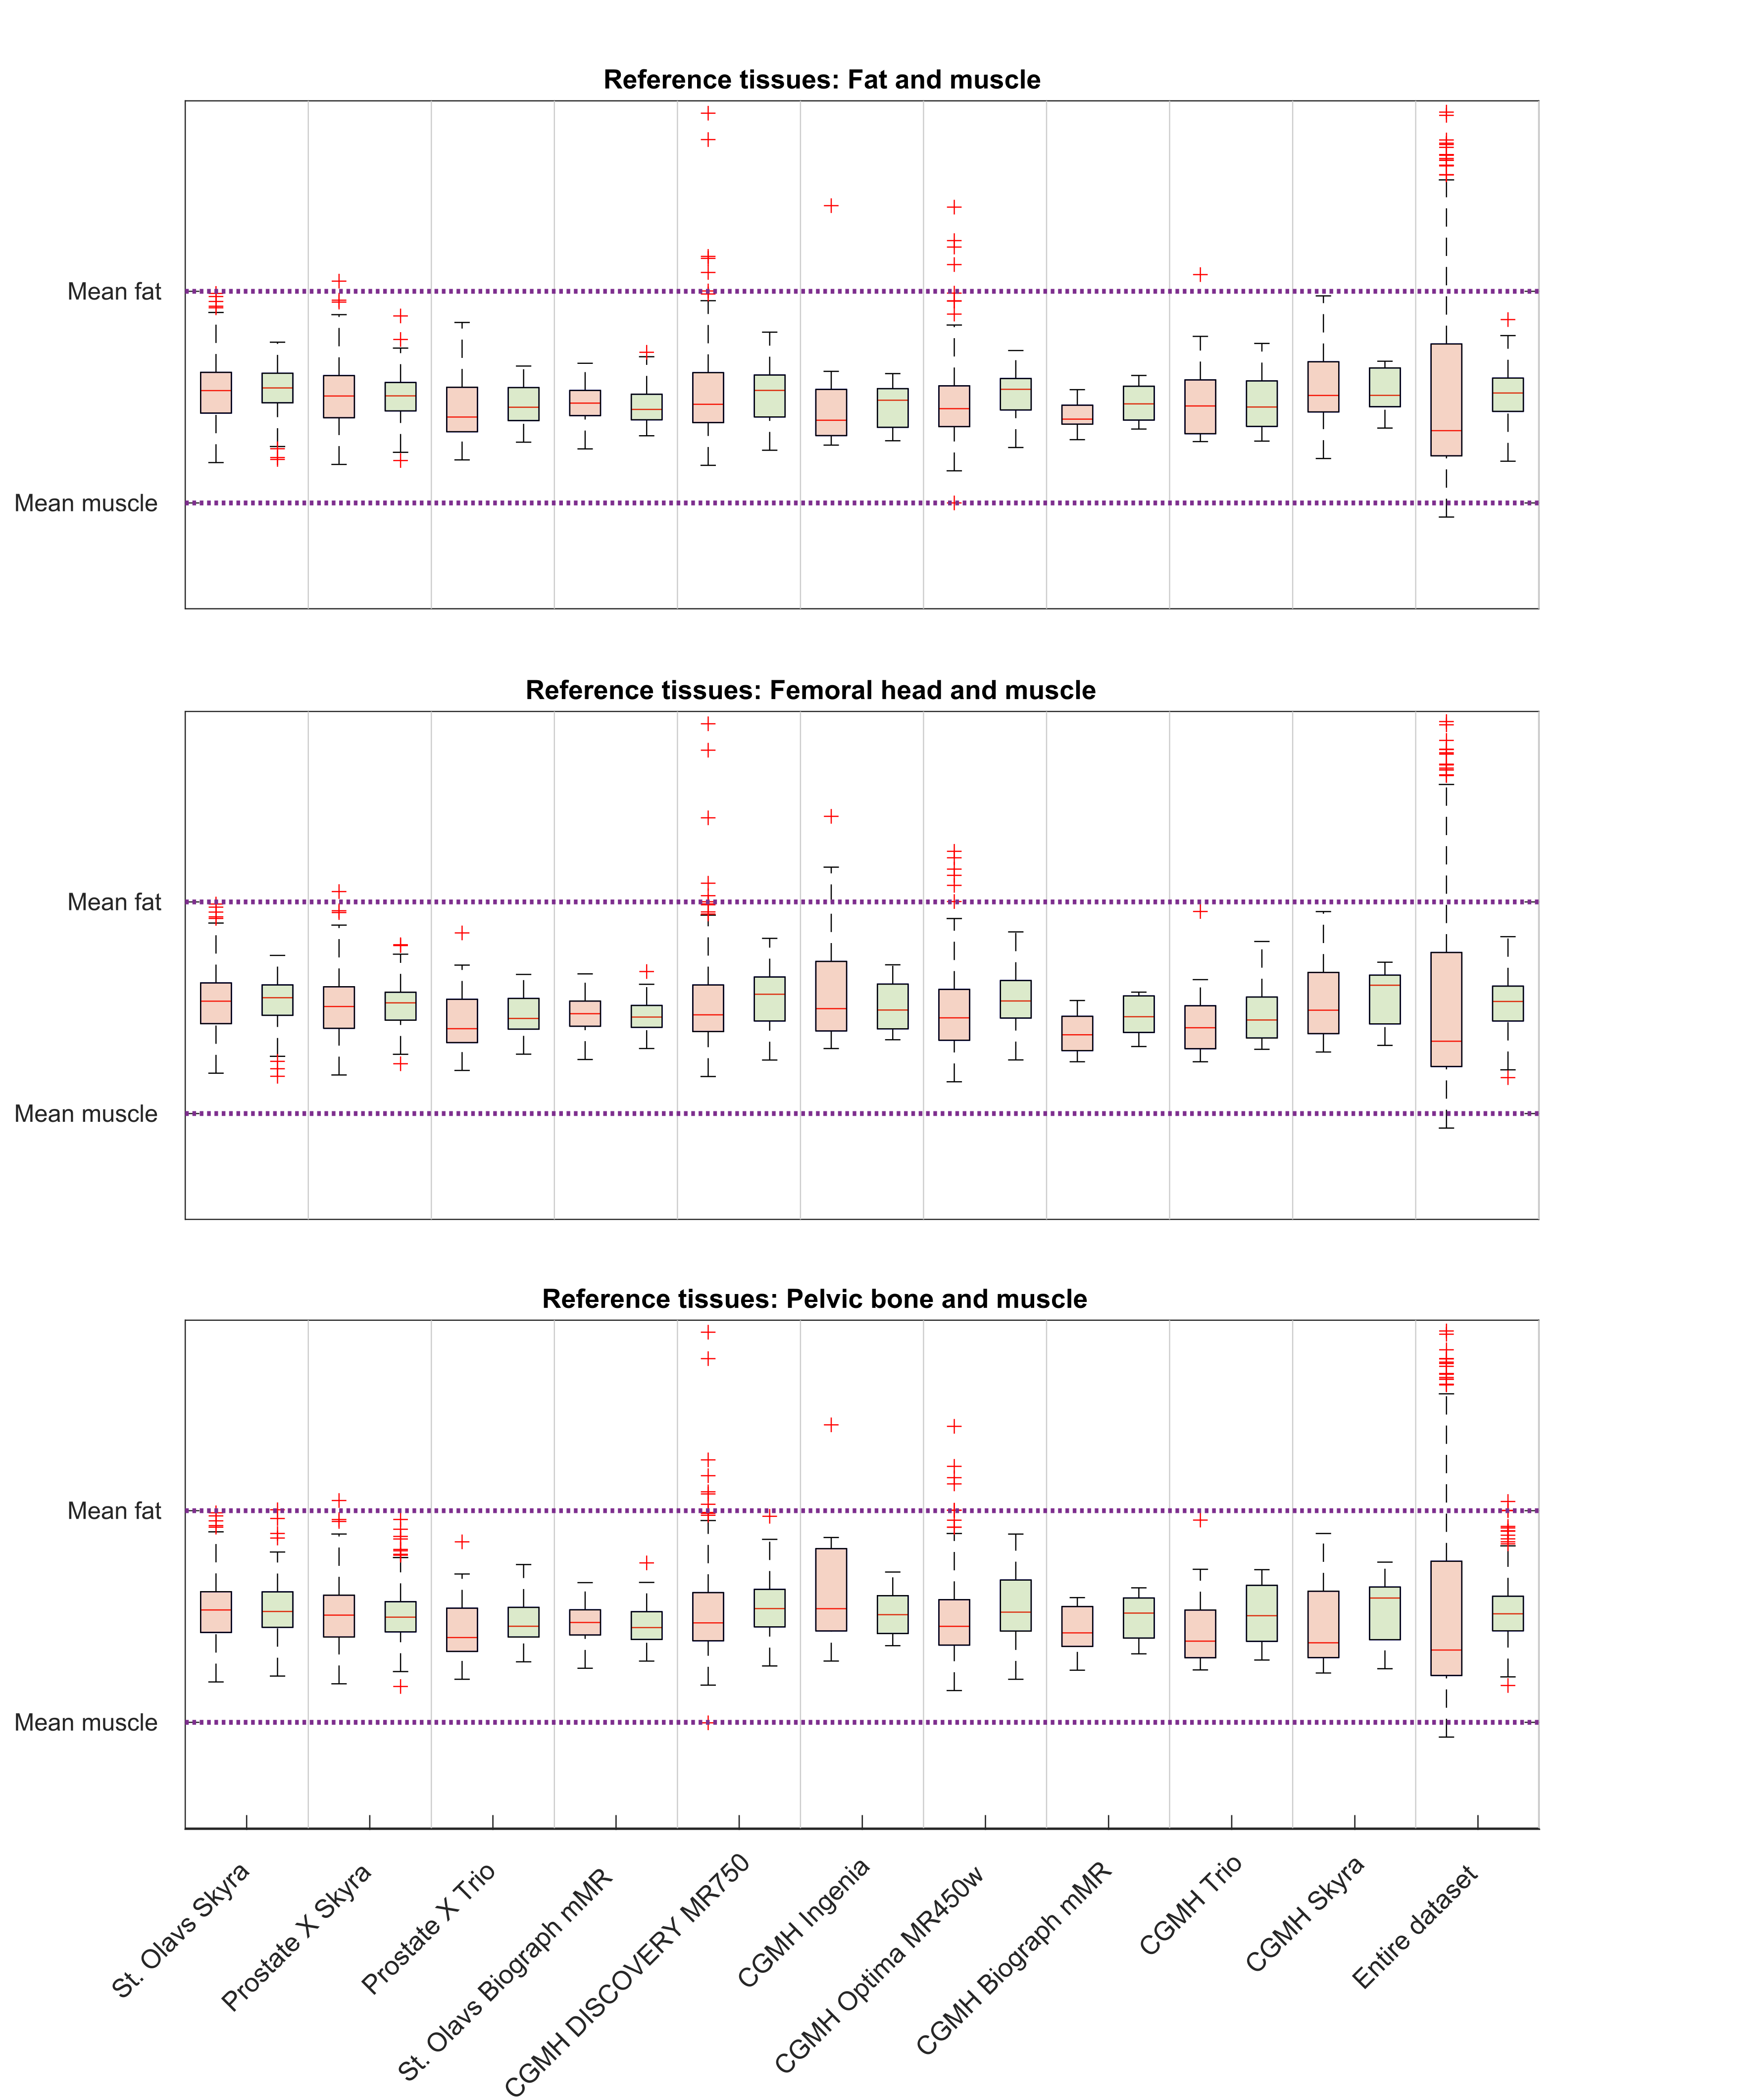
Figure 2: Box plots of the mean prostate intensities before and after normalization for all scanners and the entire test dataset. The red boxes are before normalization, and green are after. The dashed lines correspond to the mean fat and muscle intensity in each cohort, that have been aligned through scaling.
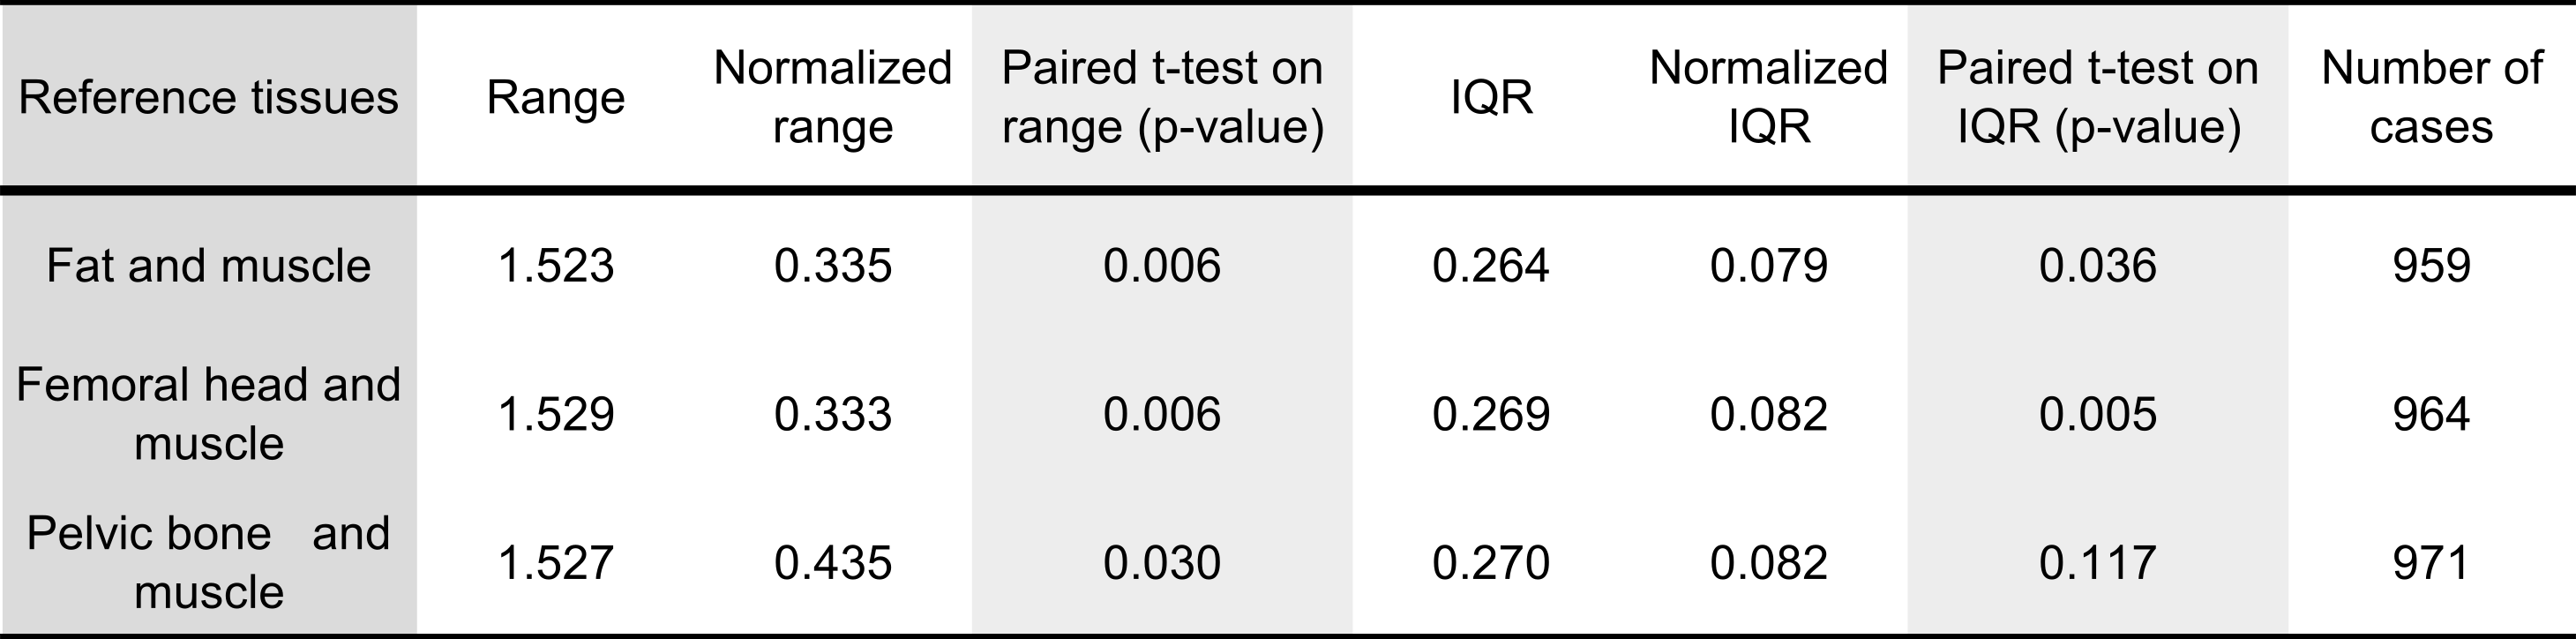
Table 3: The range and IQR in the scaled mean prostate intensities before and after normalization for the entire cohort. The variation in pre-normalization ranges comes from the exclusion of cases where the ROI detectors failed - leading to a slightly different dataset for each method.