Nandor K Pinter1,2, Sandeep Ganji3, Jan Petr4, Bela Ajtai 5, Harry Friel3, Joseph Fritz5, Laszlo Mechtler5, Alexander Fischer6, Frederik Barkhof7,8, and Henri Mutsaerts7,9
1Dent Neurologic Institute, Buffalo, NY, United States, 2Neurosurgery, University at Buffalo, Buffalo, NY, United States, 3Philips Healthcare, Gainesville, FL, United States, 4Helmholtz-Zentrum Dresden-Rossendorf, Dresden, Germany, 5Dent Neurologic Institute, Amherst, NY, United States, 6Philips Research Europe, Aachen, Germany, 7Dept of Radiology and Nuclear Medicine, Amsterdam University Medical Center, Amsterdam, Netherlands, 8Institute of Neurology, University College London, London, United Kingdom, 9Ghent Institute for Functional and Metabolic Imaging, Ghent, Belgium
1Dent Neurologic Institute, Buffalo, NY, United States, 2Neurosurgery, University at Buffalo, Buffalo, NY, United States, 3Philips Healthcare, Gainesville, FL, United States, 4Helmholtz-Zentrum Dresden-Rossendorf, Dresden, Germany, 5Dent Neurologic Institute, Amherst, NY, United States, 6Philips Research Europe, Aachen, Germany, 7Dept of Radiology and Nuclear Medicine, Amsterdam University Medical Center, Amsterdam, Netherlands, 8Institute of Neurology, University College London, London, United Kingdom, 9Ghent Institute for Functional and Metabolic Imaging, Ghent, Belgium
We created a semi-automated workflow for ASL analysis that can be utilized by clinical radiologists without special knowledge in image processing. We show that the ASL quantification results with this solution are comparable to academic image processing.
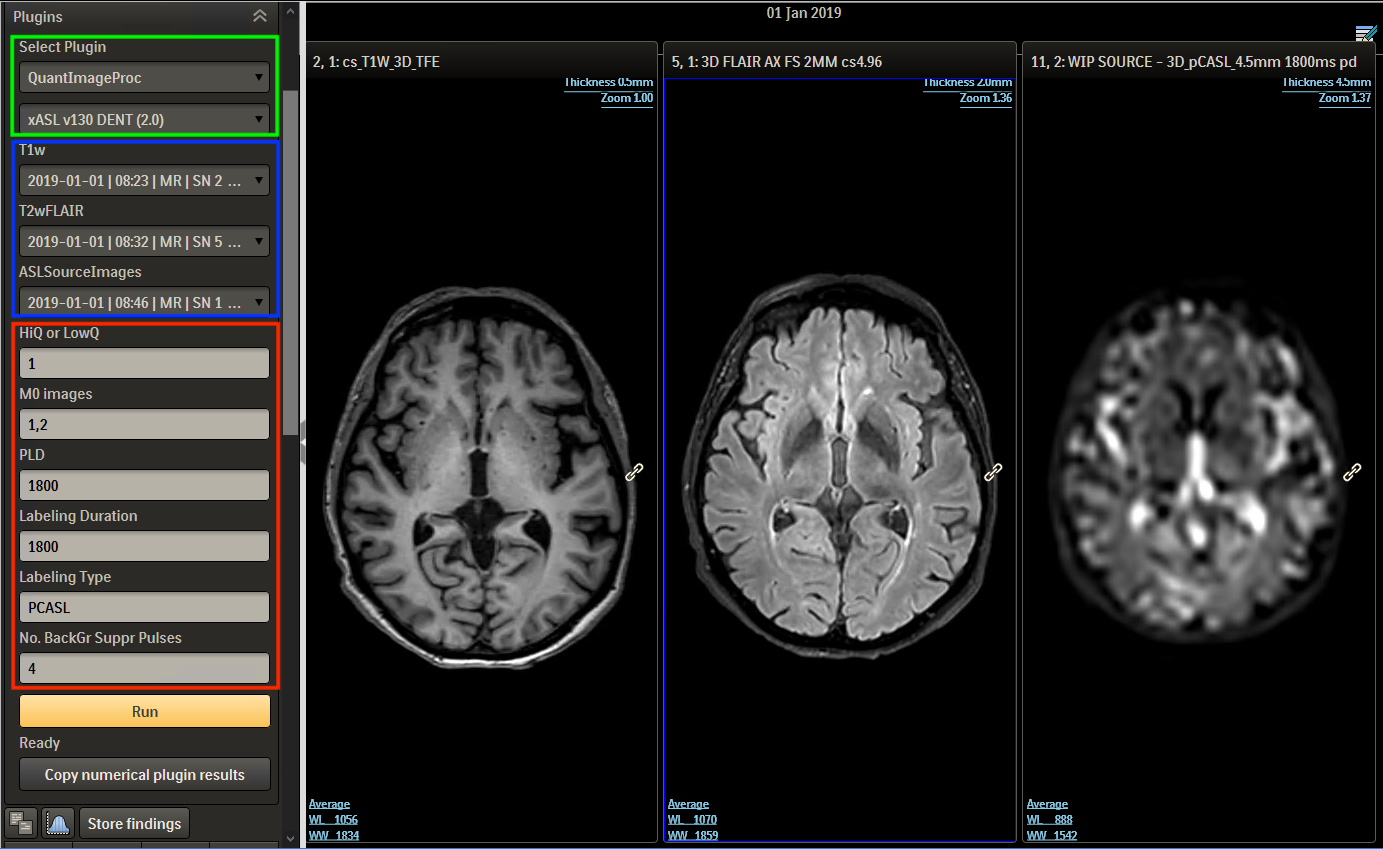
Figure 2. ISD workflow: Using the left panel the ExploreASL plugin (green frame) can be selected, which then prompts the user to select the T1, FLAIR and ASL series from the patient’s image list (blue frame). In the bottom part of the panel the analysis quality is defined and key ASL acquisition parameters are set (red frame), allowing the ASL processing to match the used scan parameters.
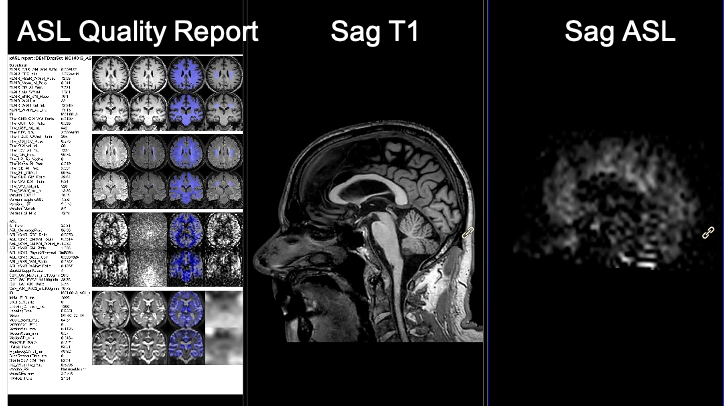
Figure 3. Visual output from the ISD plugin. The quantified CBF map (right) is co-registered with 3D T1 (middle), allowing for correct localization and visualization of T1-based Region Of Interest (ROI) on the CBF map. The left panel shows the quality report for the processing pipeline that allows for quick visual check of segmentation and provides CBF values for GM and WM.