Bin Shi1 and Jiang-Ning Dong1
1The First Affiliated Hospital of USTC, Anhui Provincial Cancer Hospital, Hefei, China
1The First Affiliated Hospital of USTC, Anhui Provincial Cancer Hospital, Hefei, China
By using IVIM-DWI and texture analysis on T2WI together, researchers can establish an imaging-based model related to the microcirculation system and tumor heterogeneity, to further acknowledge the disease and make more accurate decisions for treatment strategies.
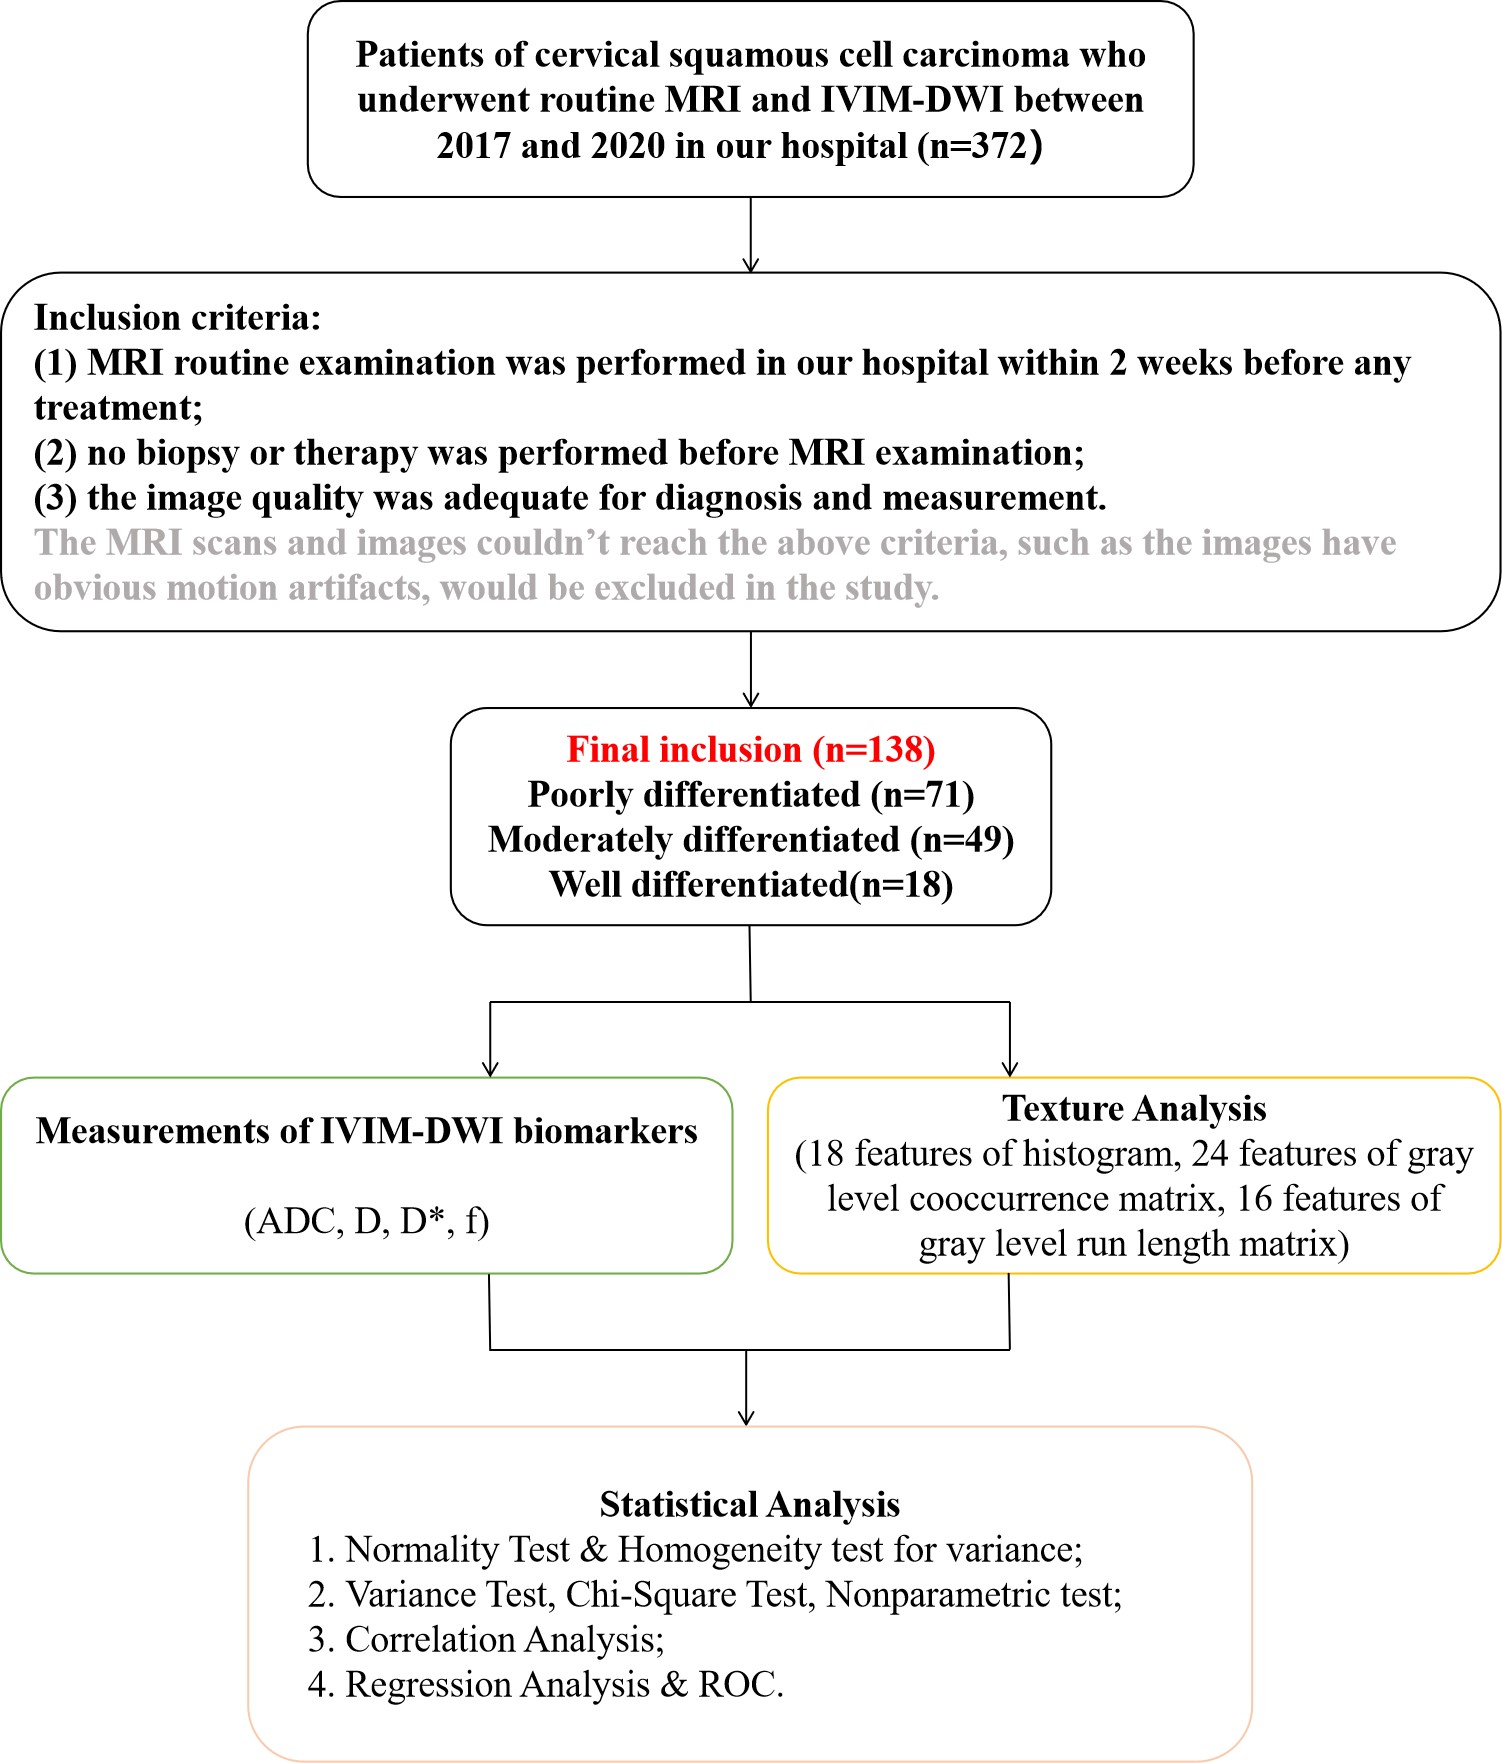
Fig. 1 The Steps of Image Acquisition and Statistical Analysis.
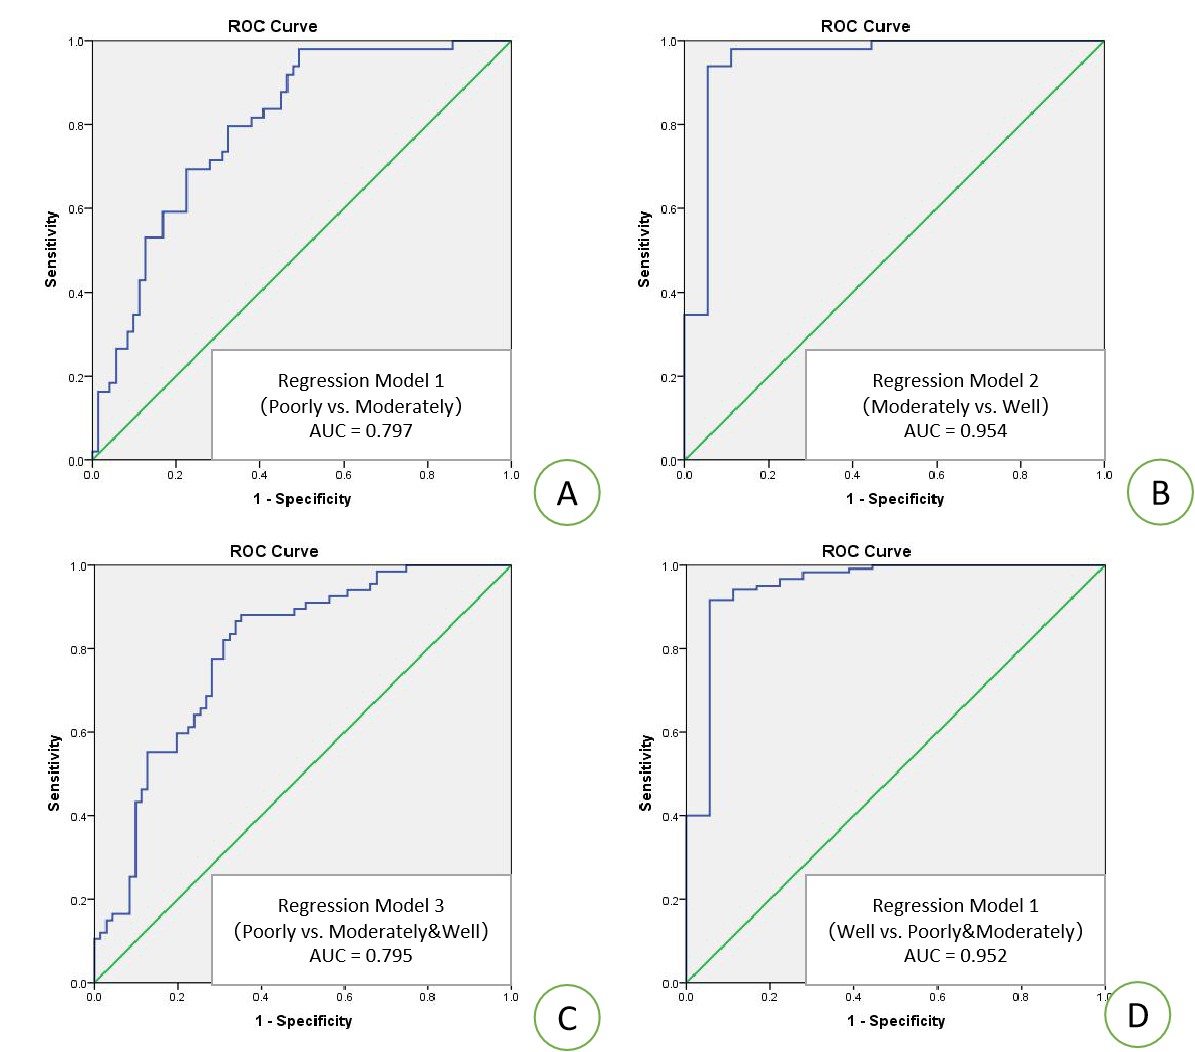
Fig. 5 Statistical Results of ROC Curves.
Panel A is the ROC curve of regression model 1 for the comparison of poorly vs. moderately groups. Panel B is the ROC curve of regression model 2 for the comparison of moderately vs. well groups. Panel C is the ROC curve of regression model 3 for the comparison of poorly vs. moderately&well groups. Panel D is the ROC curve of regression model 4 for the comparison of well vs. moderately&poorly groups.