Ruiming Chen1, Ante Zhu2, Jitka Starekova3, Daniel Seiter1, Kevin M. Johnson1,3, Scott B. Reeder1,3,4,5,6, Dinesh M. Shah7, Oliver Wieben1,3, and Diego Hernando1,3,4,8
1Medical Physics, University of Wisconsin - Madison, Madison, WI, United States, 2GE Global Research, Niskayuna, NY, United States, 3Radiology, University of Wisconsin - Madison, Madison, WI, United States, 4Biomedical Engineering, University of Wisconsin - Madison, Madison, WI, United States, 5Medicine, University of Wisconsin - Madison, Madison, WI, United States, 6Emergency Medicine, University of Wisconsin - Madison, Madison, WI, United States, 7Obstetrics and Gynecology, University of Wisconsin - Madison, Madison, WI, United States, 8Electrical and Computer Engineering, University of Wisconsin - Madison, Madison, WI, United States
1Medical Physics, University of Wisconsin - Madison, Madison, WI, United States, 2GE Global Research, Niskayuna, NY, United States, 3Radiology, University of Wisconsin - Madison, Madison, WI, United States, 4Biomedical Engineering, University of Wisconsin - Madison, Madison, WI, United States, 5Medicine, University of Wisconsin - Madison, Madison, WI, United States, 6Emergency Medicine, University of Wisconsin - Madison, Madison, WI, United States, 7Obstetrics and Gynecology, University of Wisconsin - Madison, Madison, WI, United States, 8Electrical and Computer Engineering, University of Wisconsin - Madison, Madison, WI, United States
In contrast to prior reports, T2* values did not vary statistically significantly between 14 and 20 weeks. No significant T2* value differences between obesity groups were observed. T2* histograms showed shape differences for subjects with and without pregnancy complications.
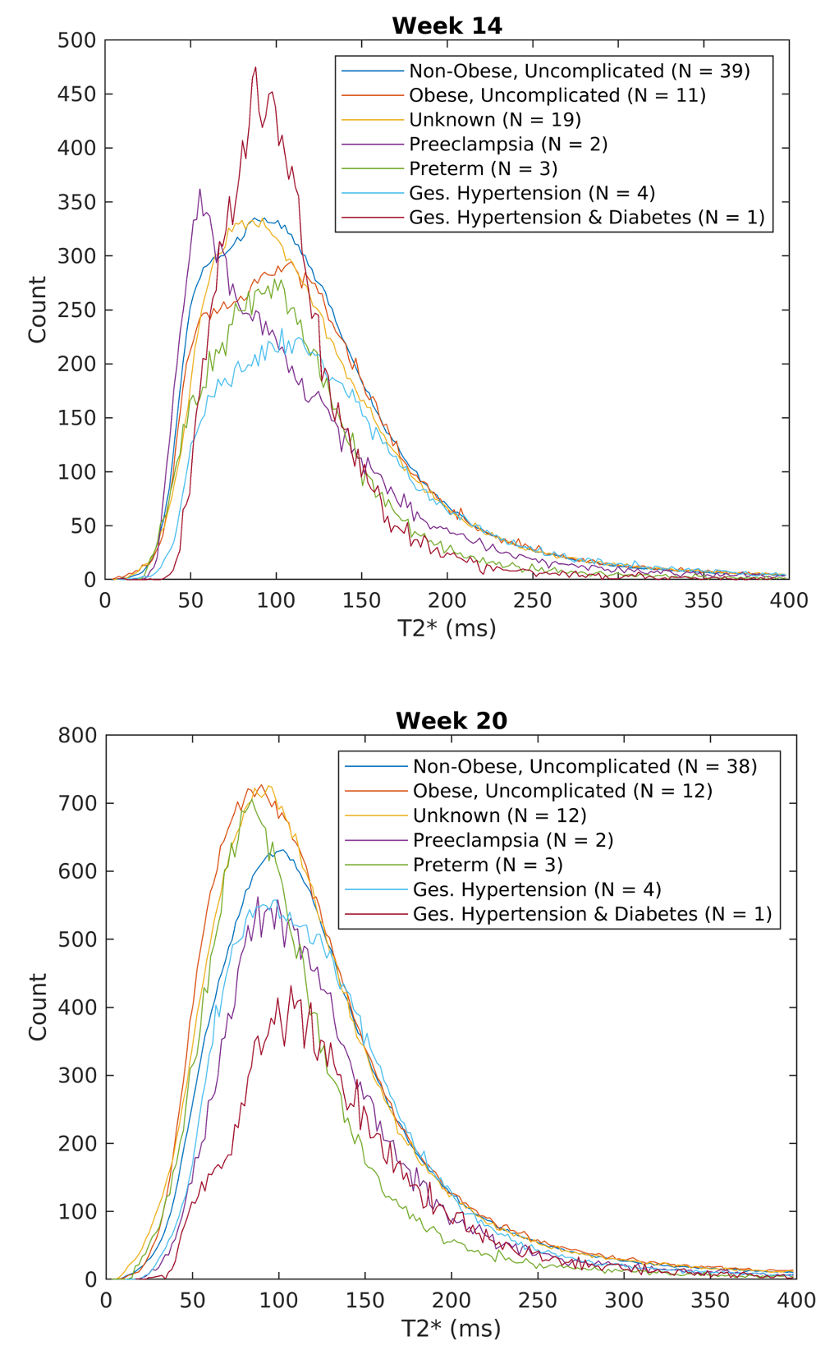
Figure 3. Averaged histograms of pixel-wise placental T2* values for week 14 and week 20 grouped by pregnancy complications. Here, ‘control’ means no reported pregnancy complications or outcomes and incudes obese and non-obese subjects.
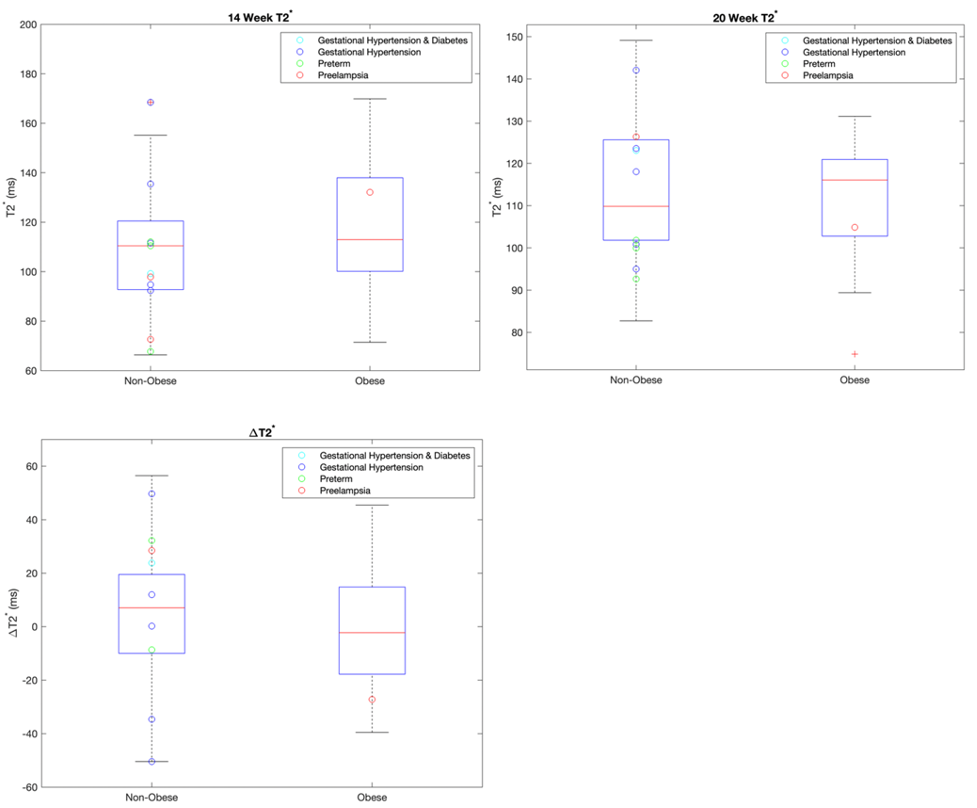
Figure 2. Box-and-whisker plots of 14-week, 20-week, and ΔT2* values, with the T2* values of abnormal gestational outcome overlaid on top. A trend of increased T2* and decreased T2* with gestation age is observed for non-obese and obese subjects, respectively. However, there are no significant differences in the T2* values for the two groups.