Aritrick Chatterjee1,2, Xiaobing Fan1, Aytekin Oto 1,2, and Gregory Karczmar1,2
1Department of Radiology, University of Chicago, Chicago, IL, United States, 2Sanford J. Grossman Center of Excellence in Prostate Imaging and Image Guided Therapy, Chicago, IL, United States
1Department of Radiology, University of Chicago, Chicago, IL, United States, 2Sanford J. Grossman Center of Excellence in Prostate Imaging and Image Guided Therapy, Chicago, IL, United States
Four Quadrant mapping
of HM-MRI data provides effective cancer markers, with cancers associated with high
PQ4, lower PQ2, and lower angle and amplitude of vectors representing cancer
voxels.
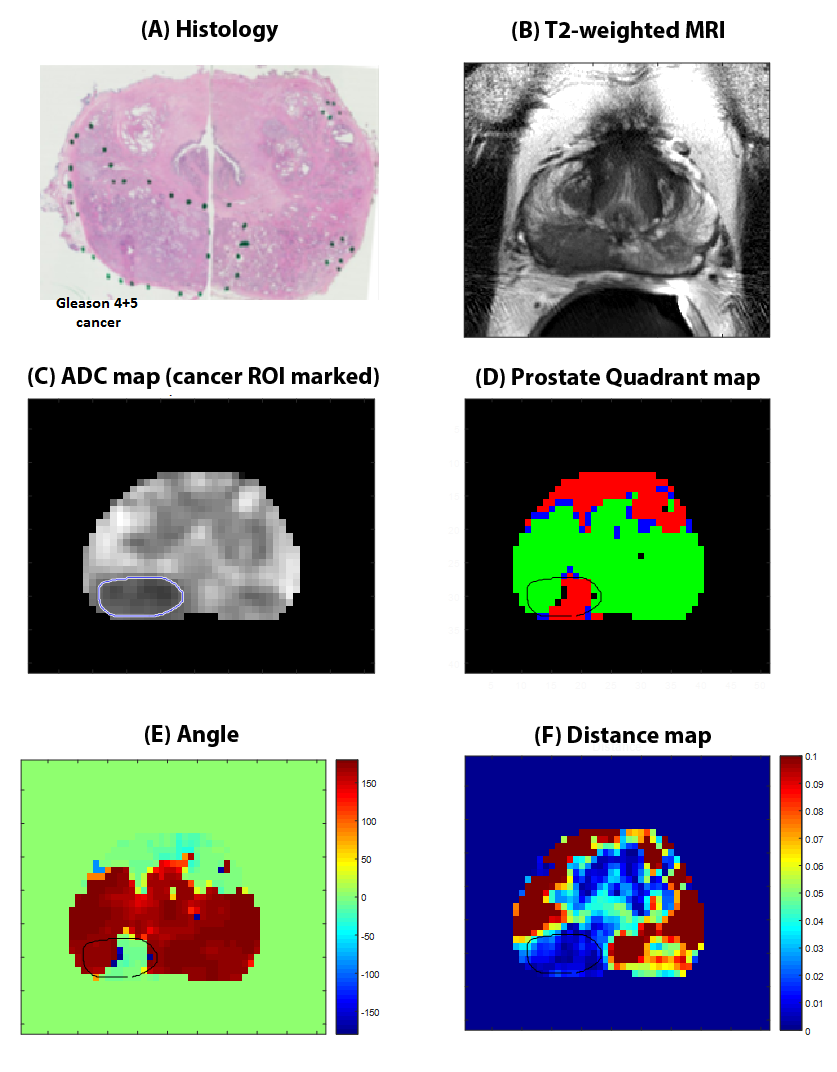
Figure 2: Representative
example of Four Quadrant mapping and associated metrics in a 60 years old
patient with Gleason 4+5 cancer in the right peripheral zone (outlined).
Histology image (A) and corresponding T2-weighted image (B), ADC map (C) with
prostate quadrant map (D), angle (E) and distance (F) are shown. Cancer is
associated with high PQ4. Vectors for cancer voxels have a lower angle (except
AFMS) and small amplitude. The cancer had
2% PQ1, 45% PQ2, 6% PQ3 and 47% PQ4 signal voxels.
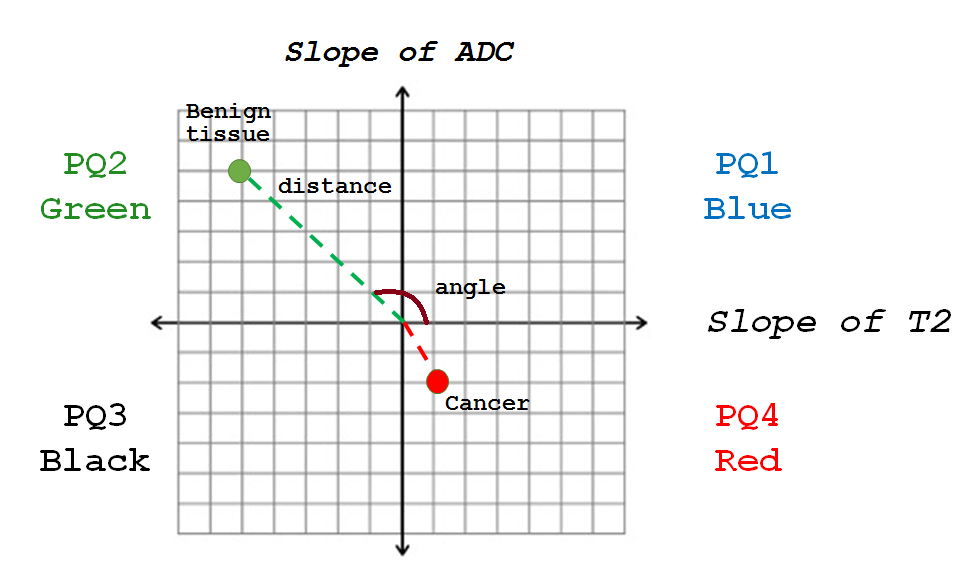
Figure 1: Four
Quadrant mapping scheme where each voxel in the prostate is a point in the 4
quadrant plot, where y = slope of ADC with varying TE, and x = slope of T2 with
varying b-value. Each voxel is associated with a distance from origin and an
angle. Benign tissue typically lies in quadrant 2 (high PQ2; green). The
distinctive property of aggressive cancers is that they have a higher
percentage of voxels in the 4th quadrant or high PQ4 (red). Cancer vectors tend
to have small amplitude and lie along the negative y axis.