Huijia Yin1, Dongdong Wang1, Ruifang Yan1, Xuekun Li1, Kaiyu Wang2, and Dongming Han1
1MR, the First Affiliated Hospital of Xinxiang Medical University, Xinxiang, China, 2MR Research China,GE Healthcare, Xinxiang, China
1MR, the First Affiliated Hospital of Xinxiang Medical University, Xinxiang, China, 2MR Research China,GE Healthcare, Xinxiang, China
In our study, the diagnostic value of DKI and APT for prostate cancer (PCa), as well as the risk assessment of PCa by using DKI and APT were analyzed. According to the results of the study, MTRasym(3.5ppm), MK and MD can be used to distinguish prostate cancer from BPH. ROC analysis showed that MK has the greatest diagnostic efficiency for PCa, which is consistent with the conclusions of other researchers. Meanwhile, these three parameters shows ability in the risk assessment of prostate cancer, which is consistent with previous research results. Our study also shows that MK and MTRasym(3.5ppm) respectively have an extremely and moderately strong positive correlation (r = 0.844, 0.640) with GS, and MD has an extremely strong negative correlation (r = -0.811) with GS. This implies that MK value has the strongest ability to predict GS of PCa, and some other researchers had the same conclusion. In summary, MK, MD and MTRasym(3.5ppm) values can be used to evaluate the potential invasion of PCa and have correlations with GS risk. In conclusion, both DKI and APT can be used to diagnose PCa and assess its risk without additional use of external contrast agent, but DKI shows better diagnostic efficiency.
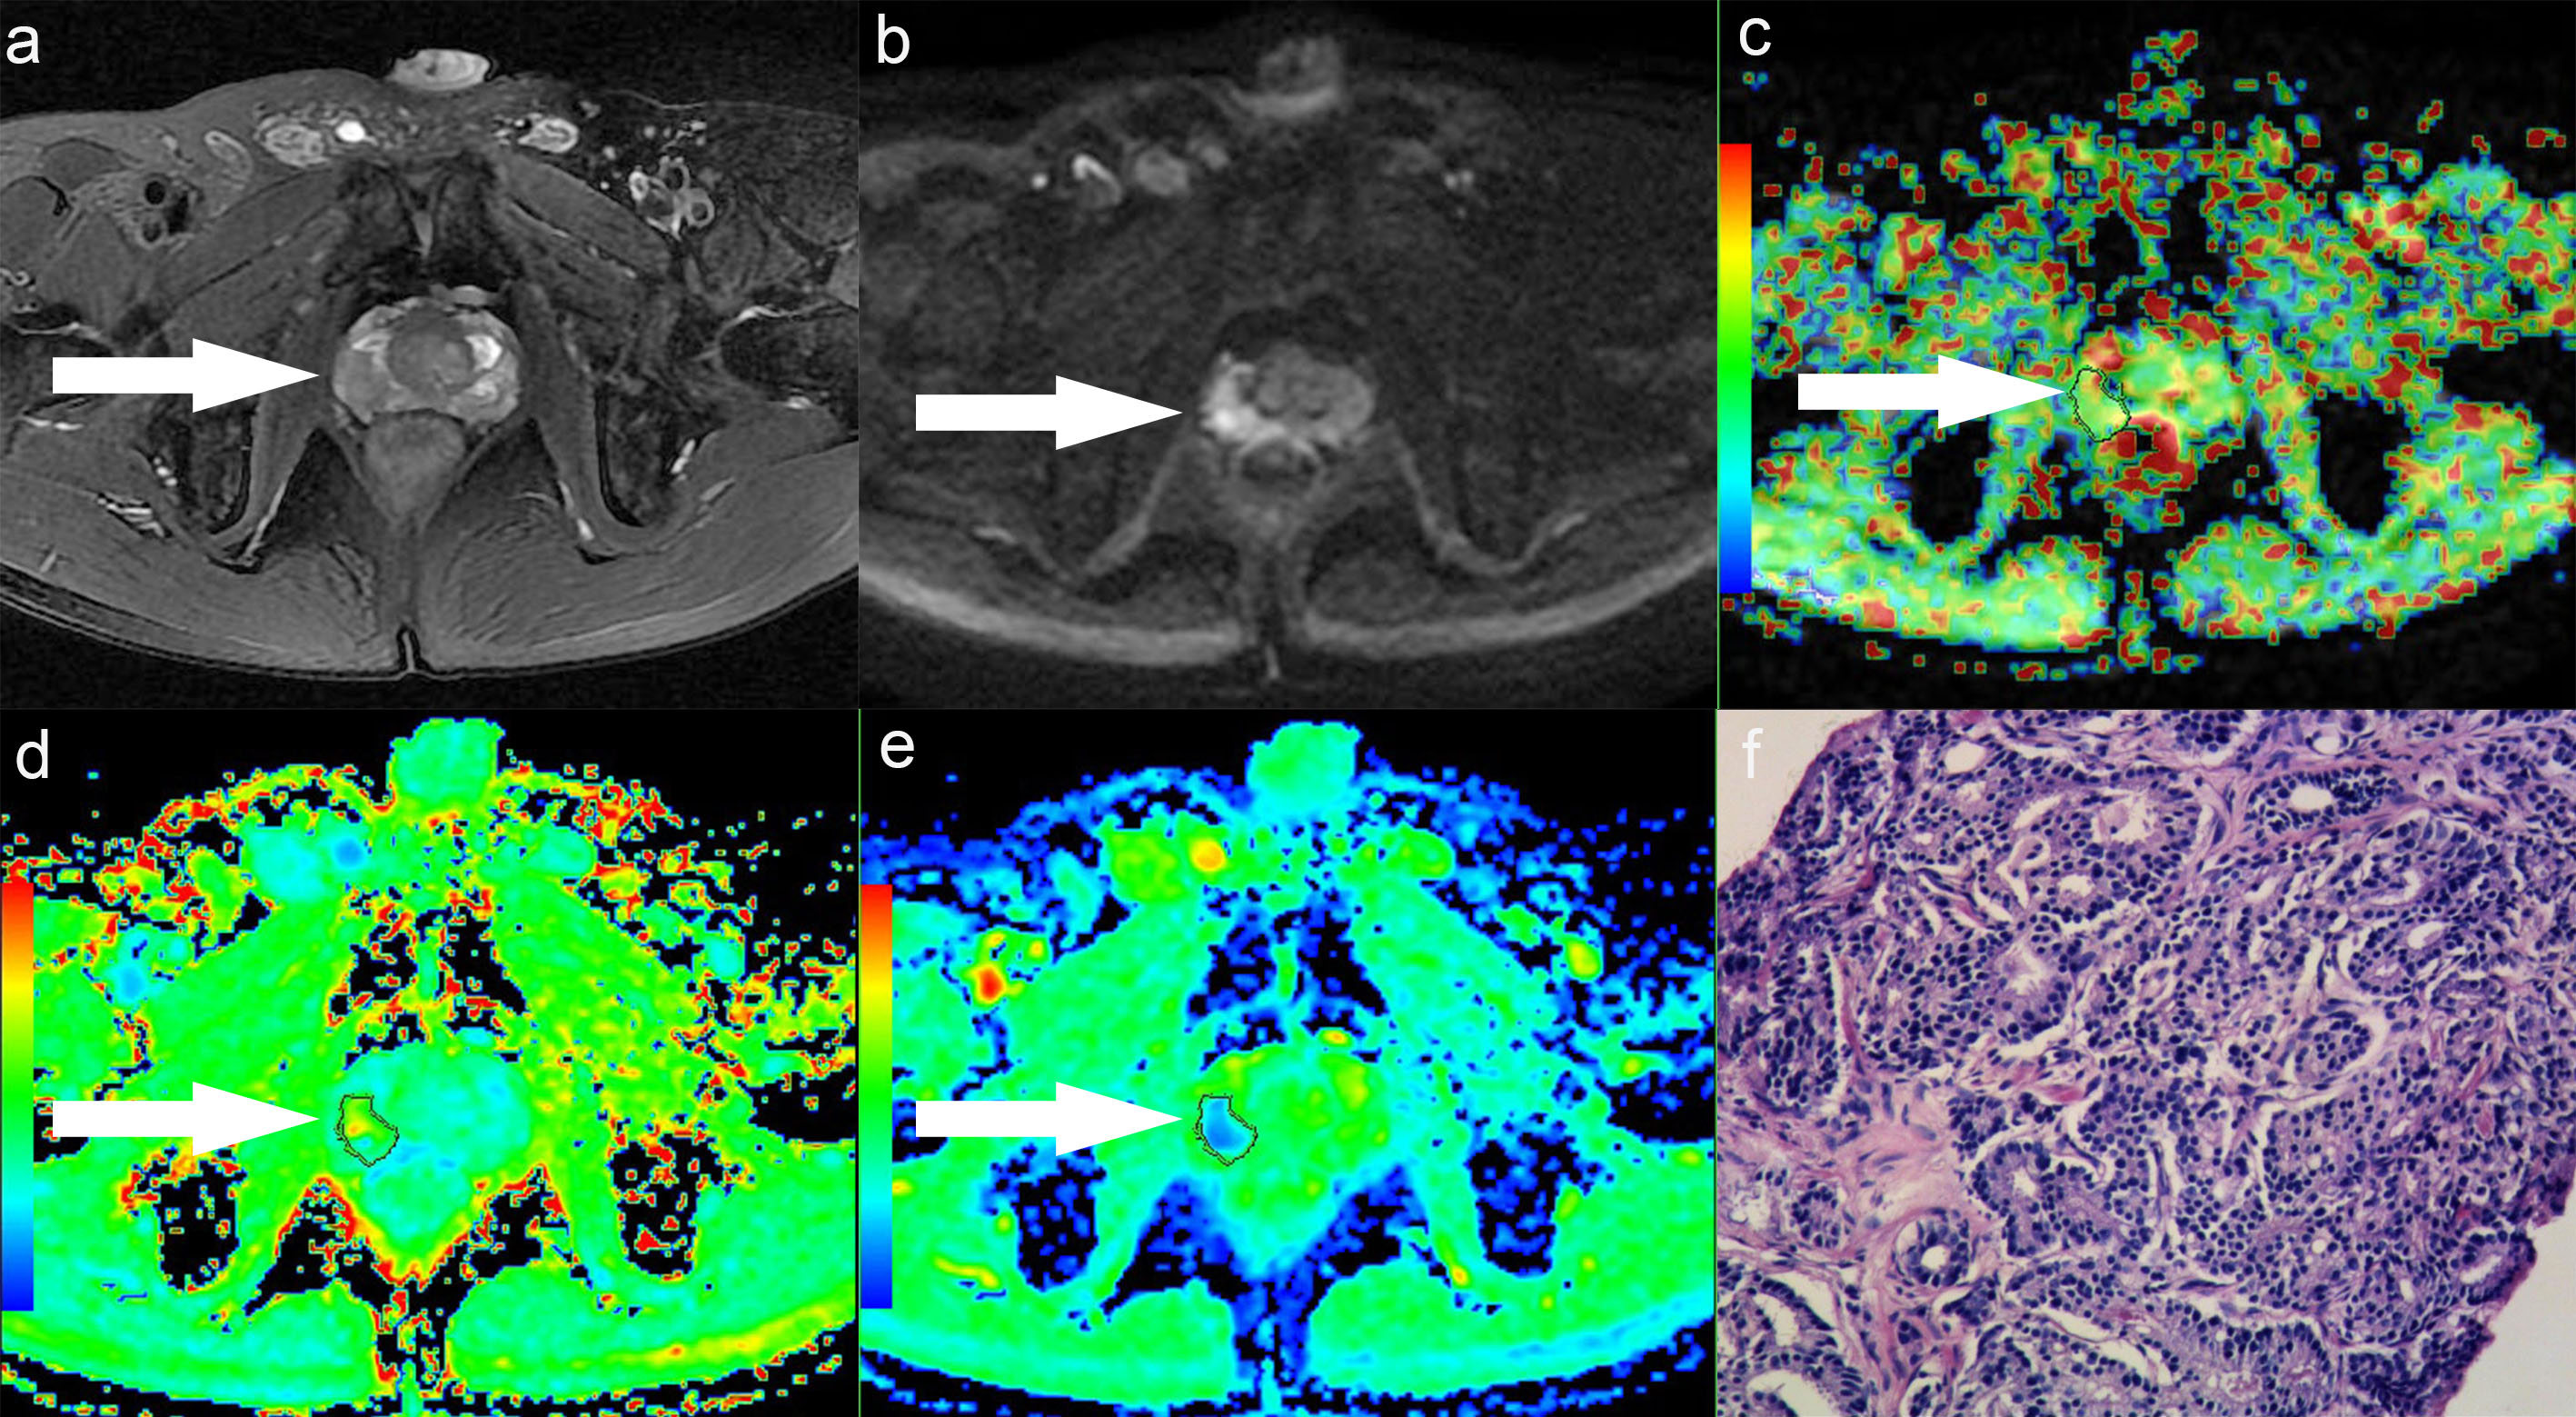
Figure.1 A 58-year-old man with PCa in right peripheral zone, GS is 8. (a) T2-weighted image shows hypointense signal in the lesion, (b) Diffusion-weighted imaging indicates hyperintense signal, (c) APT pseudo-colored map shows yellow-green pseudocolor in the lesion, (d) Mean kurtosis pseudo-colored map indicates red-yellow-green pseudocolor in the lesion, (e) Mean diffusivity pseudo-colored map shows blue-green pseudocolor in the lesion, (f) pathological image
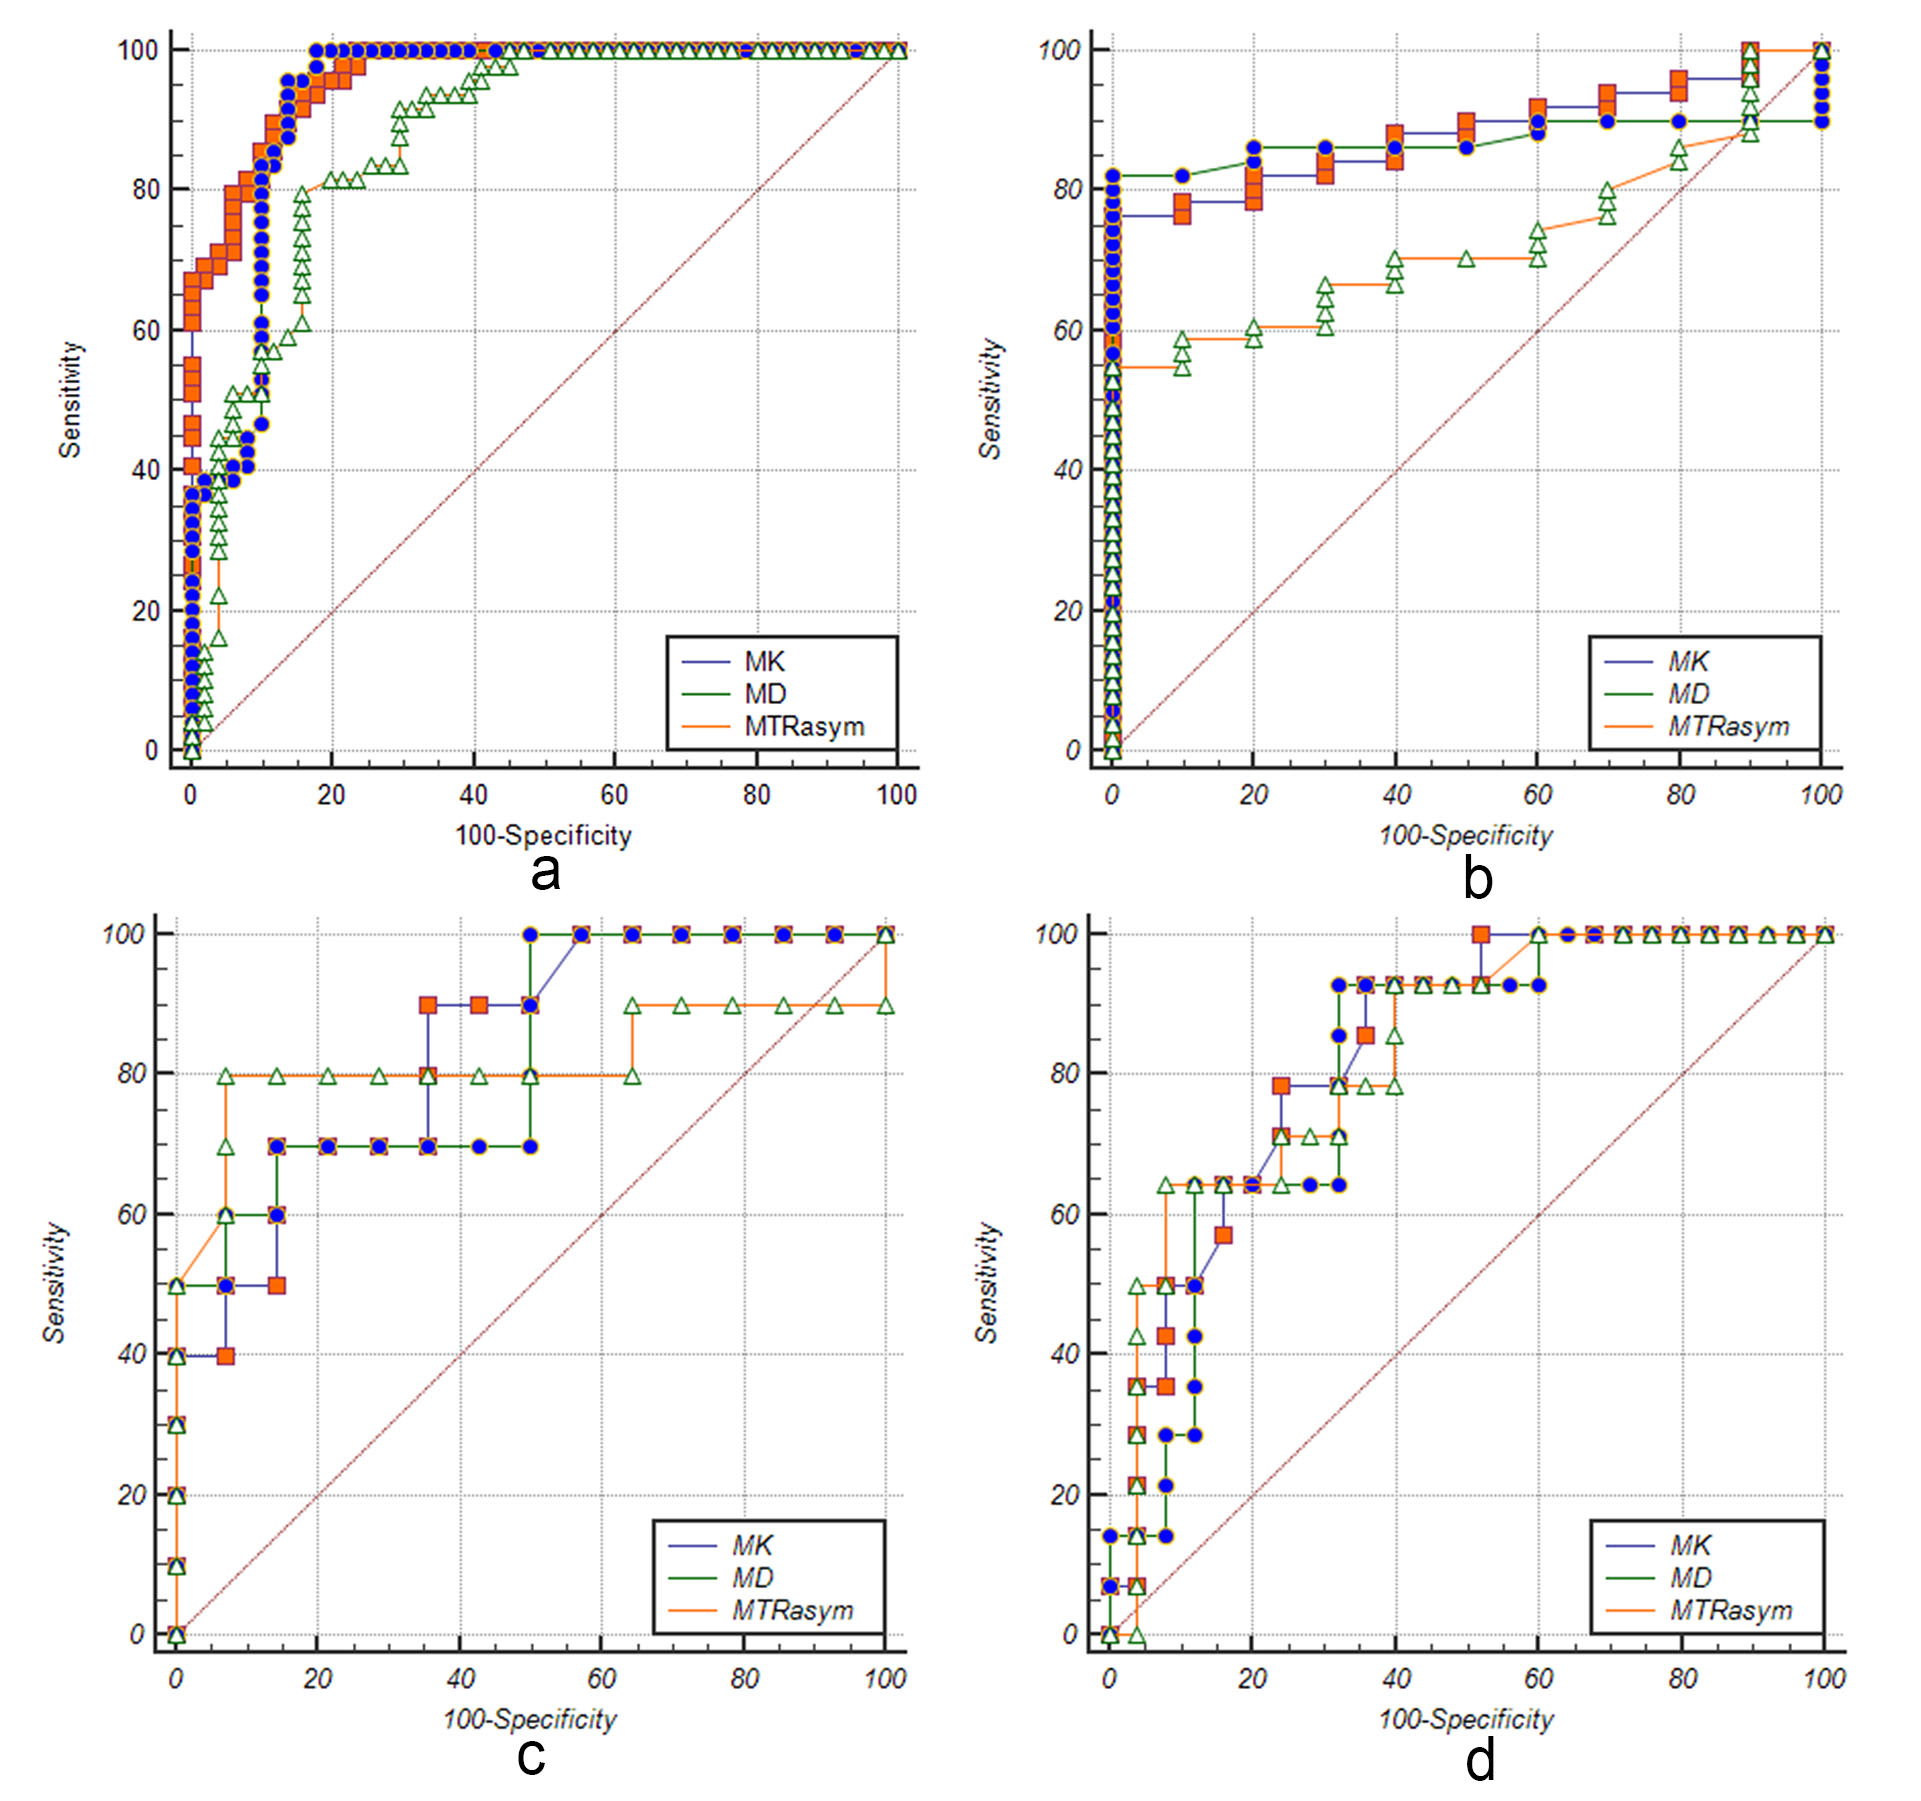
Figure.3 ROC curves of MK/MD/MTRasym(3.5ppm) values between BPH and PCa groups(a), BPH and low-risk groups (b), low-risk and intermediate-risk groups (c), intermediate-risk and high-risk groups (d), respectively.