Pegah Askari1, Ivan E Dimitrov1, Michael Levy1, Toral R Patel1, Edward Pan1, Bruce E Mickey1, Craig R Malloy1, Elizabeth A Maher1, and Changho Choi1
1University of Texas Southwestern Medical Center, Dallas, TX, United States
1University of Texas Southwestern Medical Center, Dallas, TX, United States
The lipid resonance
at 2.25 ppm often complicates 1H MRS evaluation of 2HG. Incorporating new lipid
basis sets in spectral fitting of 3T PRESS data from 43 glioma patients showed complete
distinction between IDH mutation and wildtype (accuracy, sensitivity, and
specificity all unity).
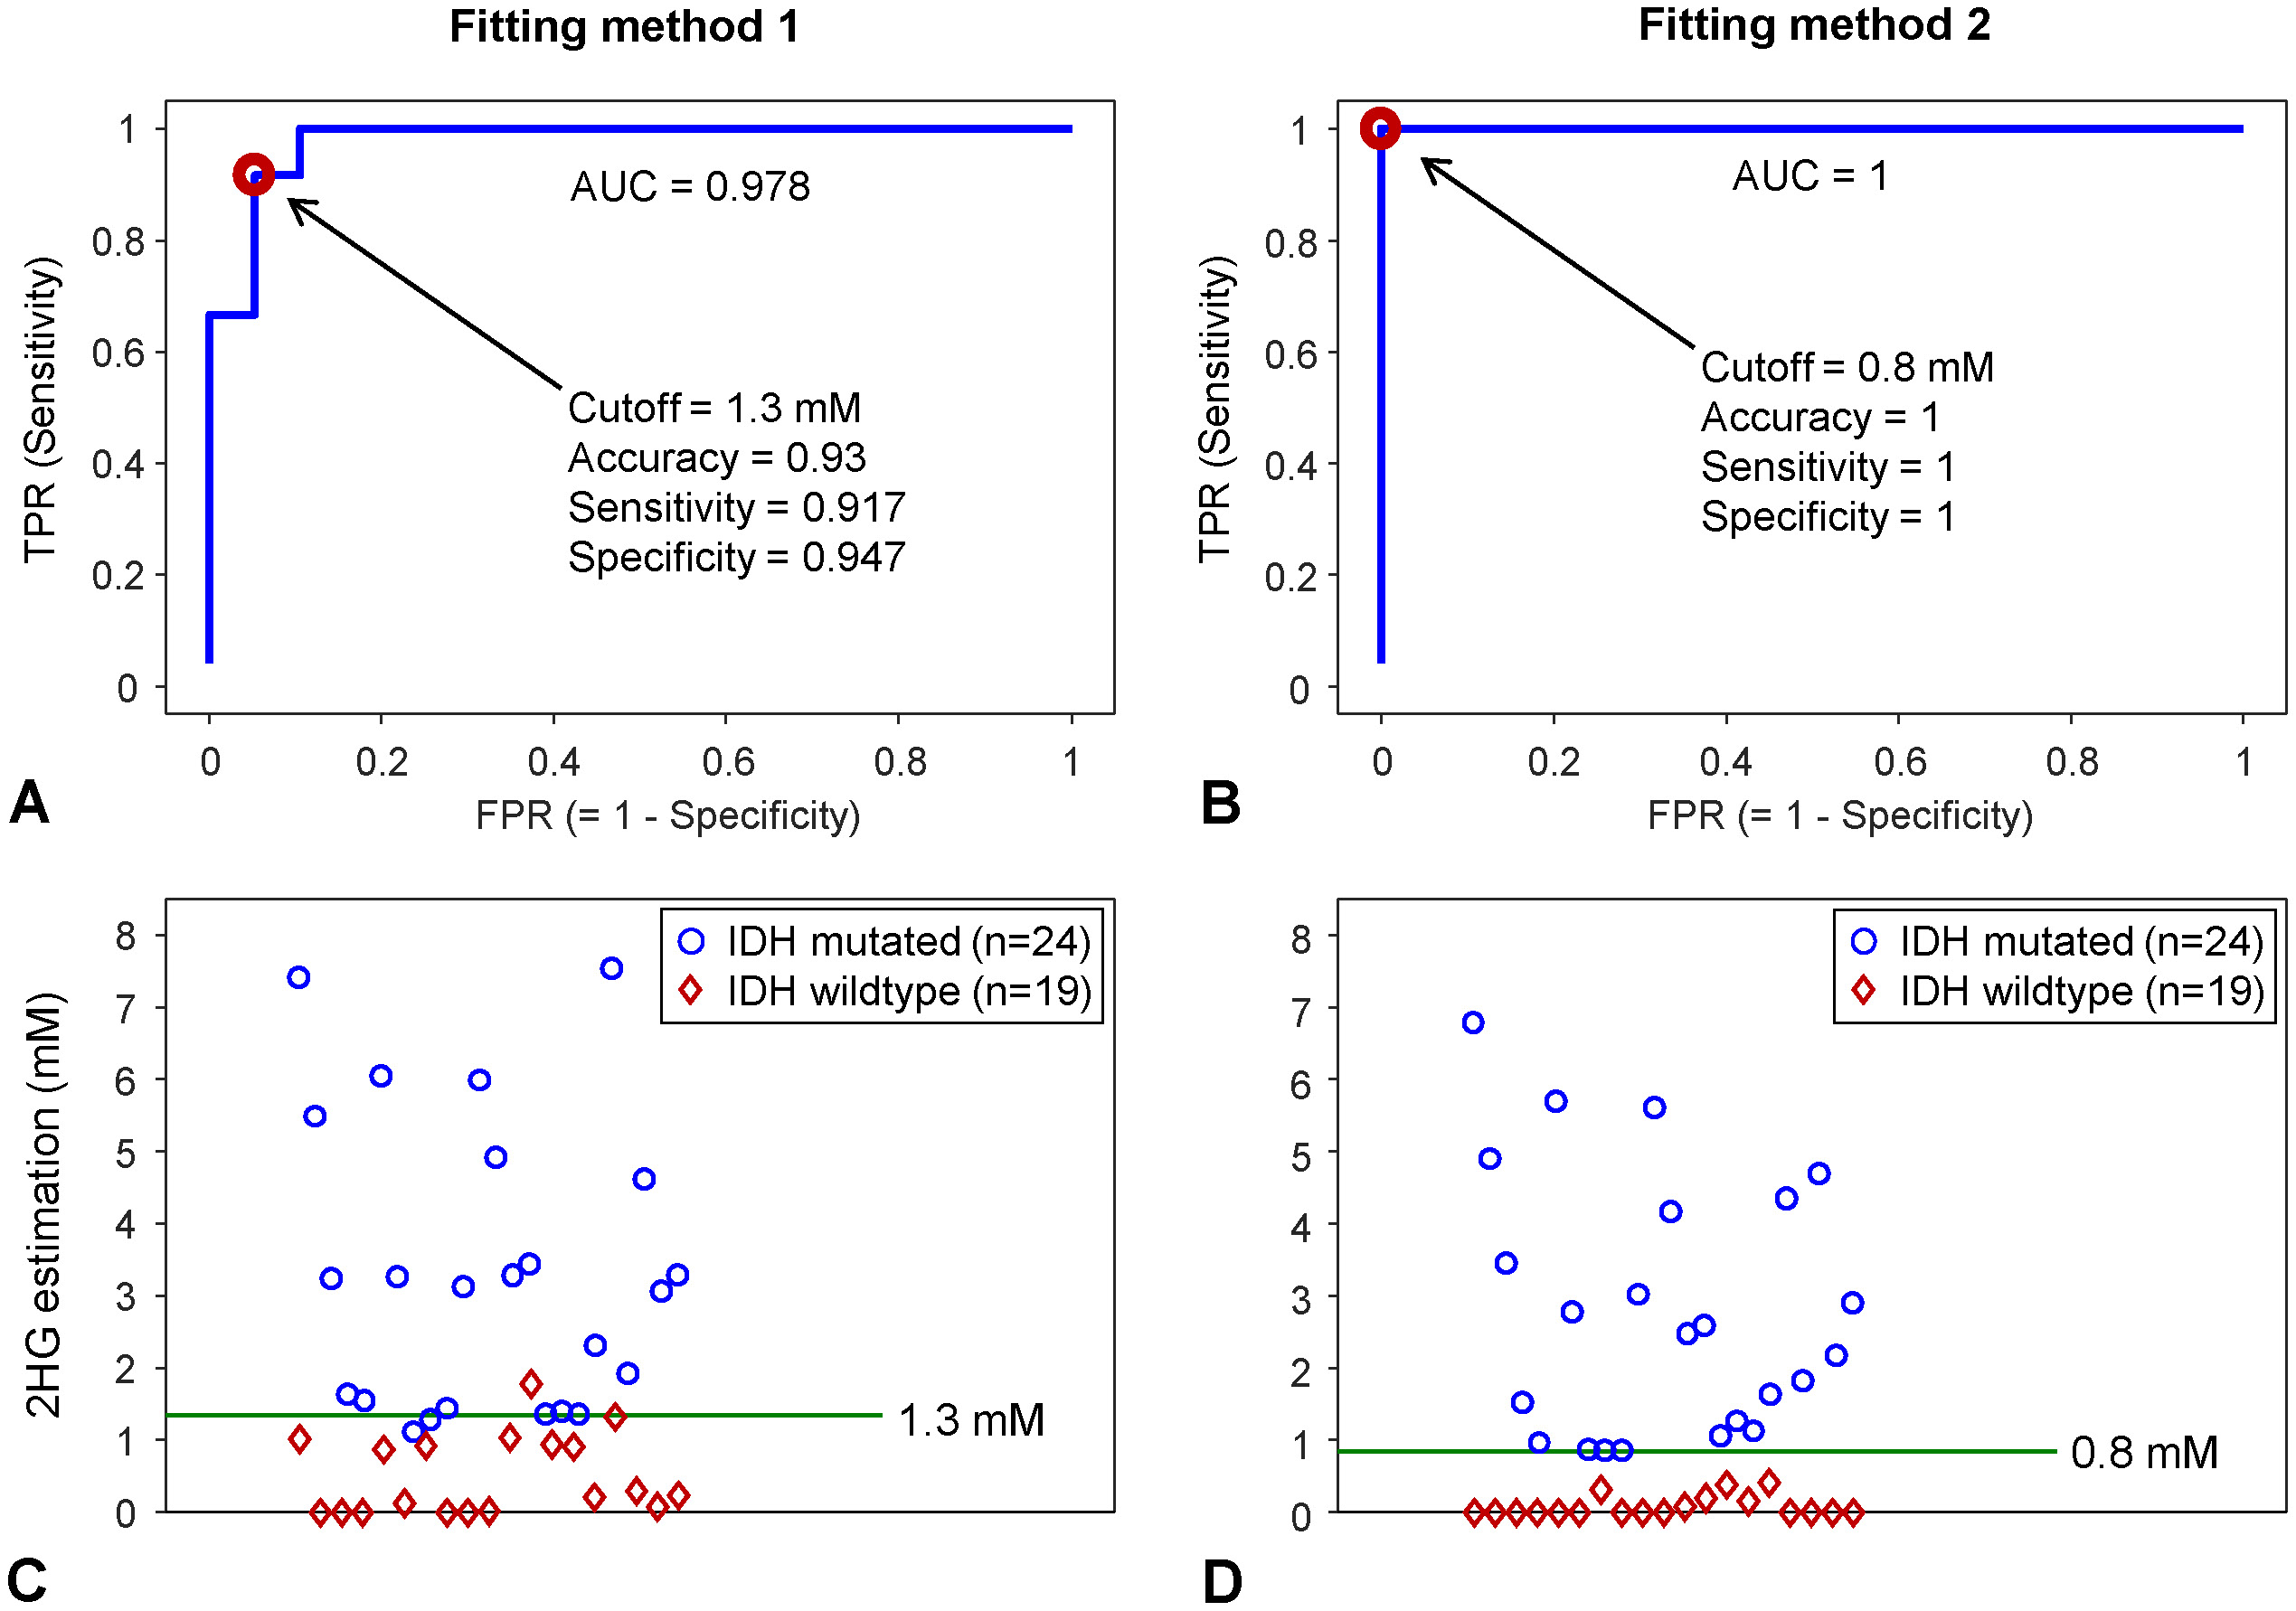
FIG 4. (A,B) ROC analyses of the 2HG
estimates from 43 patients are presented for Fitting methods 1 and 2. A red circle on an ROC curve
corresponds to the smallest distance to the upper-left corner of the curve, at
which a cutoff value was obtained as 1.3 and 0.8 mM for Fitting methods 1 and 2,
respectively. (C,D) 2HG
estimates from 24 IDH mutated and 19 IDH wildtype tumor patients are shown for
Fitting methods 1 and 2. Green lines indicate the cutoff values from the ROC
curves. For Fitting method 2, the 2HG estimates in IDH mutated tumors were 0.8
- 6.8 mM and those in IDH wildtype tumors were 0 - 0.4 mM.
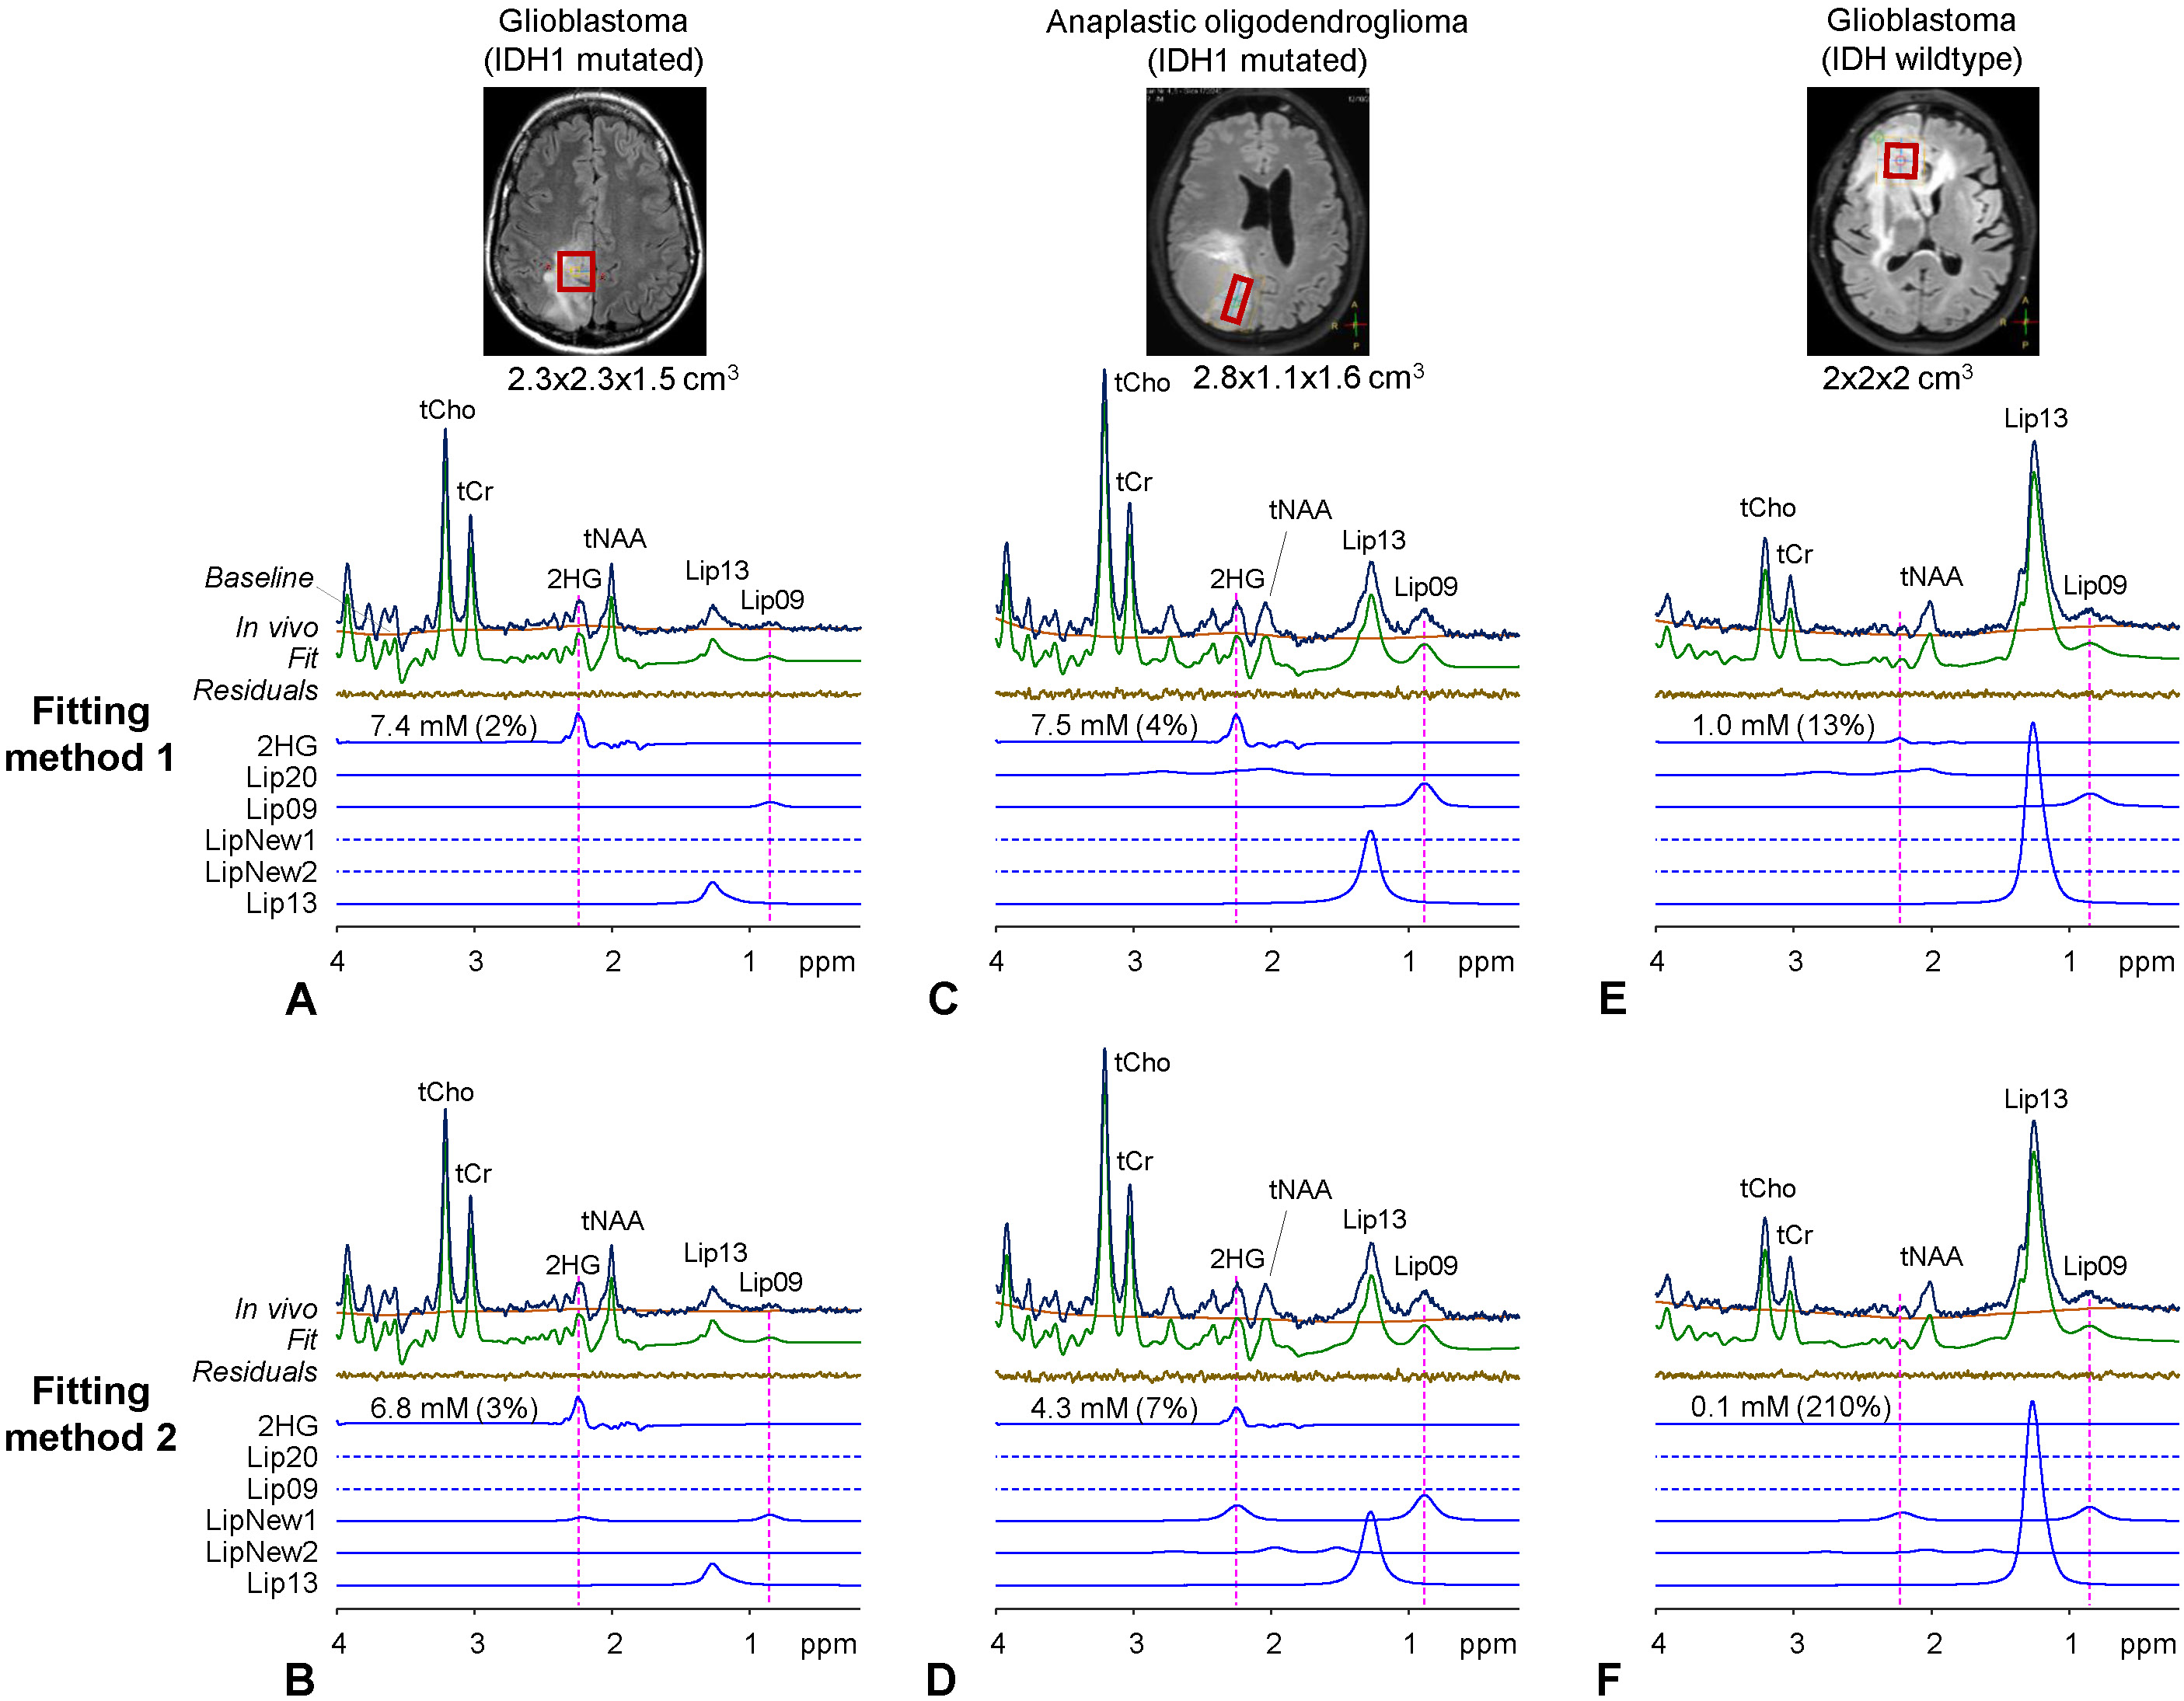
FIG 1. Representative in vivo PRESS TE 97 ms spectra from three glioma patients are presented with LCModel
fitting outputs and voxel positioning on T2-FLAIR images. LCModel-returned 2HG
signals are shown with 2HG estimates and CRLB in brackets. The LCModel
built-in lipid basis set (Fitting method-1) included Lip09, Lip20, and Lip13. New
lipid basis set (Fitting method-2) included LipNew1, LipNew2, and Lip13. Dotted
lines denote exclusion of the lipid signals in the basis set. Spectra are
scaled with respect to the water signal from the voxel. Vertical lines are
drawn at 2.25 and 0.9 ppm.