Tao Gong1, Liangjie Lin2, and Yihang Yang3
1Shandong Medical Imaging Research Institute, Jinan, China, 2Philips Healthcare, Beijing, China, 3Shandong provincal hospital, Jinan, China
1Shandong Medical Imaging Research Institute, Jinan, China, 2Philips Healthcare, Beijing, China, 3Shandong provincal hospital, Jinan, China
IDH 1 wild-type gliomas have higher
MK and lower MD values in tumor foci compared with IHD 1 mutant gliomas. Lower FA in perilesional white matter was seen in wild-type gliomas, while no difference was found in mutant patients, suggesting greater infiltrative nature in IDH 1 wild-type gliomas.
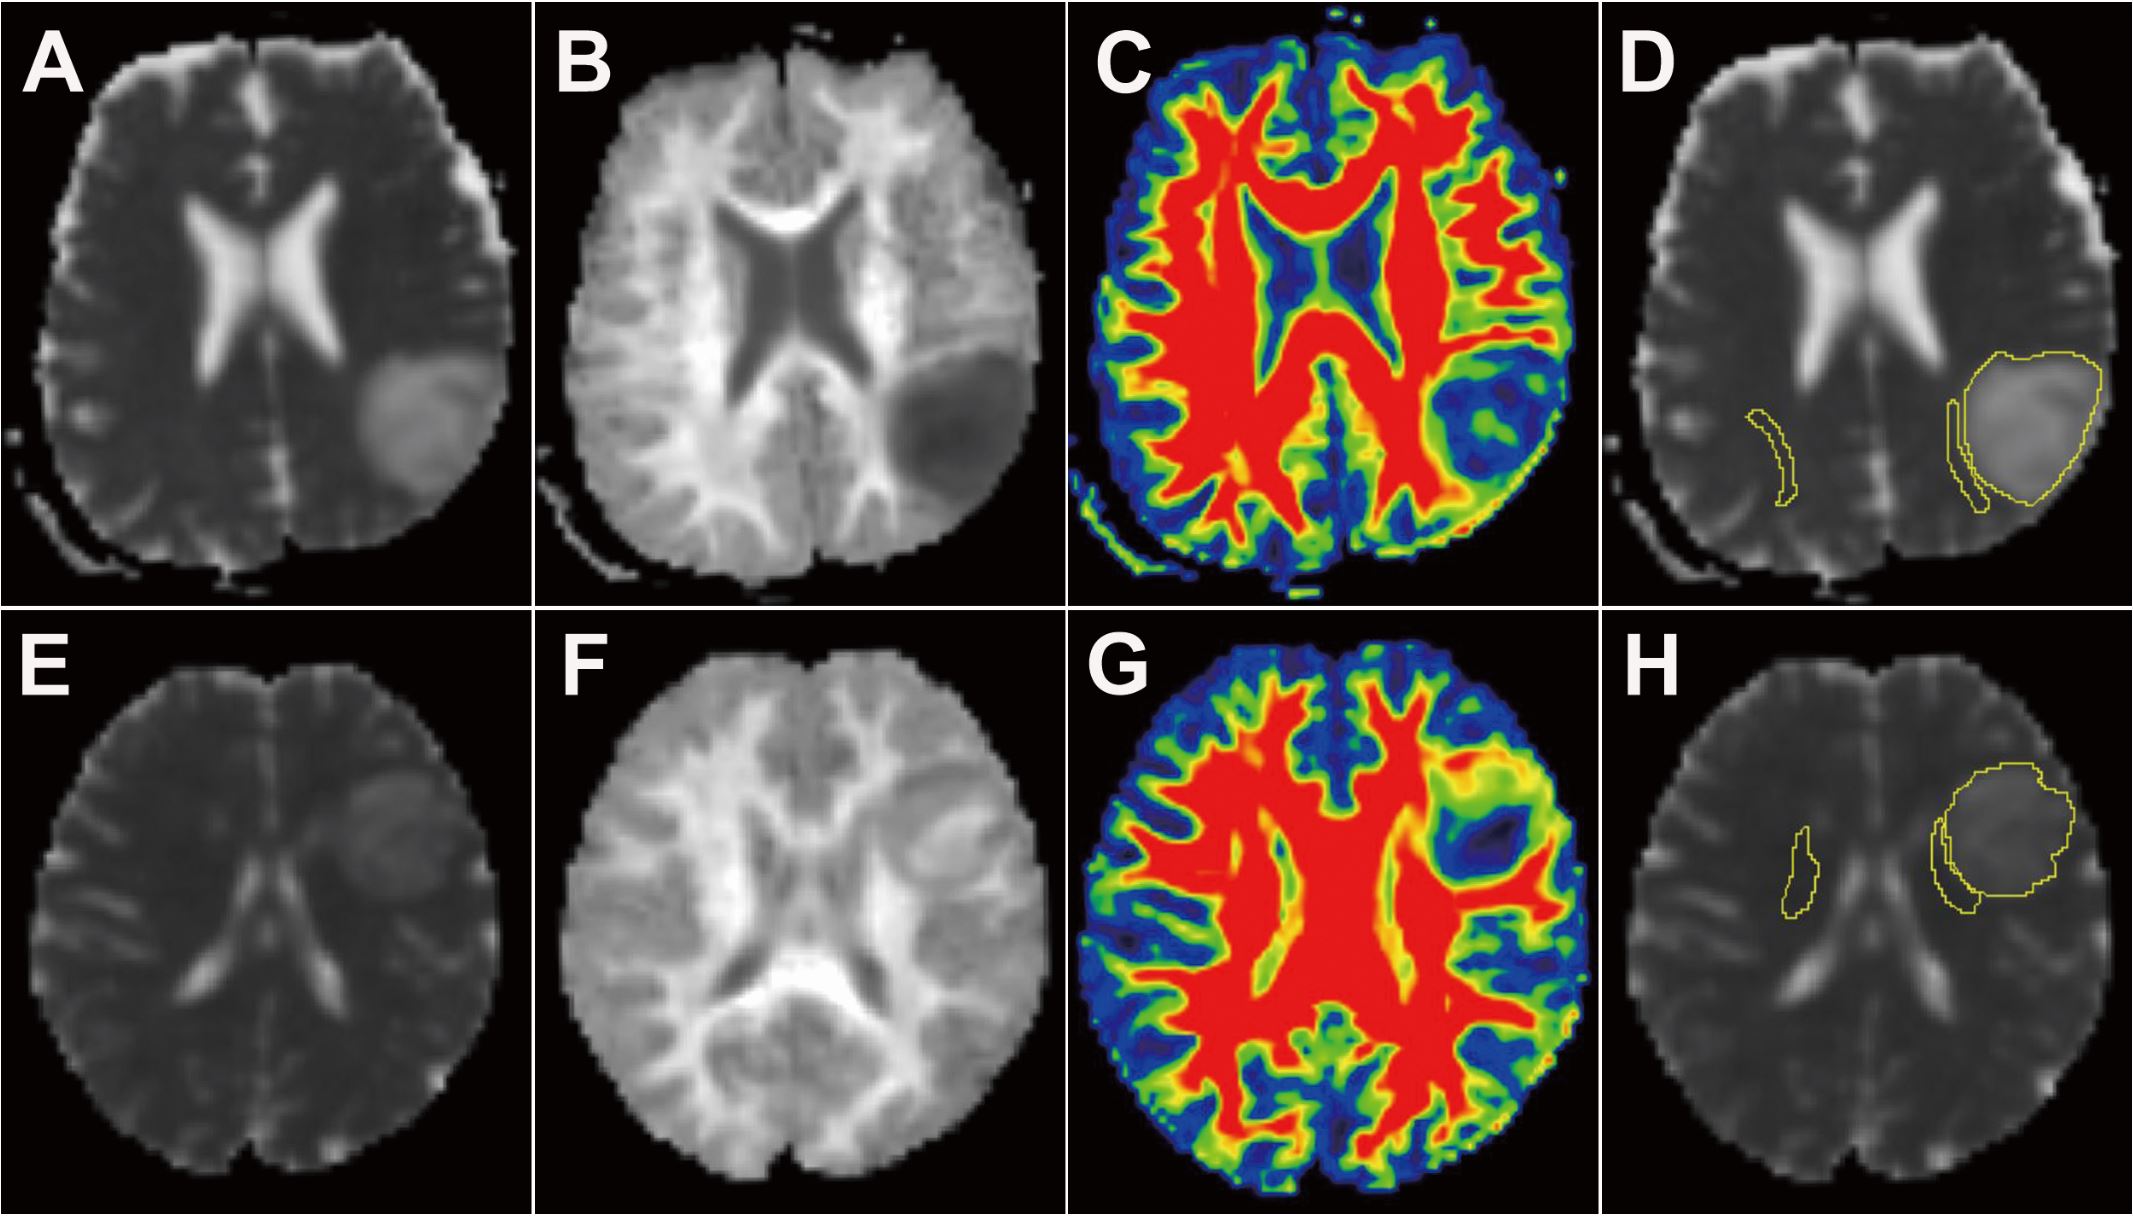
Figure
1.
MD
(A), MK (B) and FA color (C) maps in a 35-year-old man with IDH 1-mutated
glioma (WHO II); and MD (E),
MK (F) and FA color (G) maps in a 36-year-old woman with IDH 1 wild-type glioma
(WHO II); ROIs of glioma foci, pWM and cNAWM were drawn on non-smoothed MD maps
(D and H). MD = mean
diffusion; MK = mean kurtosis; FA = fractional anisotropy; pWM = perilesional
white matter; cNAWM = contralateral normal appearing white matter;
ROI
= region of interest.
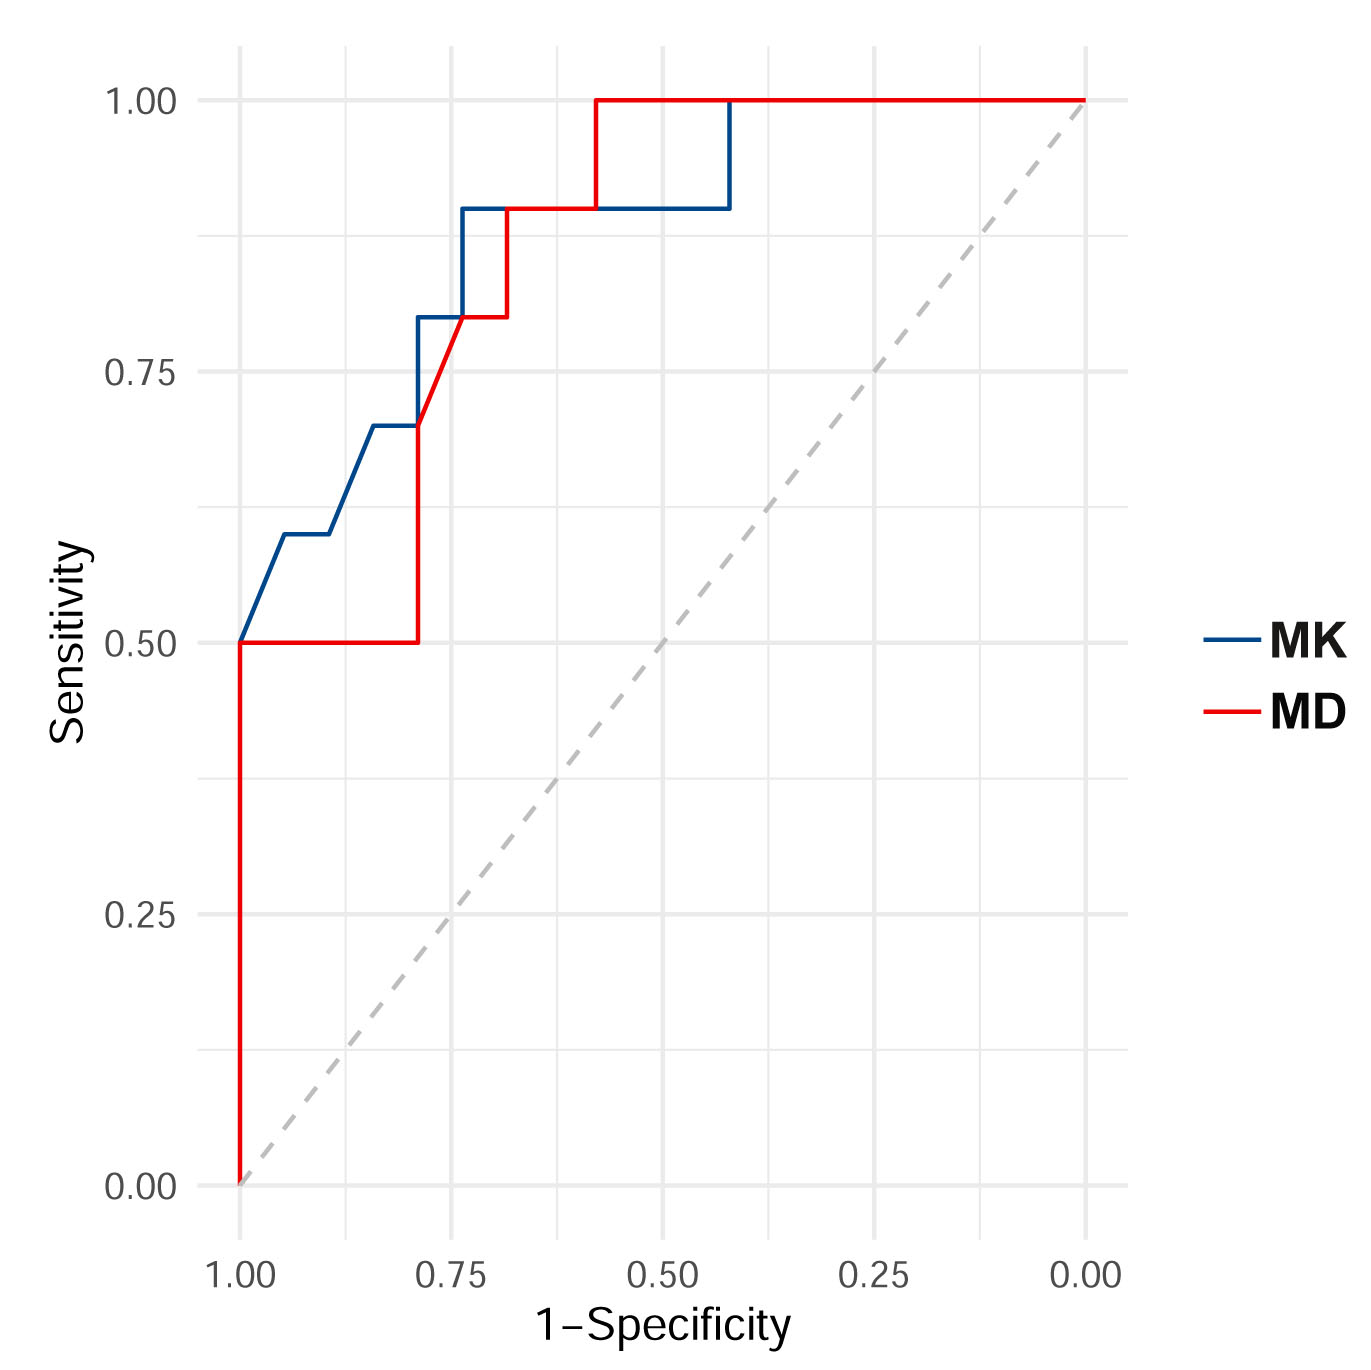
Figure
3.
ROC curves of MK and MD values calculated from the glioma foci for
differentiating IDH 1 mutant and wild-type low-grade gliomas. The AUC of MK was
0.88 (95% CI, 0.74~1.00), MD was 0.86 (95%CI, 0.73~0.99). MK = mean kurtosis;
MD = mean diffusion.