1Neuroradiology, Pitié-Salpêtrière Hospital, APHP, Sorbonne universite, Paris, France, 2UMR S 1127, CNRS UMR 722, ICM, Sorbonne Universités, Paris, France, 3CENIR, ICM, Sorbonne Universités, Paris, France, 4CENIR, ICM, Paris, France, 5Nuclear Medecine, Pitié-Salpêtrière Hospital, APHP, Sorbonne universite, Paris, France
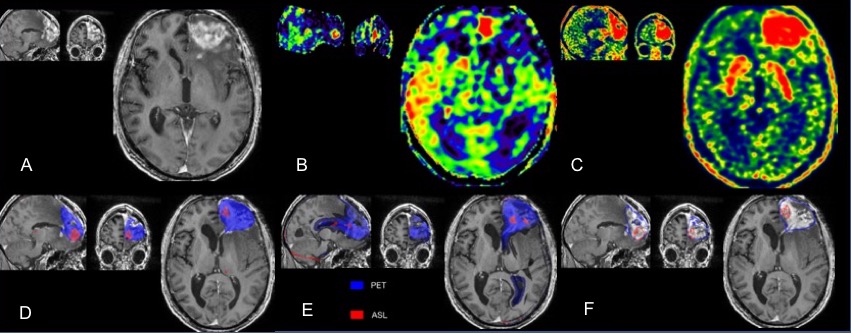
PET-MR of a patient with left WHO IV glioblastoma treated by surgery and adjuvant radio-chemotherapy.
Upper row: A: enhancement on the frontal lesion on a contrast-enhanced axial T1-w image; B: hyper-perfusion with increased CBF on ASL images corresponds to the area of contrast enhancement; C: 18F-DOPA PET map with increased SUV
Lower row: SPM maps were concordant with significant clusters, which confirmed progression. The red ASL clusters appear to be more peripheral than the blue extensive PET clusters. D: T-score map; E: Z-score of asymmetry index; F: isocontour map.
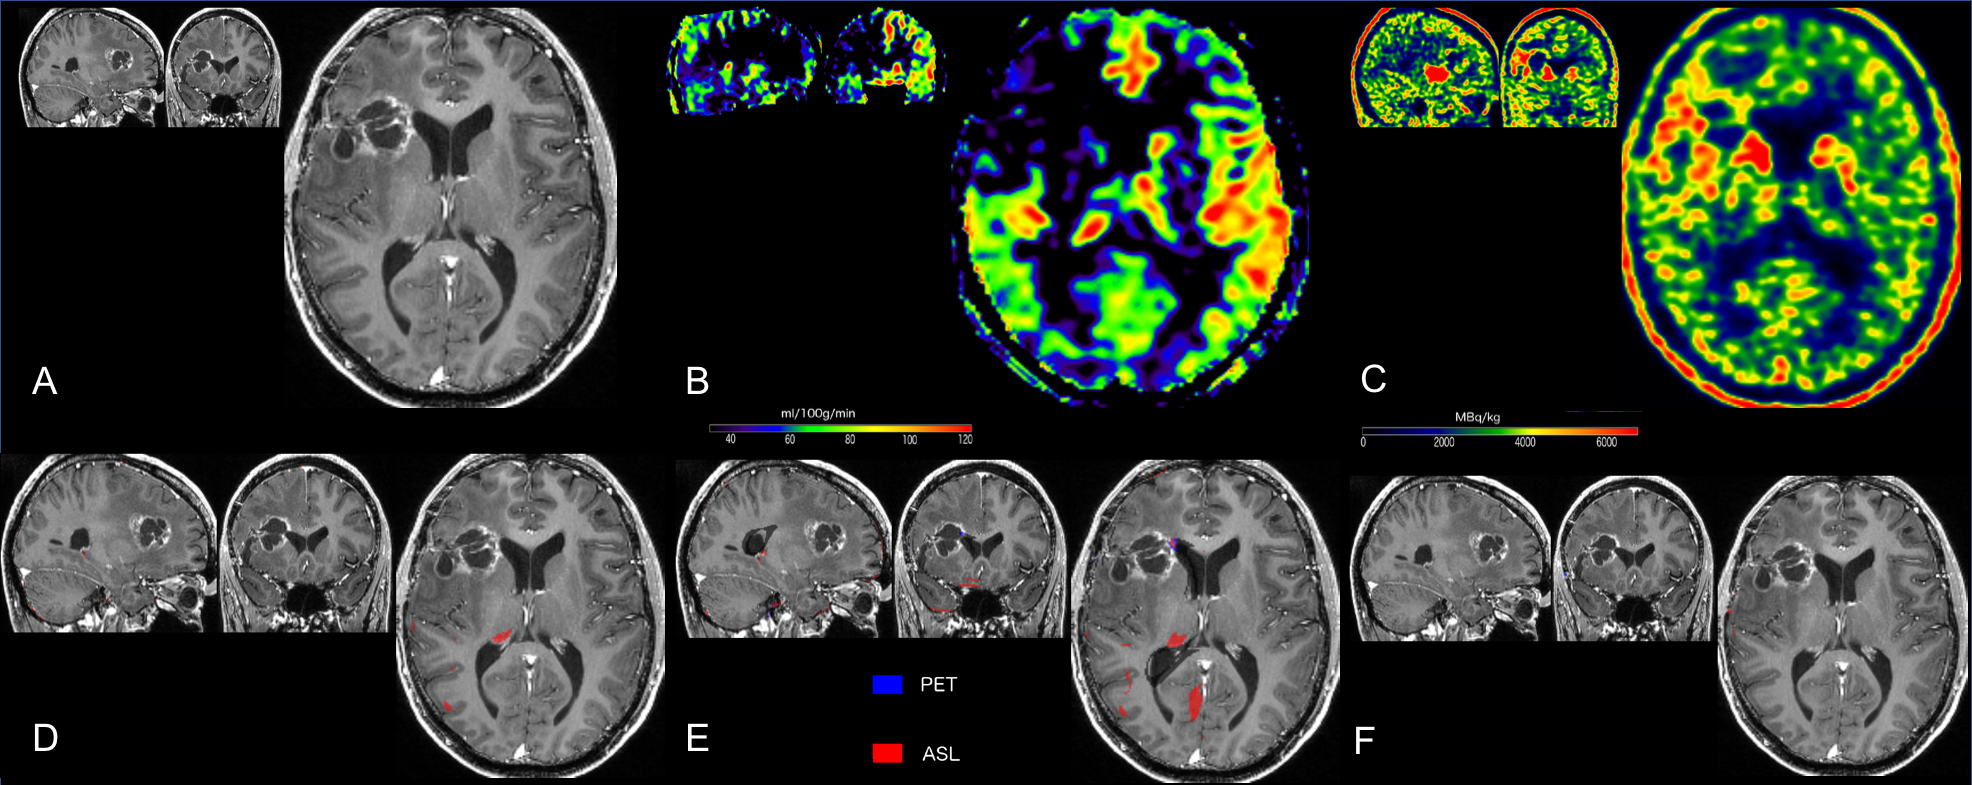
PET-MR of patient with right glioblastoma, treated by surgery and adjuvant radiotherapy
Upper row: A: linear cavitary enhancement observed on the initially-treated frontal lesion site on a contrast-enhanced axial T1-w image; B: the absence of hyper-perfusion as assessed by CBF on ASL images; C: 18F-DOPA PET map showing no significantly increased SUV
Lower row: SPM maps were concordant, with the absence of significant clusters, which confirmed pseudo-progression. D: T-score map; E: Z-score of asymmetry index; F: isocontour map.