Hikaru Fukutomi1, Xavier Barreau2, Lydia Hamitouche2, Takayuki Yamamoto1, Laurent Denat1, Bei Zhang3, Lijun Zhang4, Bruno Triaire5, Valentin Prevost5, Vincent Dousset1,2, and Thomas Tourdias1,2
1Institut de Bio-imagerie IBIO, Université de Bordeaux, Bordeaux, France, 2CHU de Bordeaux, Neuroimagerie diagnostique et thérapeutique, Bordeaux, France, 3Canon Medical Systems Europe, Zoetermeer, Netherlands, 4Canon Medical Systems China, Beijing, China, 5Canon Medical Systems Corporation, Tochigi, Japan
1Institut de Bio-imagerie IBIO, Université de Bordeaux, Bordeaux, France, 2CHU de Bordeaux, Neuroimagerie diagnostique et thérapeutique, Bordeaux, France, 3Canon Medical Systems Europe, Zoetermeer, Netherlands, 4Canon Medical Systems China, Beijing, China, 5Canon Medical Systems Corporation, Tochigi, Japan
For inner ear exploration, combining specific T2 preparation and inversion time on non-injected 3D-FLAIR provided a high contrast between peri- and endo-lymphatic spaces and even allows delineating the saccule from the utricle.
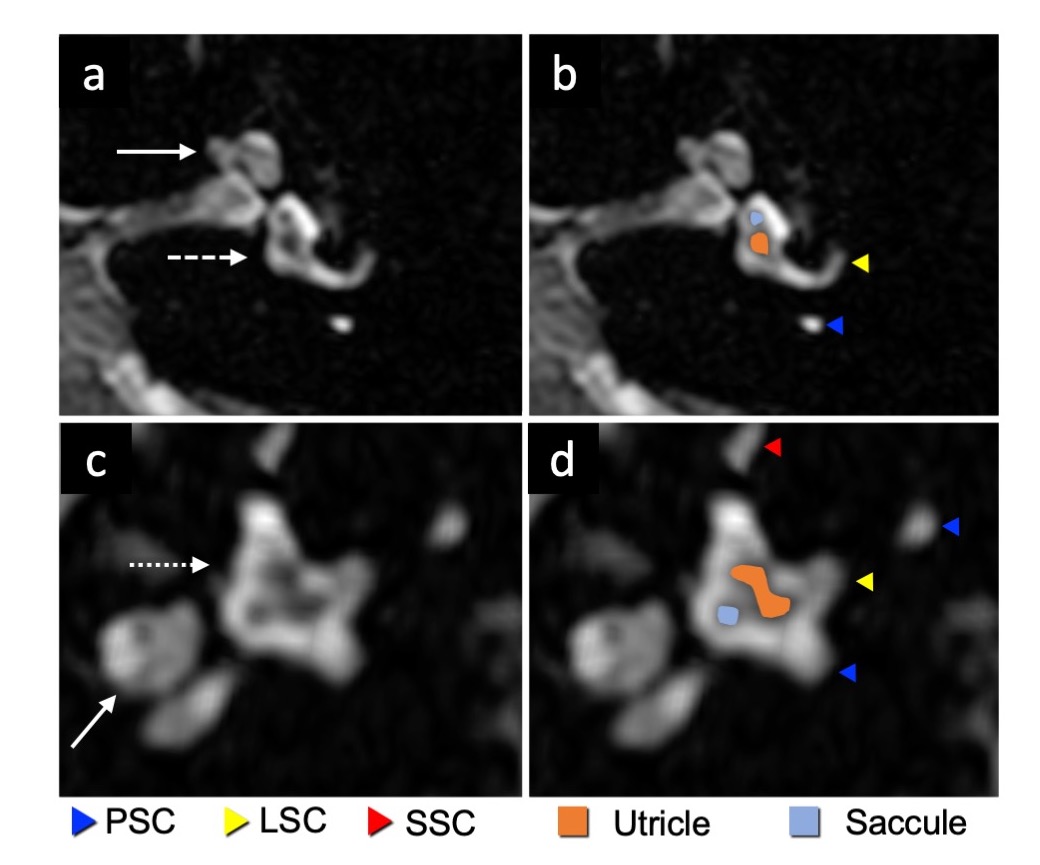
Figure 4. Non-contrast FLAIR images with T2Prep 400ms and TI 2100ms of a representative healthy subject. a, b Axial slice through the inferior part of the vestibule. c, d Sagittal reference slice. The saccule and utricle are separately visualized. Delineation of two structures is very similar to what is observed with contrast-enhanced FLAIR images in the literature (Attyé et al3). PSC posterior semicircular canal, LSC lateral semicircular canal, SSC superior semicircular canal, white arrow cochlea, dotted white arrow vestibule.
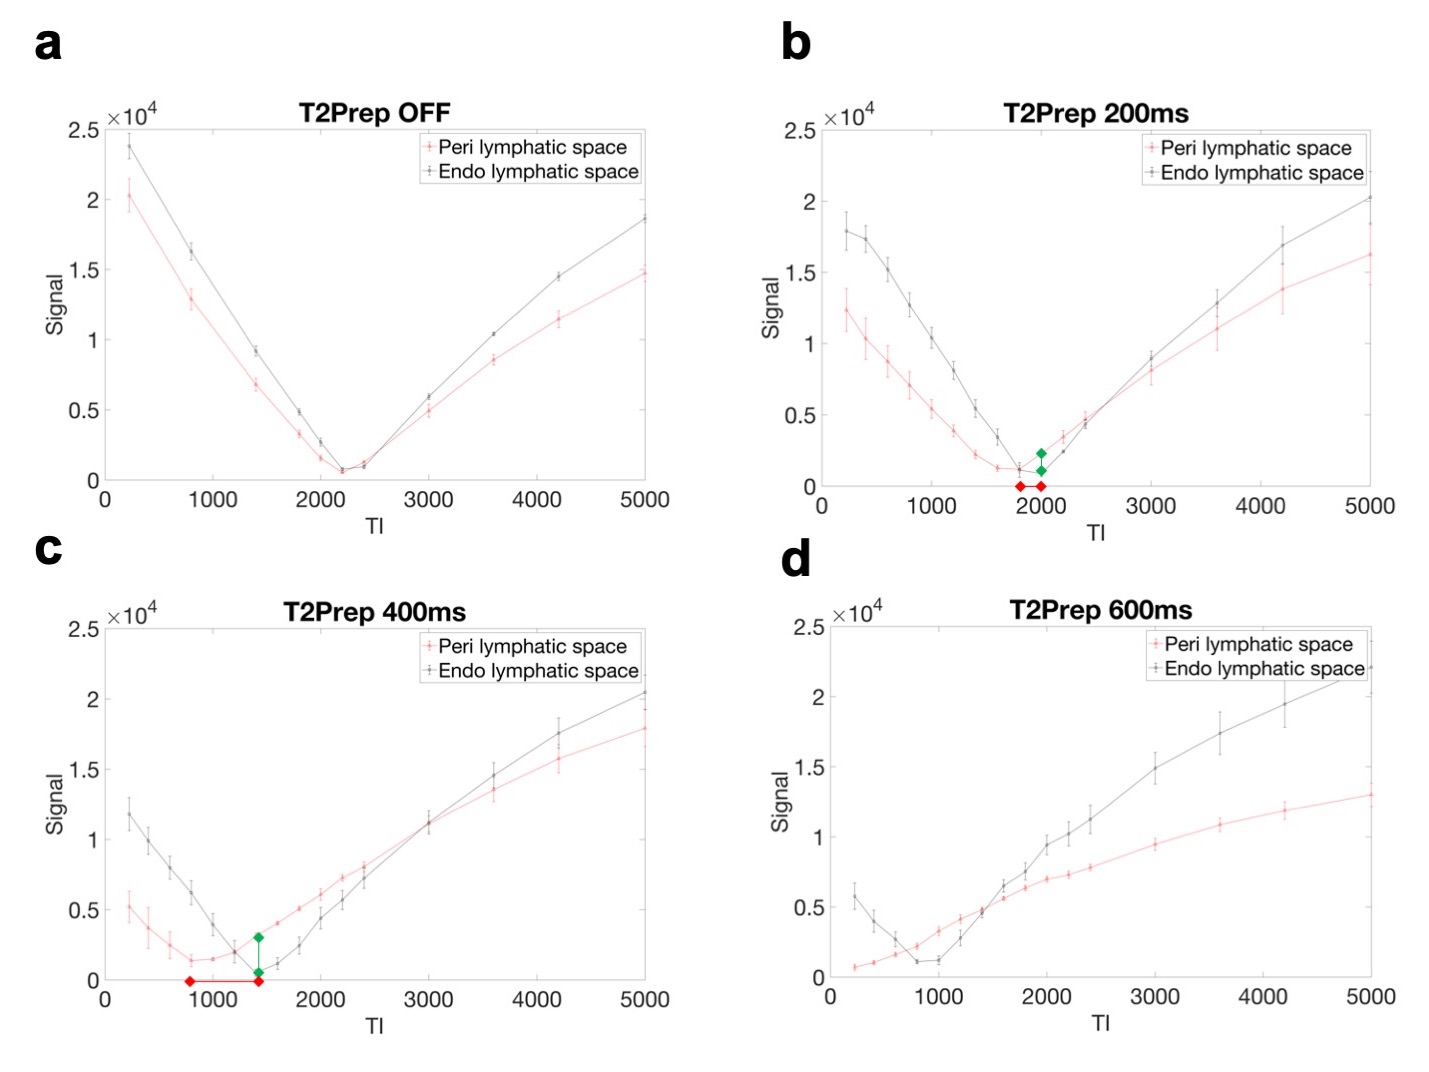
Figure 3. Peri- and endo-lymphatic space signal curves with variable TIs (224-5000ms) and T2Prep (0-600ms). Error bars indicate standard errors. a, b Red lines show the differences of the null points, which is larger when using 400ms T2Prep than 200ms. Green lines show the signal difference of peri- and endolymphatic spaces at endolymphatic space’s null point. The relative contrast of the two space was larger when using 400ms T2Prep than 200ms.