Zhen MA1, Xin ZHAO1, Kaiyu Wang2, and Jinxia Guo3
1The Third Affiliated Hospital of Zhengzhou University, Zhengzhou City, China, 2GE Healthcare, MR Research China,, Beijing, China, 3GE Healthcare, MR Research China, Beijing, China
1The Third Affiliated Hospital of Zhengzhou University, Zhengzhou City, China, 2GE Healthcare, MR Research China,, Beijing, China, 3GE Healthcare, MR Research China, Beijing, China
Retrospective analysis of patients with brain MRI examination and confirmed by pathology, respectively in three groups of MR ADC axial images, using Mazda software to delineate the region of interest at each level of the tumor, and carry out gray-scale global histogram analysis, and statistical analysis of the three groups of histogram parameter characteristics.The nine parameters, mean, variance, kurtosis, skewness, perc. 01%, perc. 10%, perc. 50%, perc. 90% and perc. 99% were obtained by gray histogram analysis (P < 0.05).
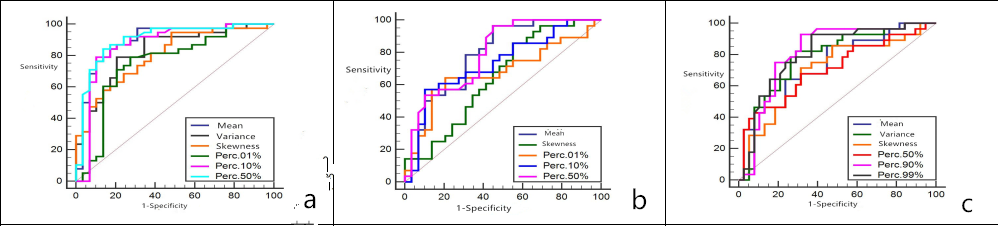
Fig. 3 A ROC curve was made based on the six most statistically significant parameters for differentiating glioblastoma and CNS lymphoma.
An ROC curve was made based on the six most statistically significant parameters for differentiating glioblastoma and metastatic tumors.
An ROC curve was made based on the six most statistically significant parameters for differentiating CNS lymphoma and metastatic tumors.
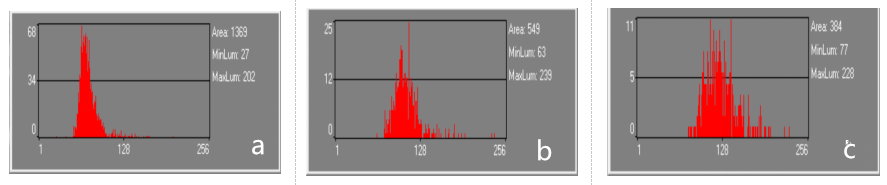
Fig 2.The gray histogram of CNS lymphoma、Glioblastoma and metastatic tumors. The abscissa represents different gray-scale values in ROI, and the ordinate represents the frequency of occurrence of gray-scale values.