Yuhui Qin1,2, Xiaoping Yu2, Jing Hou2, and Fabao Gao1
1Department of Radiology, West China Hospital, Chengdu, China, 2Department of Radiology, Affiliated Cancer Hospital of Xiangya School of Medicine, Changsha, China
1Department of Radiology, West China Hospital, Chengdu, China, 2Department of Radiology, Affiliated Cancer Hospital of Xiangya School of Medicine, Changsha, China
1) quantitative DCE-MRI parameters Ktrans, fpv and Ve may help to predict the long-term outcome after treatment for NPC. 2) The texture features of quantitative DCE-MRI parameters before treatment (Kep-perc.10% and Ve-perc.90%) may be predictors of the long-term efficacy of NPC.
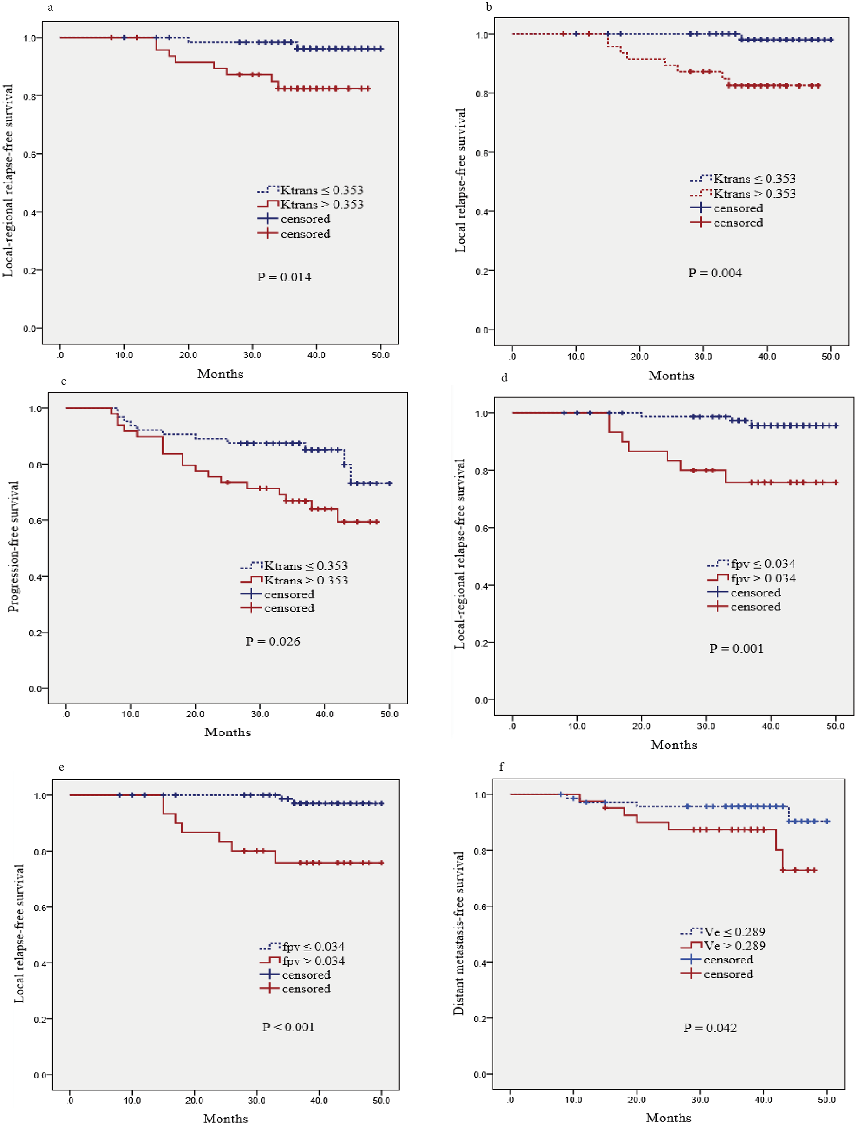
Figure 3. Kaplan-Meier curves of LRRFS (a), LRFS (b), PFS (c) for NPC patients stratified as the Ktrans-low and Ktrans-high groups; and LRRFS (d), LRFS (e) for NPC patients stratified as the fpv-low and fpv-high groups; and DMFS (e) for NPC patients stratified as the ve-low and ve-high groups. Ktrans-low/fpv-low/Ve-low group = patients with a primary lesion pretreatment Ktrans/fpv/Ve value ≤ 0.353/min, 0.034 and 0.289, respectively; Ktrans-high/fpv-high/Ve-high group = patients with a primary lesion pretreatment Ktrans/fpv/Ve value > 0.353/min, 0.034 and 0.289, respectively.
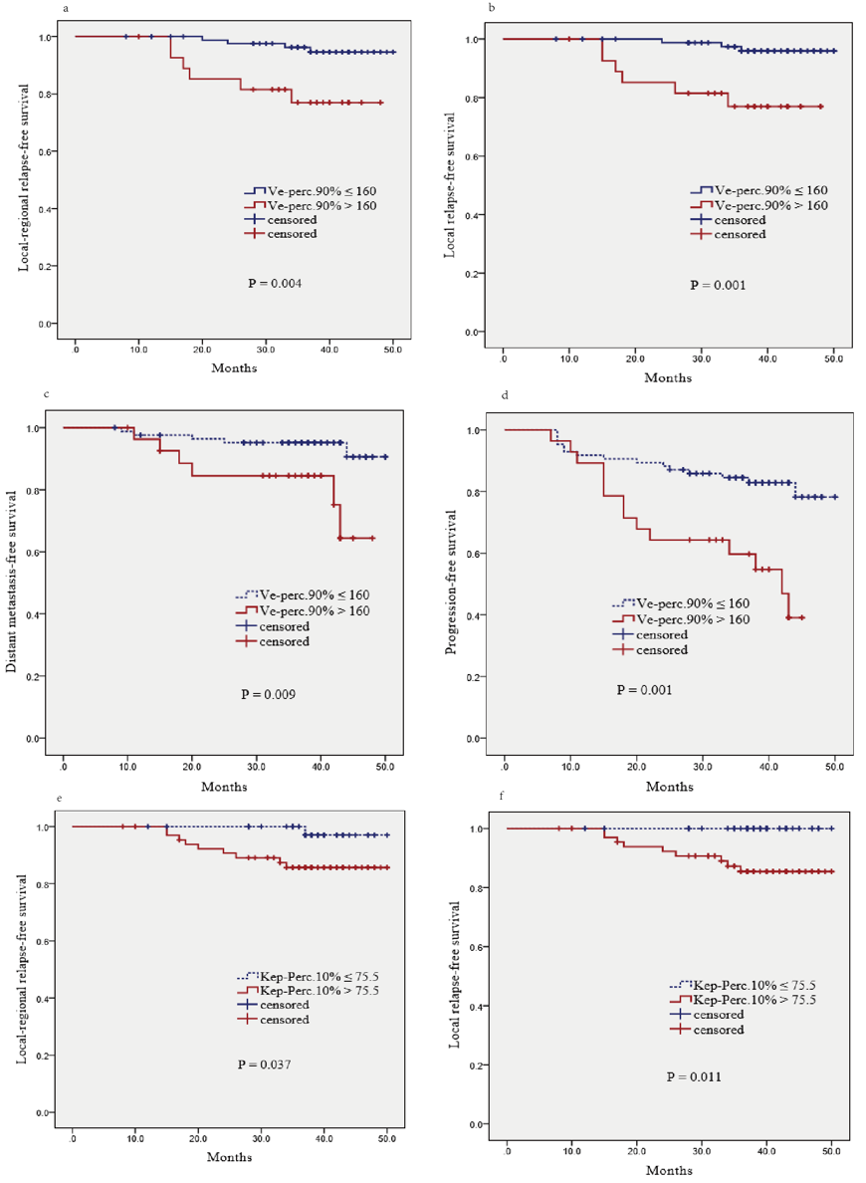
Figure 4. Kaplan-Meier curves of LRRFS (a), LRFS (b), PFS (c) and DMFS (d) for NPC patients stratified as the ve-perc.90%-low and ve-perc.90%-high groups; and LRRFS (e), LRFS (f) for NPC patients stratified as the Kep-perc.10%-low and Kep-perc.10%-high groups. ve-perc.90%-low/Kep-perc.10%-low group = patients with a primary lesion pretreatment ve-perc.90%/Kep-perc.10% value ≤ 160, 75.5, respectively; ve-perc.90%-high/Kep-perc.10%-high group = patients with a primary lesion pretreatment ve-perc.90%/Kep-perc.10% value > 160, 75.5, respectively.