Ronja C. Berg1, Christine Preibisch1, Claus Zimmer1, David L. Thomas2,3, Karin Shmueli4, and Emma Biondetti5
1School of Medicine, Department of Neuroradiology, Technical University of Munich, Munich, Germany, 2Dementia Research Centre, UCL Queen Square Institute of Neurology, University College London, London, United Kingdom, 3Wellcome Centre for Human Neuroimaging, UCL Queen Square Institute of Neurology, University College London, London, United Kingdom, 4Department of Medical Physics and Biomedical Engineering, University College London, London, United Kingdom, 5Institut du Cerveau – ICM, INSERM U 1127, CNRS UMR 7225, Sorbonne Université, Paris, France
1School of Medicine, Department of Neuroradiology, Technical University of Munich, Munich, Germany, 2Dementia Research Centre, UCL Queen Square Institute of Neurology, University College London, London, United Kingdom, 3Wellcome Centre for Human Neuroimaging, UCL Queen Square Institute of Neurology, University College London, London, United Kingdom, 4Department of Medical Physics and Biomedical Engineering, University College London, London, United Kingdom, 5Institut du Cerveau – ICM, INSERM U 1127, CNRS UMR 7225, Sorbonne Université, Paris, France
Flow
compensation is often recommended for venous QSM but its effects have not been
systematically evaluated. We found that acquiring QSM with or without flow
compensation has a smaller influence on venous susceptibility values than the choice
of QSM reconstruction method.
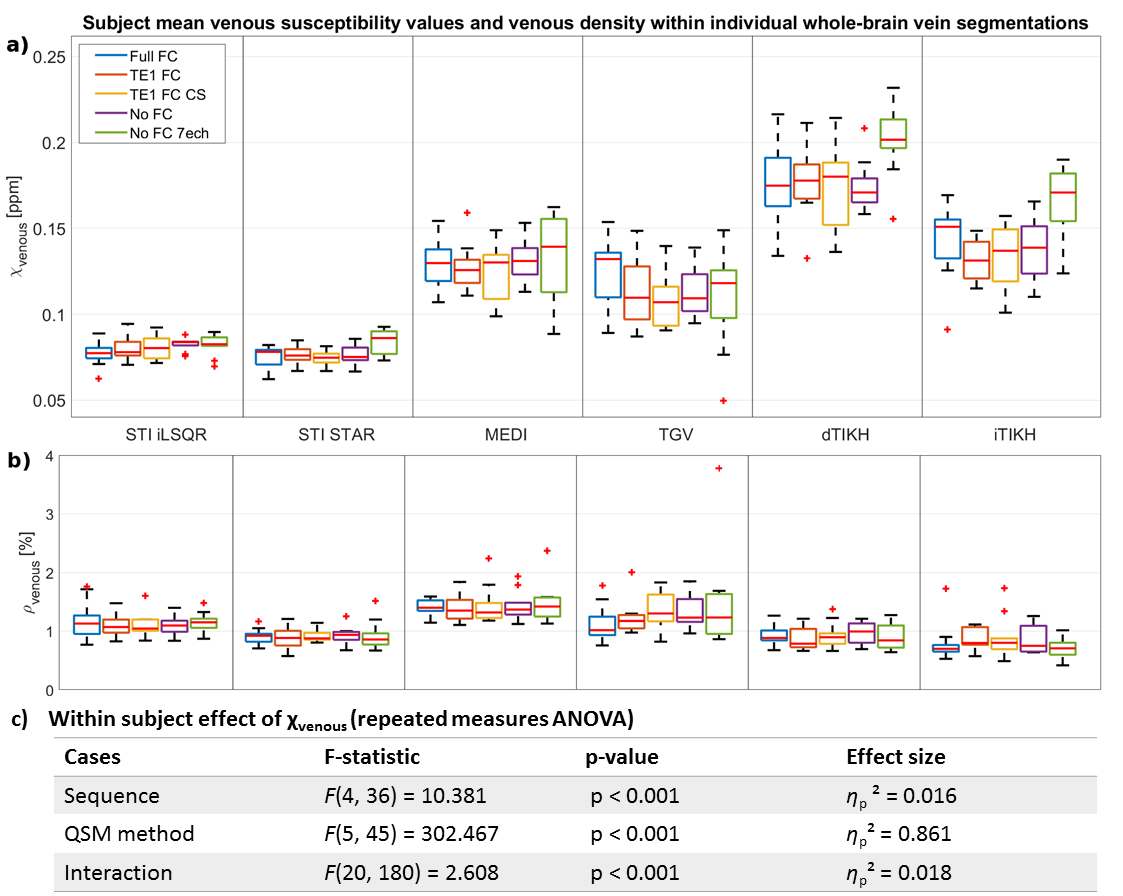
Figure 3: Boxplots of subject mean whole-brain a)
venous susceptibility and b) venous density from five different acquisition
sequences (different colors) and six QSM methods (columns) and c) statistical
analysis. Subject
mean values were calculated across all voxels obtained from multiscale vessel
filtering (MVF) on individual susceptibility maps within a common minimum-size brain
mask. Differences in subject mean venous susceptibility are greater for
different QSM reconstruction methods (effect size ηp2=0.861)
than for different acquisition settings (ηp2=0.016).
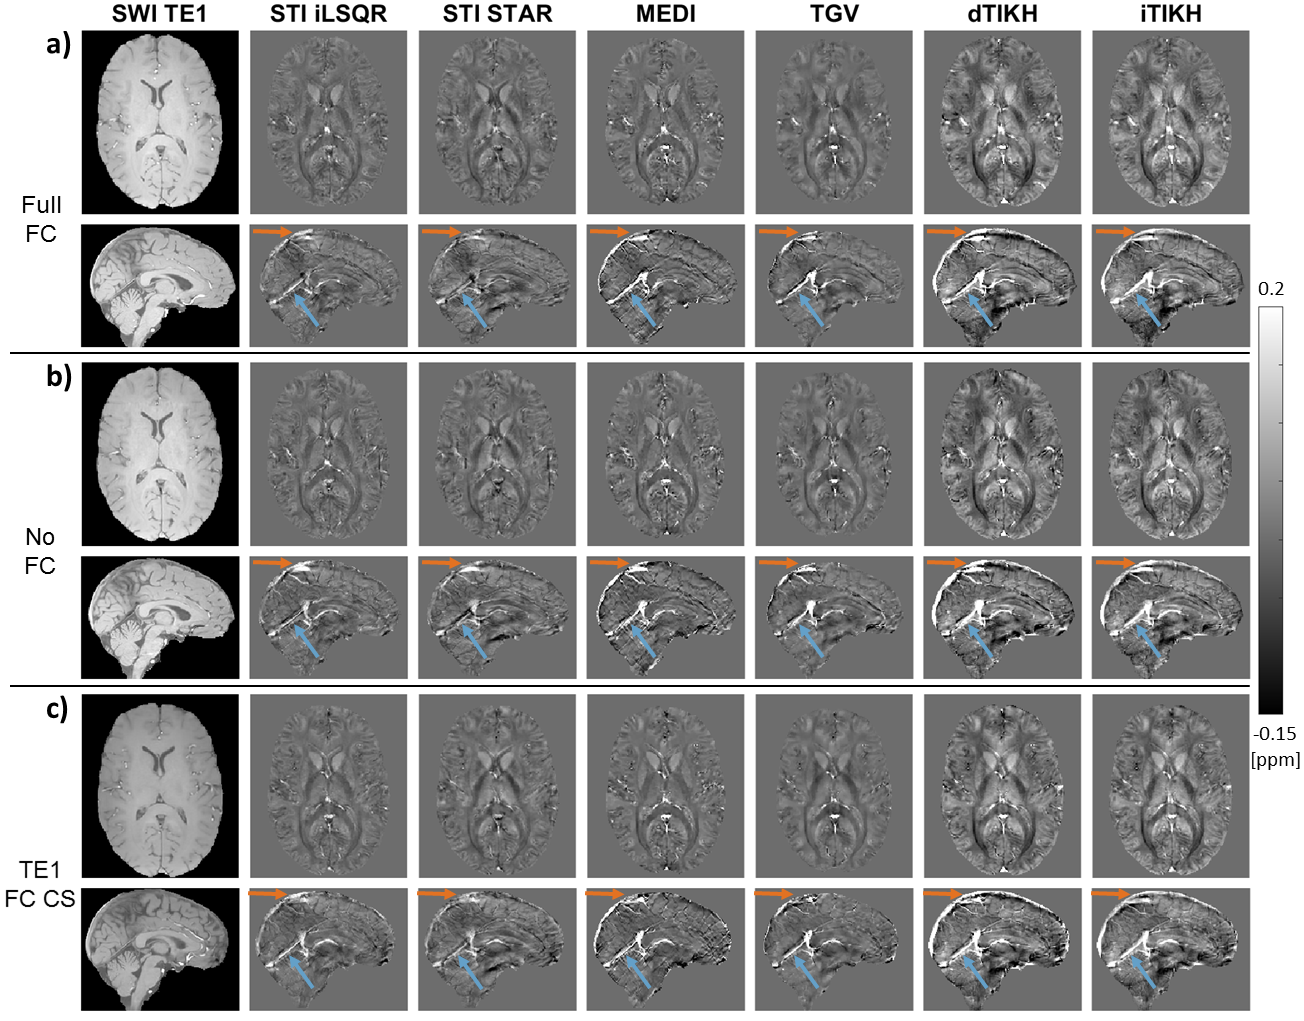
Figure 1: First-echo magnitude images and susceptibility
maps from different QSM reconstruction methods (columns) in a representative healthy subject.
The same axial and sagittal slices are shown for a) Full FC, b) No FC, and c) TE1
FC CS sequences (rows). Differences between the six QSM methods are clearly
visible in the extent of brain erosion (orange arrows), the delineation of the
straight sinus (blue arrows), and the contrast between various brain tissues. First-echo
magnitude data (first column) are shown in arbitrary units and scaled within
the same intensity range.