Marta Lancione1,2, Matteo Cencini2,3, Mauro Costagli3,4, Graziella Donatelli2,5, Michela Tosetti2,3, Claudio Pacchetti6, Pietro Cortelli7,8, and Mirco Cosottini5
1IMT School for Advanced Studies Lucca, Lucca, Italy, 2IMAGO7 Foundation, Pisa, Italy, 3IRCCS Stella Maris, Pisa, Italy, 4Department of Neuroscience, Rehabilitation, Ophtalmology, Genetics, Maternal and Child Sciences (DINOGMI), University of Genova, Genova, Italy, 5Azienda Ospedaliero-Universitaria Pisana, Pisa, Italy, 6Parkinson and Movement Disorder Unit, IRCCS Mondino Foundation, Pavia, Italy, 7Department of Biomedical and NeuroMotor Sciences, University of Bologna, Bologna, Italy, 8Clinica Neurologica, IRCCS Istituto delle Scienze Neurologiche di Bologna, Bologna, Italy
1IMT School for Advanced Studies Lucca, Lucca, Italy, 2IMAGO7 Foundation, Pisa, Italy, 3IRCCS Stella Maris, Pisa, Italy, 4Department of Neuroscience, Rehabilitation, Ophtalmology, Genetics, Maternal and Child Sciences (DINOGMI), University of Genova, Genova, Italy, 5Azienda Ospedaliero-Universitaria Pisana, Pisa, Italy, 6Parkinson and Movement Disorder Unit, IRCCS Mondino Foundation, Pavia, Italy, 7Department of Biomedical and NeuroMotor Sciences, University of Bologna, Bologna, Italy, 8Clinica Neurologica, IRCCS Istituto delle Scienze Neurologiche di Bologna, Bologna, Italy
QSM can
detect the increase of iron deposition in healthy controls and MSA patients of
both parkinsonian and cerebellar variants. Short TEs enhances its diagnostic
performances unveiling previously unreported alteration of deep gray matter
nuclei.
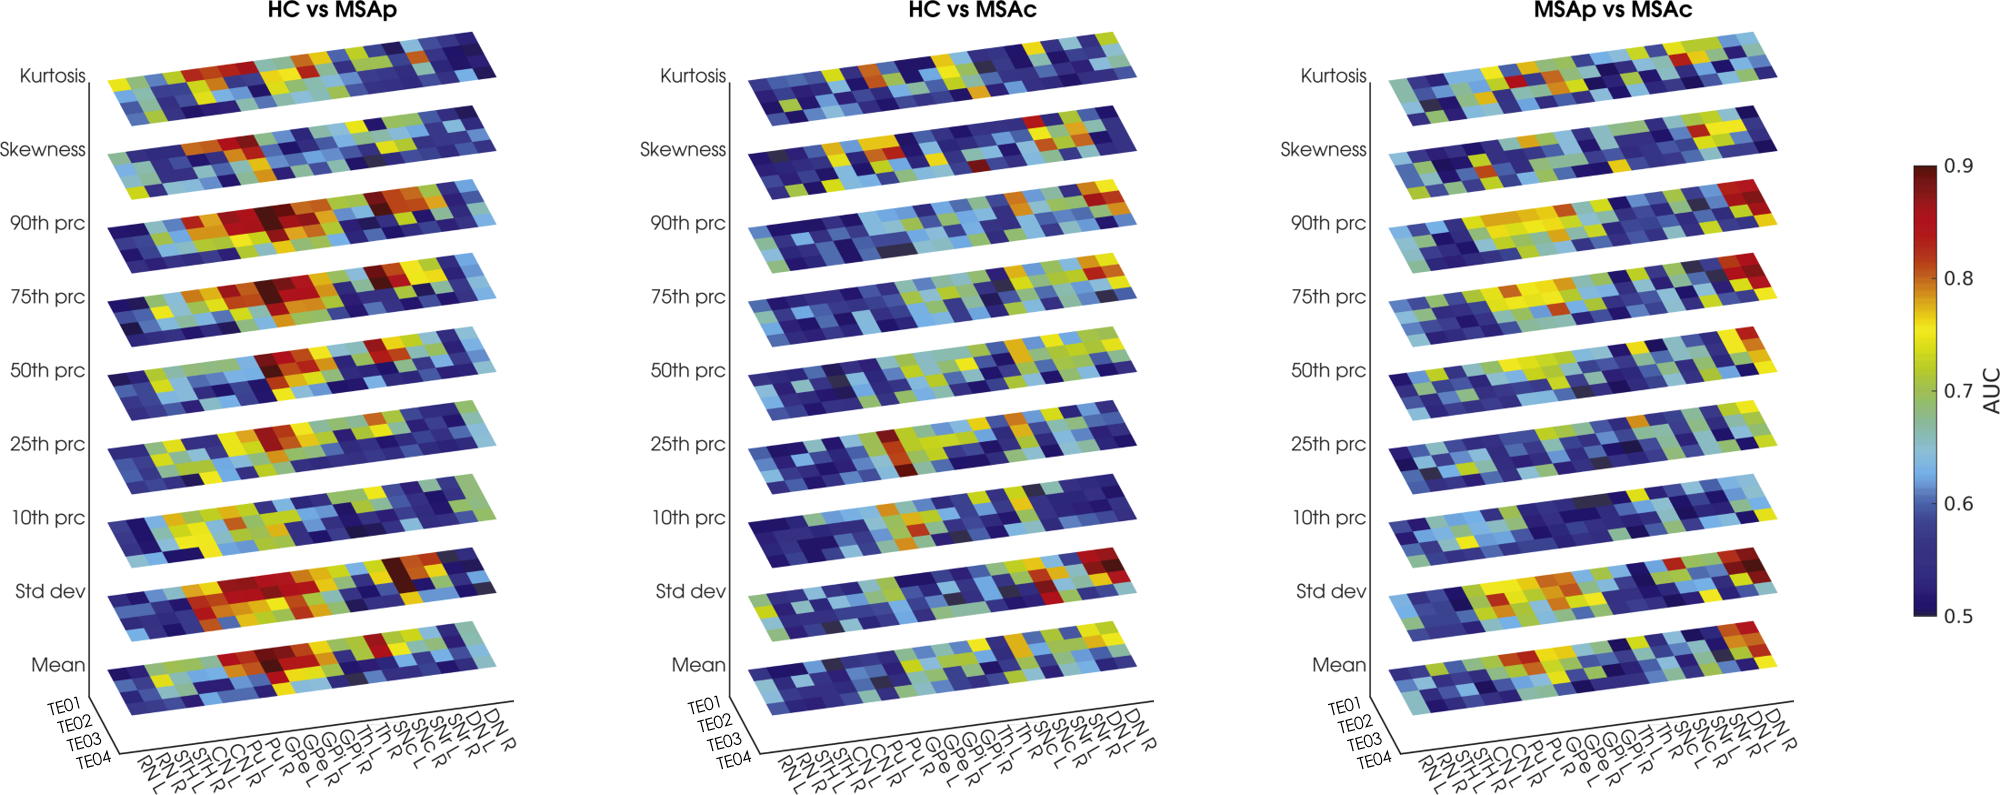
Figure 4: In
each plot the diagnostic accuracy for each group pair (HC vs MSA-p, HC vs MSA-c
and MSAp vs MSAc) is reported. The colors represent the values of the area
under the ROC curve (AUC) for each TE, for each ROI and for each histogram
feature. It can be noticed that AUC values are higher for short TEs.
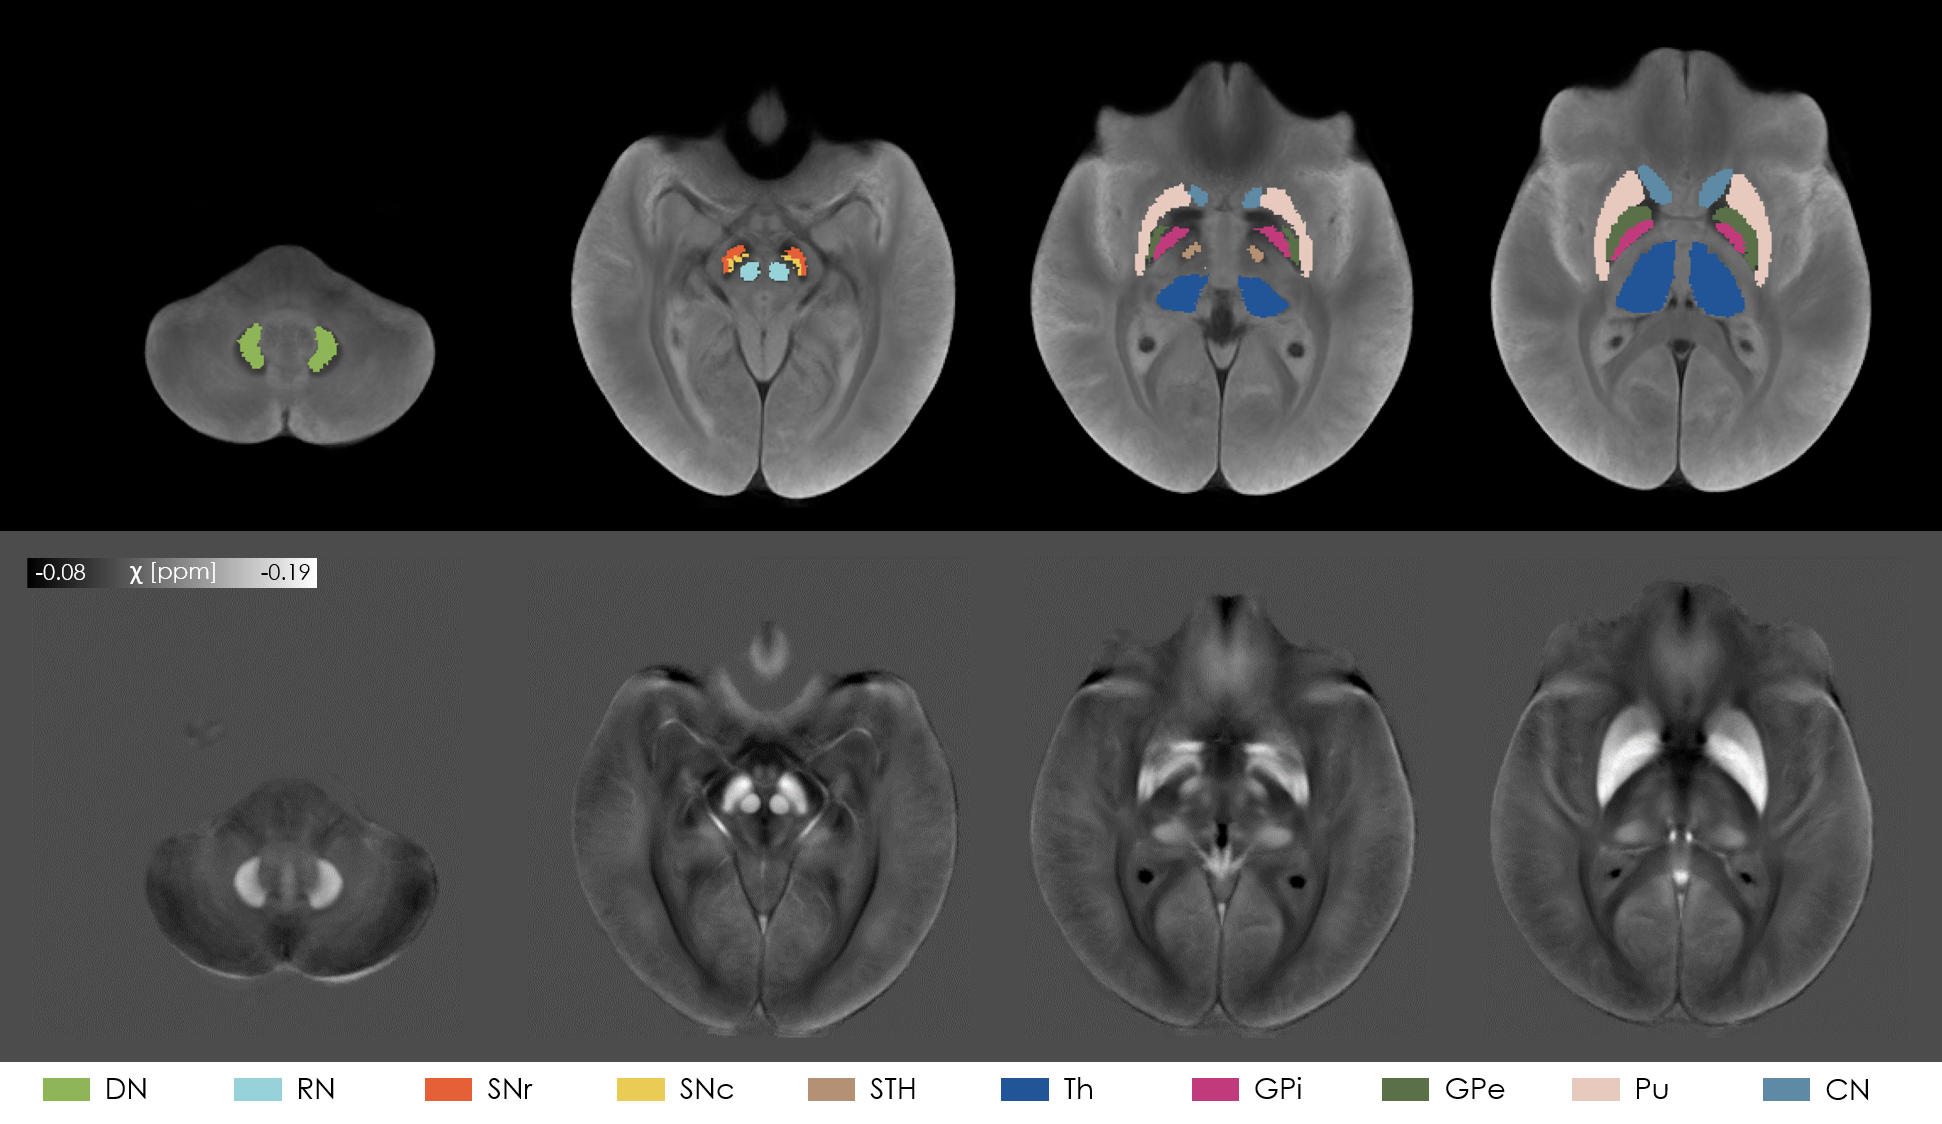
Figure 1:
The top row shows the ROIs used in the analysis overlaid onto the
study-specific template, which was computed from the across-TEs average of the
T2*-weighted image of each subject. In the bottom row the susceptibility maps computed
from the first TE averaged over all the subjects is displayed.