Yongsheng Chen1, Daniel Moiseev1, Wan Yee Kong1, Alexandar Bezanovski1, and Jun Li1,2
1Department of Neurology, Wayne State University School of Medicine, Detroit, MI, United States, 2John D. Dingell VA Medical Center, Detroit, MI, United States
1Department of Neurology, Wayne State University School of Medicine, Detroit, MI, United States, 2John D. Dingell VA Medical Center, Detroit, MI, United States
The
results from the automatic segmentation well agreed with those from manual
method, which is supported by an overall dice coefficient of 0.96 ± 0.10 for
the thigh and 0.91 ± 0.12 for the calf muscles. The overall difference of fat
fraction values between the two methods were less than 1.0%.
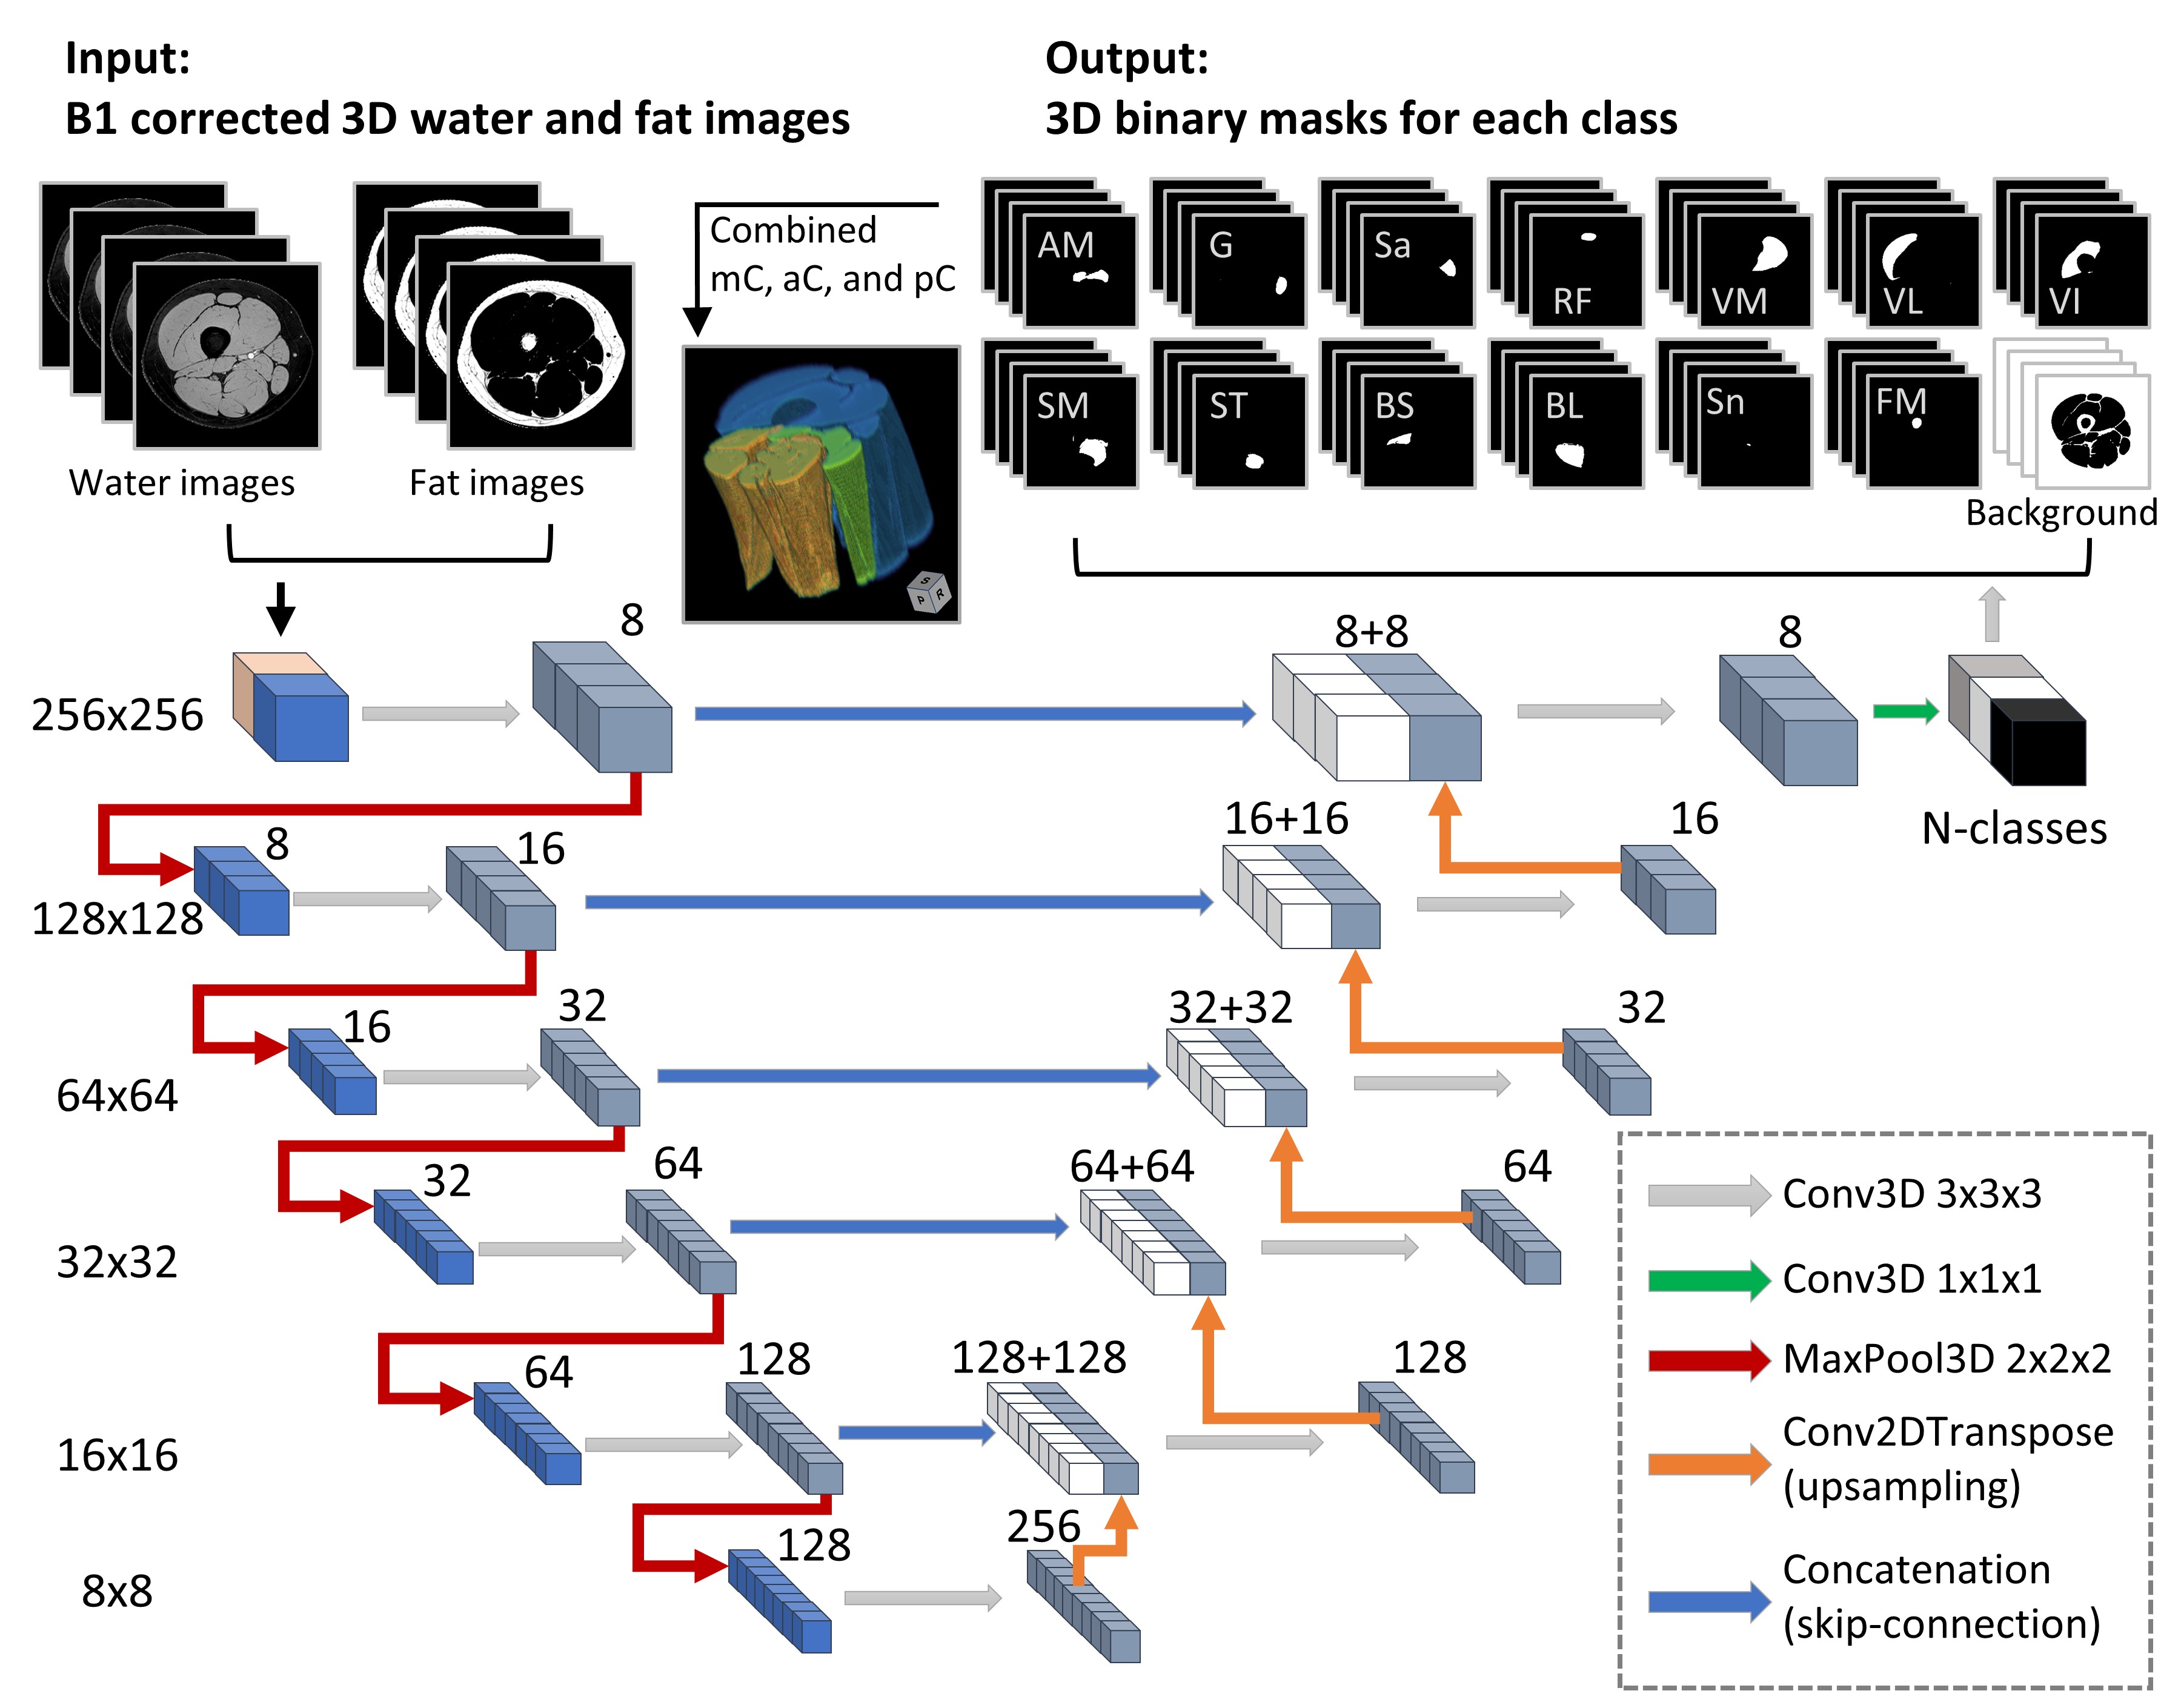
Figure 1.
Flowchart of the 3D U-Net model. Numbers on the left side denote the resolution
of the tensors, while the numbers on top of the cubes signify the number of
features. The left side of the diagram denoted the model’s contracting path.
The input-images were the 3D stacks of B1 corrected water and fat images. There
were 14 output classes for the thigh images including 11 muscles, plus sciatic
nerve, femoral marrow, and background. For the calf images, there were 13
classes including 9 muscles, plus tibial nerve, tibial marrow, fibular marrow,
and the background image.
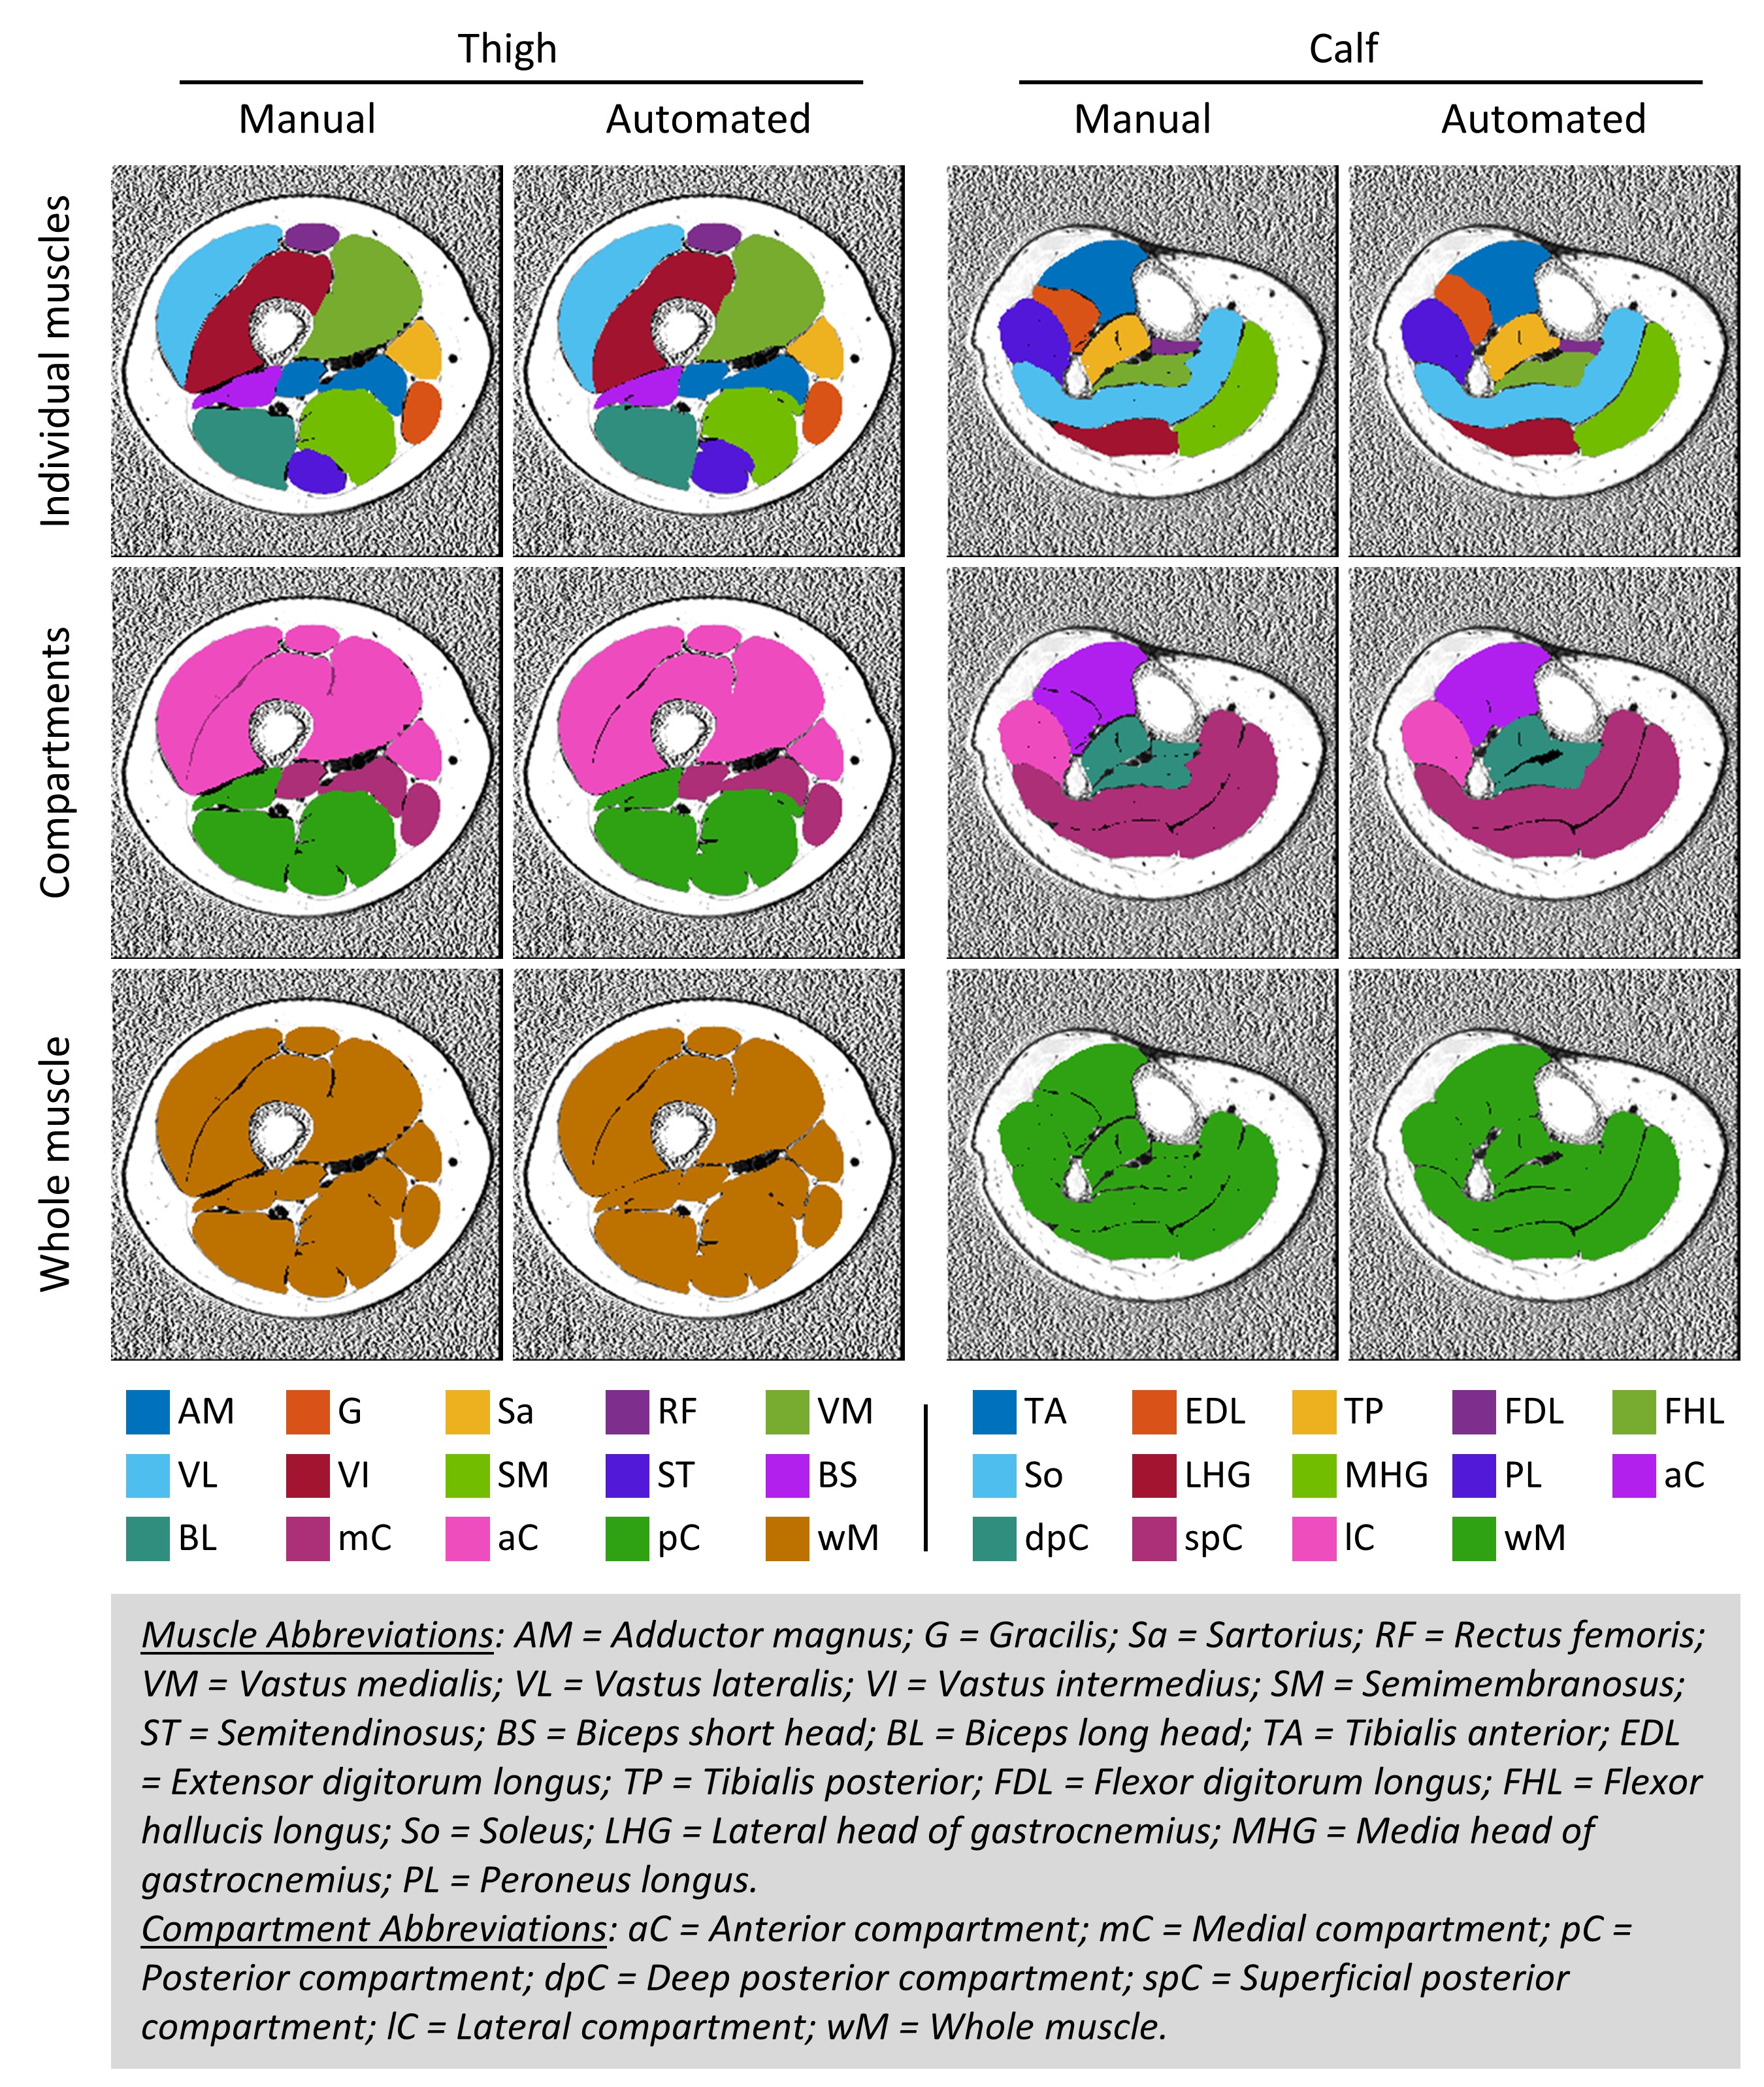
Figure
2. Representative muscle segmentation results. Images were
from data in the testing group. The individual muscles were combined to be
compartments, and then the whole muscle. Color-coded binary masks of individual
muscles, muscle compartments, and the whole muscle are overlaid onto the fat
fraction image. The same color codes for each of the muscles are used in the
results of the dice coefficient, Bland-Altman, and Pearson correlation analyses.