Kaifang Liu1, Jie Meng1, and Zhengyang Zhou1
1Departments of Radiology, Nanjing Drum Tower Hospital Clinical College of Nanjing Medical University, Nanjing, China
1Departments of Radiology, Nanjing Drum Tower Hospital Clinical College of Nanjing Medical University, Nanjing, China
The
K, D, and ADC values may be helpful as a noninvasive tool for differentiating
synovitis from joint effusion in the hands of RA patient, and although no
superiority over the ADC value was found.
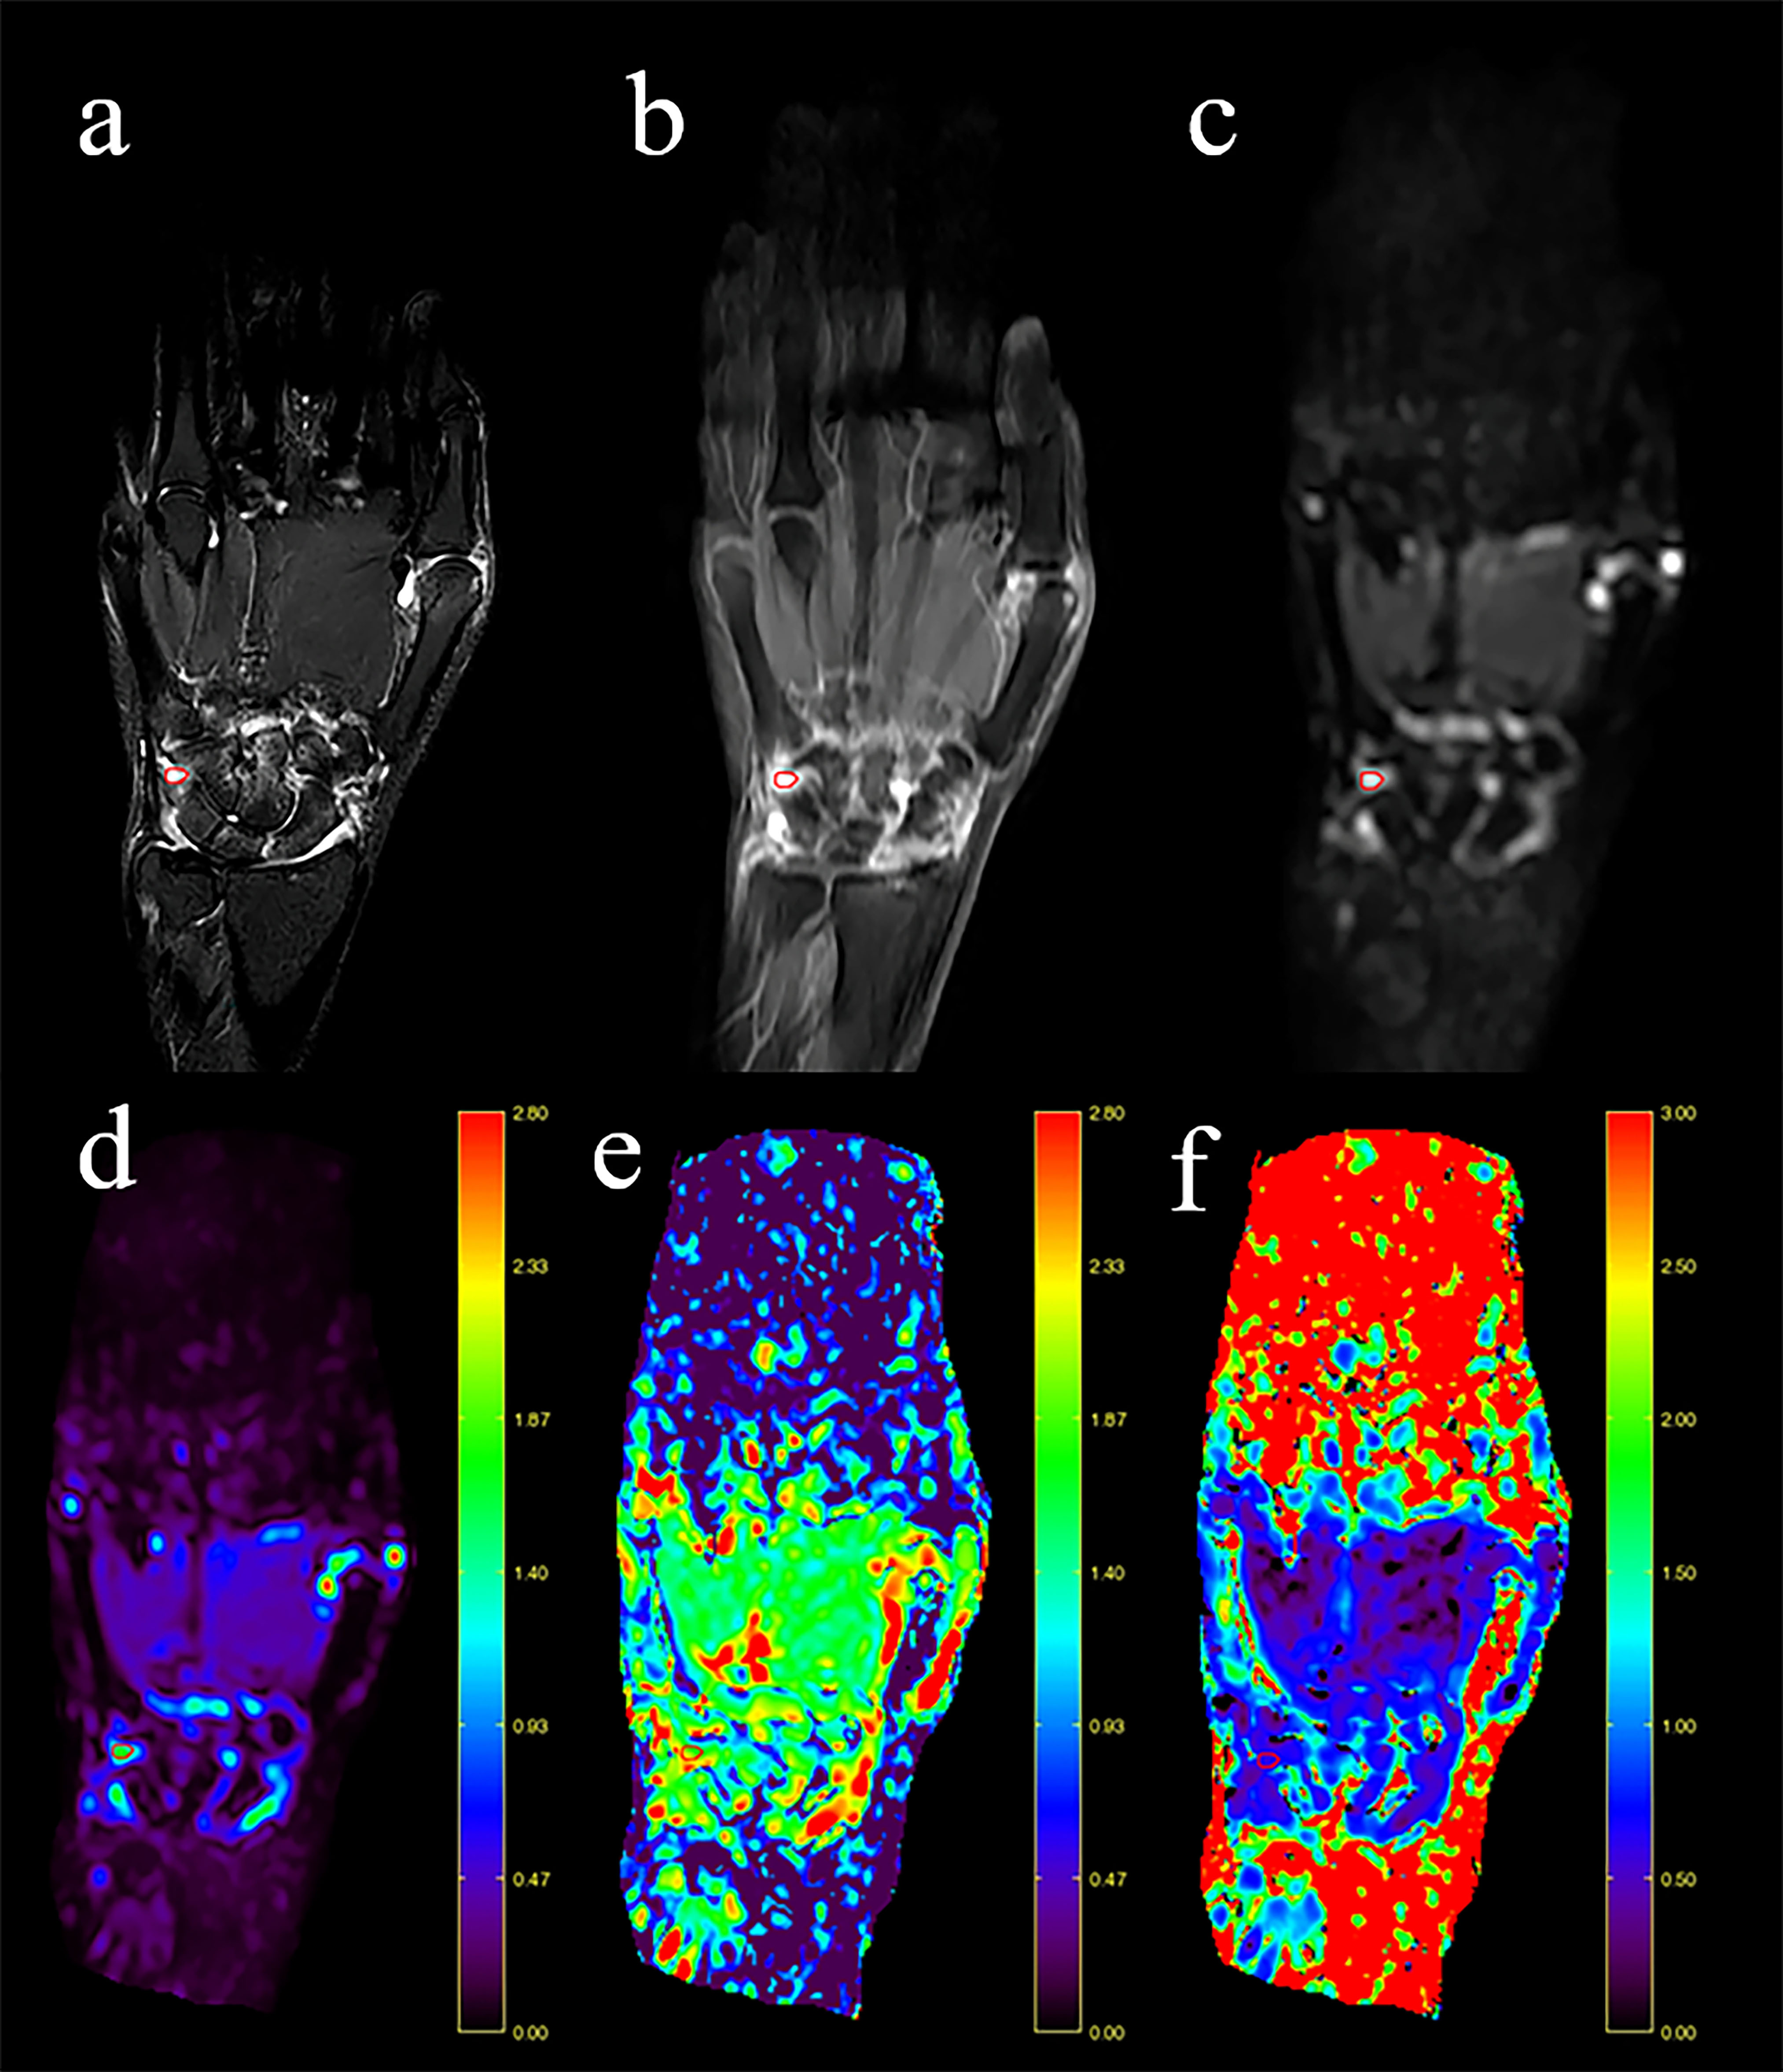
The typical case of synovitis. MRI of a 29-year-old woman with RA. (a)
T2W-SPAIR shows high signal intensity within intercarpal-carpometacarpal joints
of the left hand (The region of interest, ROI). (b) Contrast-enhanced MRI shows
high signal intensity (score 3: severe enhancements). (c) DKI (b value, 500
s/mm2) shows a hyperintense signal covered (ROI). The ADC map (d), D
map (e), and K map (f) show ADC, D, and K values for the lesion (ROI) of 1.528×10⁻³ mm2/s, 1.913×10⁻³ mm2/s, and
0.603.
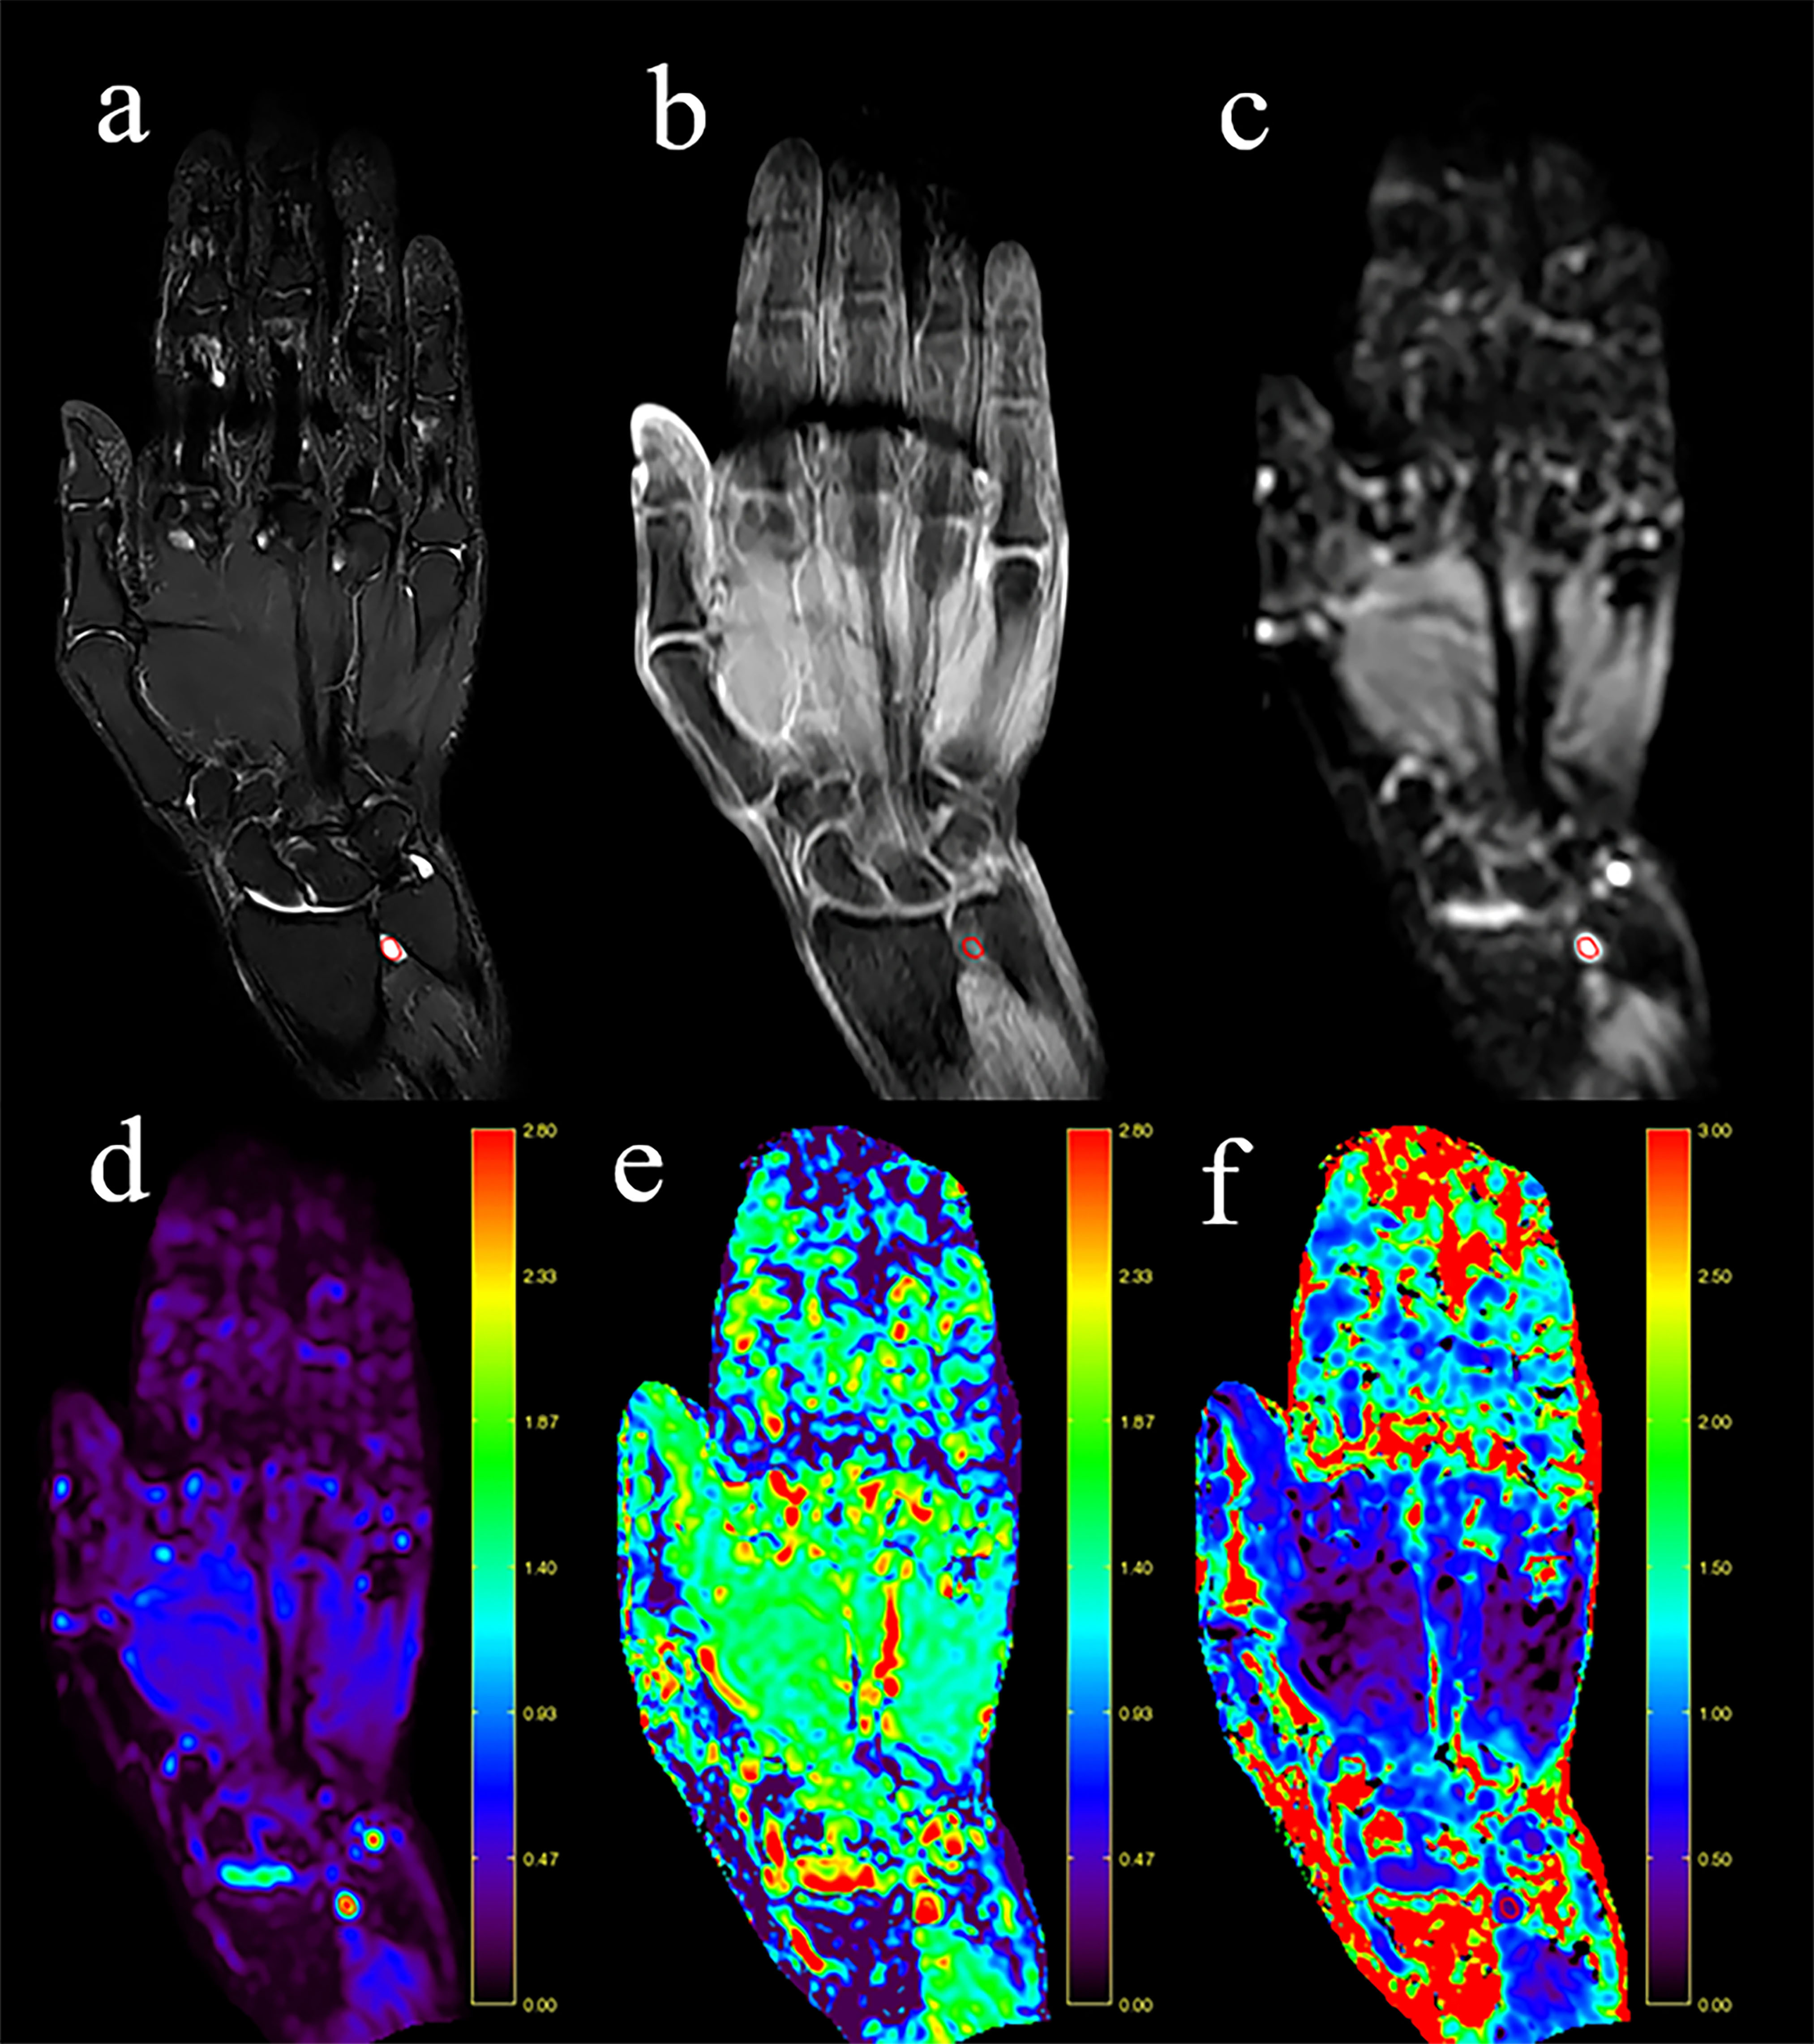
The typical case of joint effusion. MRI of a 56-year-old woman with
suspected RA. (a) T2W-SPAIR shows high signal intensity within distal
radioulnar joints of the right hand (ROI). (b) Contrast-enhanced MRI shows low
signal intensity (score 0: no enhancements). (c) DKI
(b value, 500 s/mm2) shows a hyperintense signal covered (ROI). The
ADC map (d), D map (e), and K map (f) show ADC, D, and K values for the lesion (ROI)
of 2.225×10⁻³ mm2/s, 2.463×10⁻³ mm2/s,
and 0.313.