Jacob Thoenen1, James W. MacKay2,3, Kathryn J. Stevens1, Tom D. Turmezei4, Akshay Chaudhari1, Lauren E. Watkins1, Brian A. Hargreaves1, Garry E. Gold1, and Feliks Kogan1
1Department of Radiology, Stanford University, Stanford, CA, United States, 2Department of Radiology, University of Cambridge, Cambridge, United Kingdom, 3Norwich Medical School, University of East Anglia, Norwich, United Kingdom, 4Department of Radiology, Norfolk and Norwich University Hospital, Norwich, United Kingdom
1Department of Radiology, Stanford University, Stanford, CA, United States, 2Department of Radiology, University of Cambridge, Cambridge, United Kingdom, 3Norwich Medical School, University of East Anglia, Norwich, United Kingdom, 4Department of Radiology, Norfolk and Norwich University Hospital, Norwich, United Kingdom
Moderate correlation between glucose uptake on FDG-PET (SUVmax) and synovitis evaluated on CE-MRI within the entire synovium was observed.
Strong to very strong correlation between SUVmax and synovitis evaluated on CE-MRI at four synovial subregions was observed.
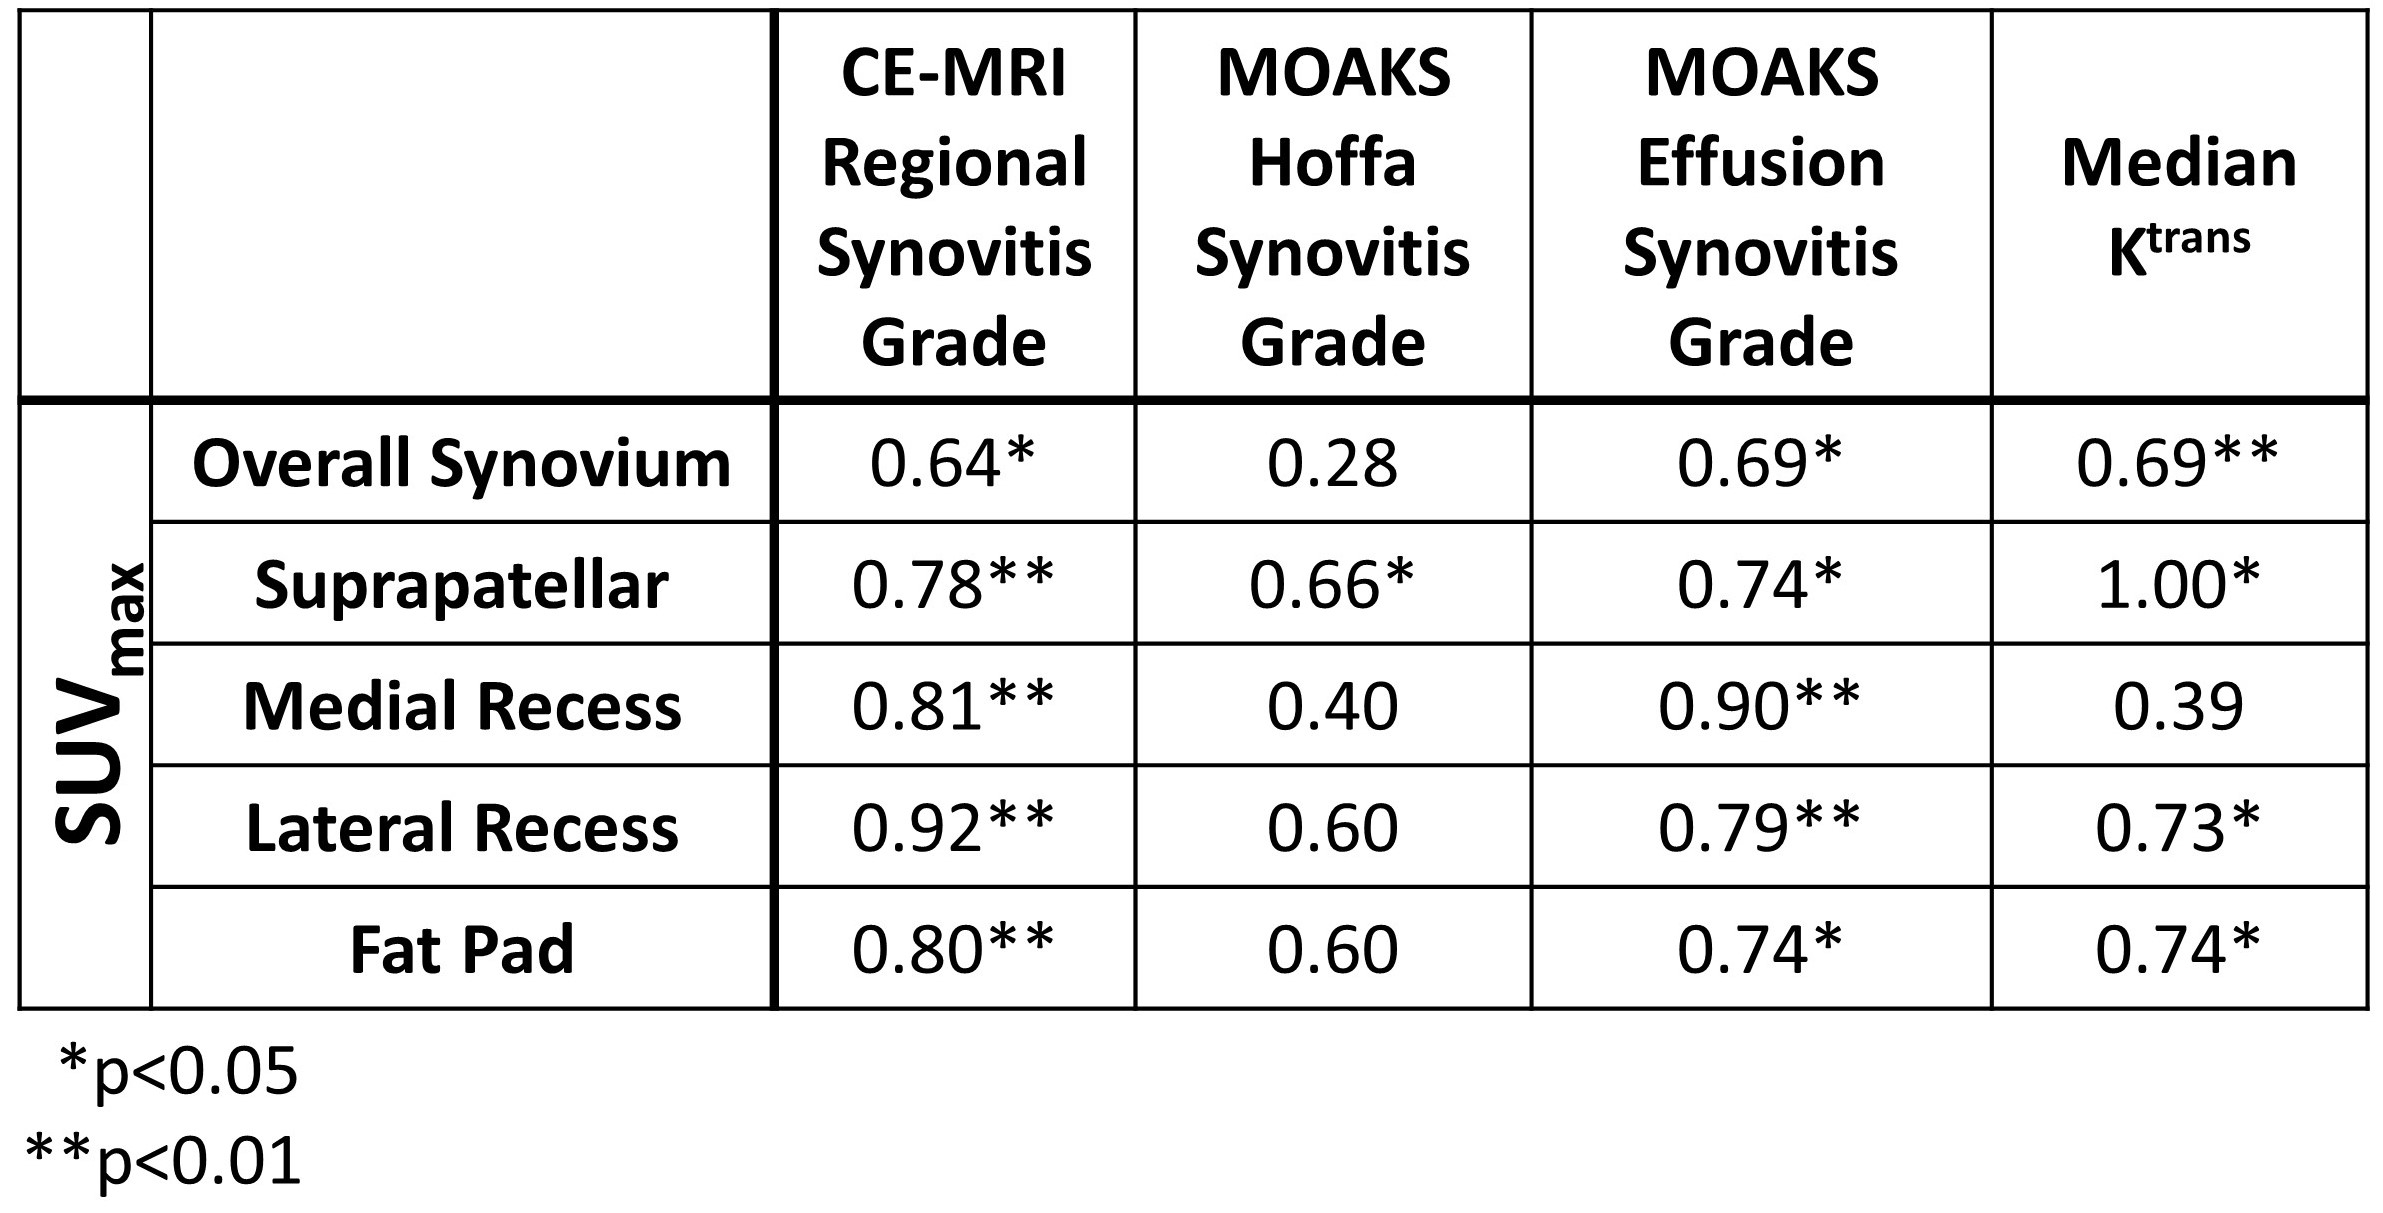
Table 2: Spearman correlation coefficients between regional SUVmax and corresponding regional synovitis severity grades on CE-MRI, overall synovitis grade, MOAKS effusion and Hoffa synovitis grades, and median Ktrans values
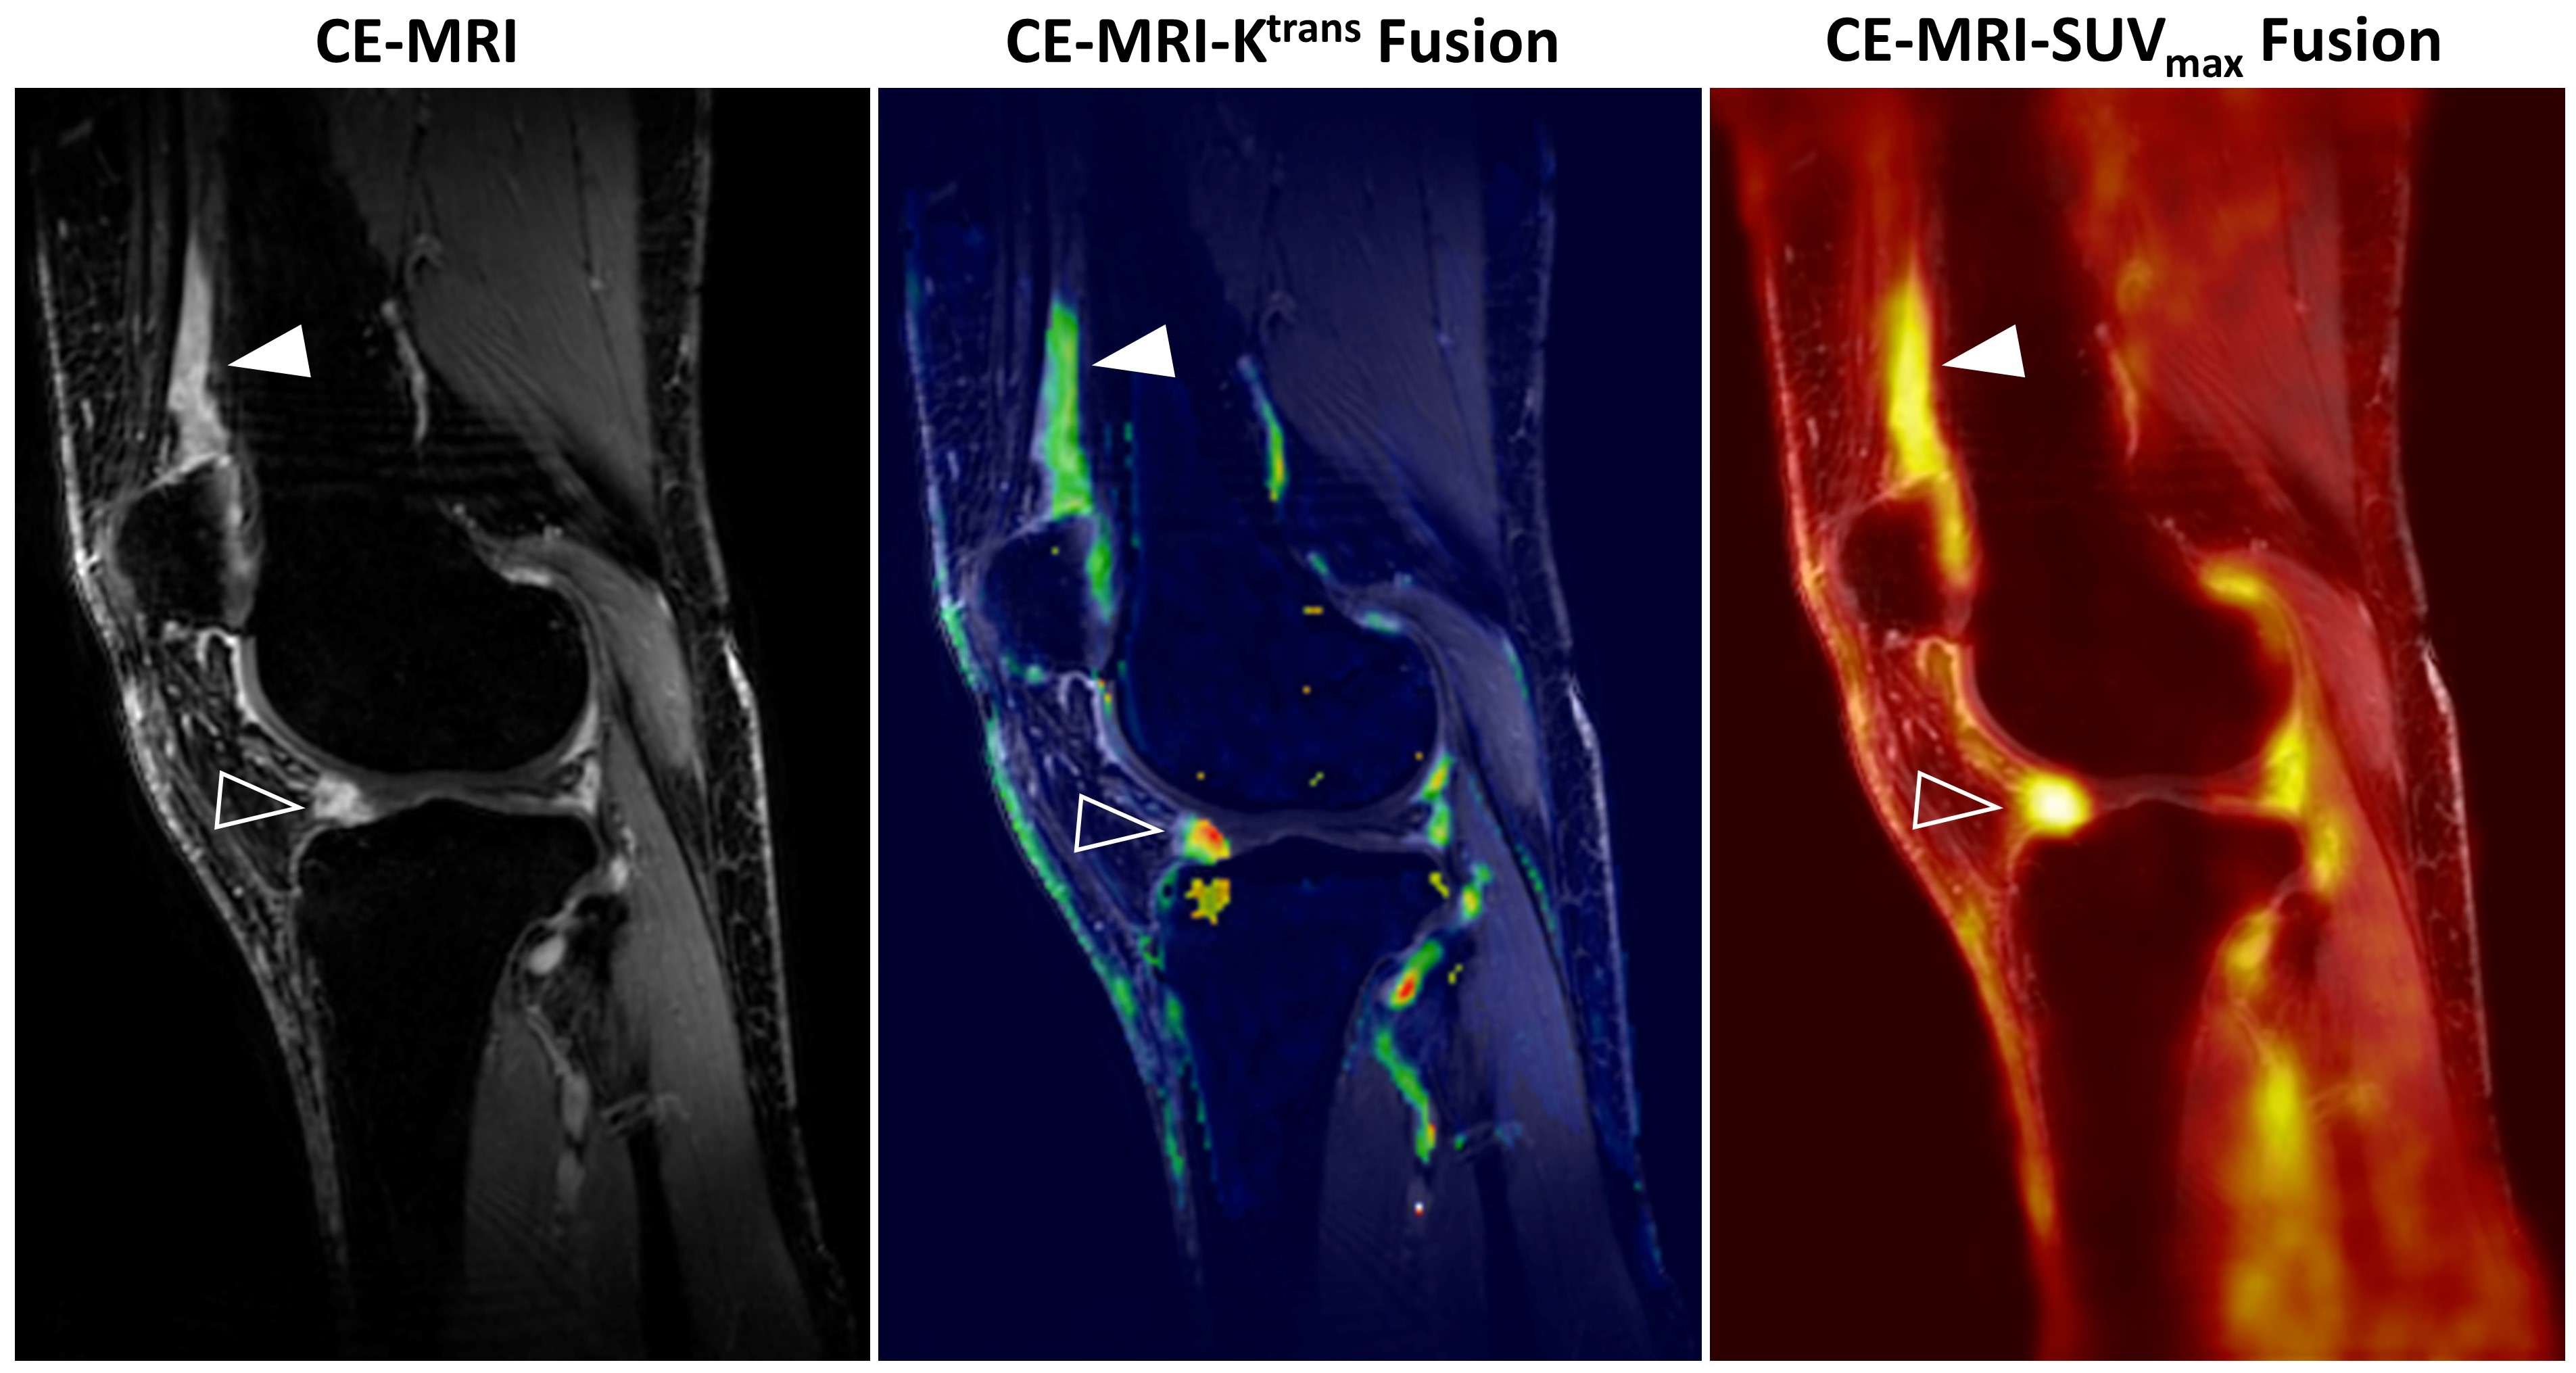
Figure 1: Side-by-side comparison of sagittal CE-MRI, Ktrans, and SUVmax fusion images. White arrowheads indicate synovitis at the suprapatellar pouch, while clear arrowheads indicate synovitis at the posterior surface of Hoffa’s fat pad.