Shuang Li1, Ailian Liu1, Lihua Chen1, Yuanfei Li1, Shuang Meng1, Jiazheng Wang2, Peng Sun2, Qingwei Song1, and Renwang Pu1
1The First Affiliated Hospital of Dalian Medical University, Dalian, Dalian, China, 2Philips Healthcare, Beijing, China, Beijing, China
1The First Affiliated Hospital of Dalian Medical University, Dalian, Dalian, China, 2Philips Healthcare, Beijing, China, Beijing, China
Both APT and ADC values show a statistical difference between patients with PCa and BPH. There is a moderate negative correlation between the APT and ADC values in PCa and BPH.
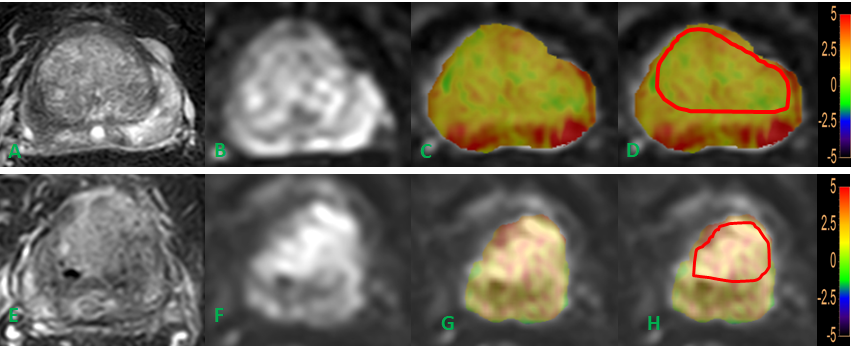
Figure 1 T2WI(A)image, DWI(B)image, fused APT and DWI (C, D) images of a BPH patient. T2WI(E)image, DWI(F)image, fused APT and DWI (G, H) images of a PCa patient. The placement of ROIs is as illustrated.
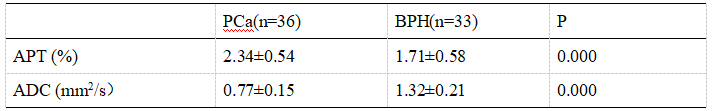
Table 2.Comparisonof APT and ADC values