Je Yeong Sone1, Yan Li1,2, Nicholas Hobson1, Sharbel G. Romanos1, Abhinav Srinath1, Seán B. Lyne1, Abdallah Shkoukani1, Julián Carrión-Penagos1, Agnieszka Stadnik1, Kristina Piedad1, Rhonda Lightle1, Thomas Moore1, Ying Li1, Dehua Bi1,3, Timothy Carroll4, Yuan Ji3, Romuald Girard1, and Issam A. Awad1
1Neurovascular Surgery Program, Section of Neurosurgery, Department of Surgery, University of Chicago Medicine and Biological Sciences, Chicago, IL, United States, 2Bioinformatics Core, Center for Research Informatics, The University of Chicago, Chicago, IL, United States, 3Department of Public Health Sciences, The University of Chicago, Chicago, IL, United States, 4Department of Diagnostic Radiology, University of Chicago Medicine and Biological Sciences, Chicago, IL, United States
1Neurovascular Surgery Program, Section of Neurosurgery, Department of Surgery, University of Chicago Medicine and Biological Sciences, Chicago, IL, United States, 2Bioinformatics Core, Center for Research Informatics, The University of Chicago, Chicago, IL, United States, 3Department of Public Health Sciences, The University of Chicago, Chicago, IL, United States, 4Department of Diagnostic Radiology, University of Chicago Medicine and Biological Sciences, Chicago, IL, United States
Perfusion derivations helped
distinguish CASH 3–12 months prior with 80% sensitivity and 82% specificity.
A combination of permeability and perfusion derivations predicted subsequent CA
bleeding/growth with 77% sensitivity and 72% specificity.
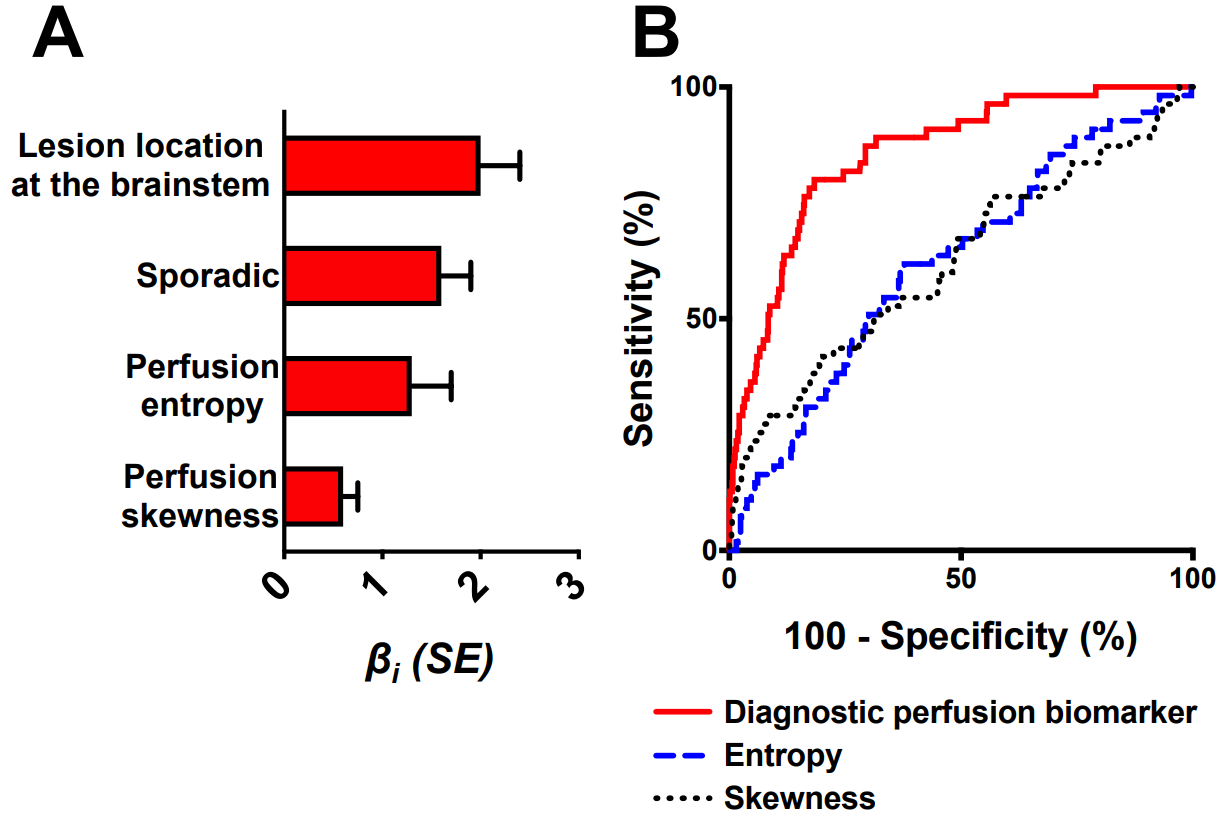
Figure 1. The best diagnostic
biomarker of CASH 3–12 months prior to DCEQP imaging. (A) Weighted βi coefficients of covariates (all p<0.05) in the perfusion biomarker of CASH
3–12 months prior; error bars are SE. (B) The biomarker distinguished
CASH 3–12 months prior (AUC=0.86, p<0.0001) better than entropy (AUC=0.62,
p=0.003) or skewness (AUC=0.62, p=0.003) alone. Abbreviations: area
under the curve (AUC), cavernous angioma with symptomatic hemorrhage (CASH), dynamic
contrast-enhanced quantitative perfusion (DCEQP); standard error (SE).
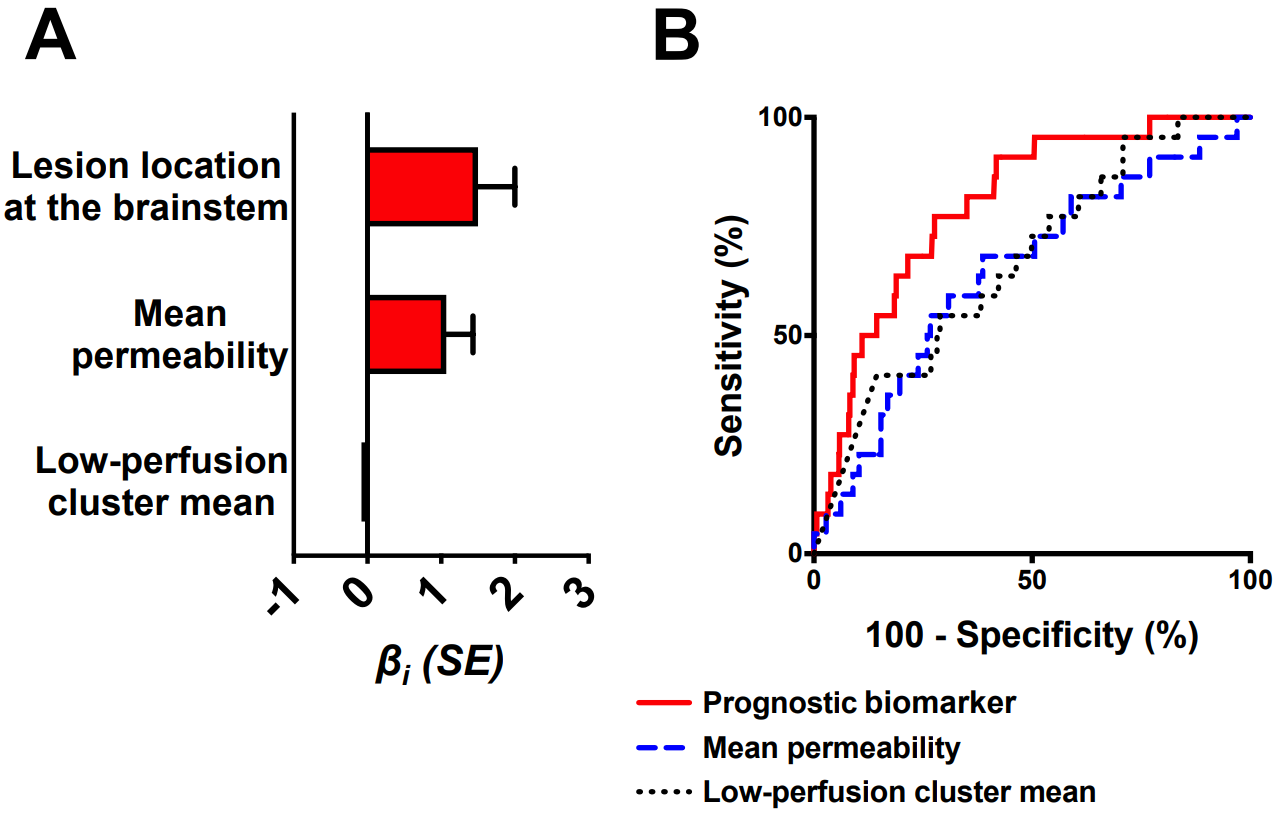
Figure 2. The best prognostic biomarker of bleeding/growth within a year after DCEQP
imaging. (A) Weighted βi
coefficients of covariates (all p<0.05) in the prognostic biomarker; error
bars are SE. One outlier (studentized residual>3) was excluded. (B)
The biomarker (AUC=0.80, p<0.0001) predicted bleeding/growth better than
mean permeability (AUC=0.65, p=0.019) or low-perfusion cluster mean (AUC=0.67,
p=0.007) alone. Abbreviations: area under the curve (AUC), dynamic contrast-enhanced quantitative perfusion
(DCEQP); standard
error (SE).