Mingzhu Fu1, Shuo Chen1, Miaoqi Zhang1, and Rui Li1
1Center for Biomedical Imaging Research, Department of Biomedical Engineering, Tsinghua University, Beijing, China
1Center for Biomedical Imaging Research, Department of Biomedical Engineering, Tsinghua University, Beijing, China
Relationship between aneurysm wall enhancement and distribution of WSS and OSI from pixel-wise perspective
based on the self-control of aneurysm was studied. Statistics indicated that enhanced wall area
of intracranial aneurysm had significant lower WSS and higher OSI.
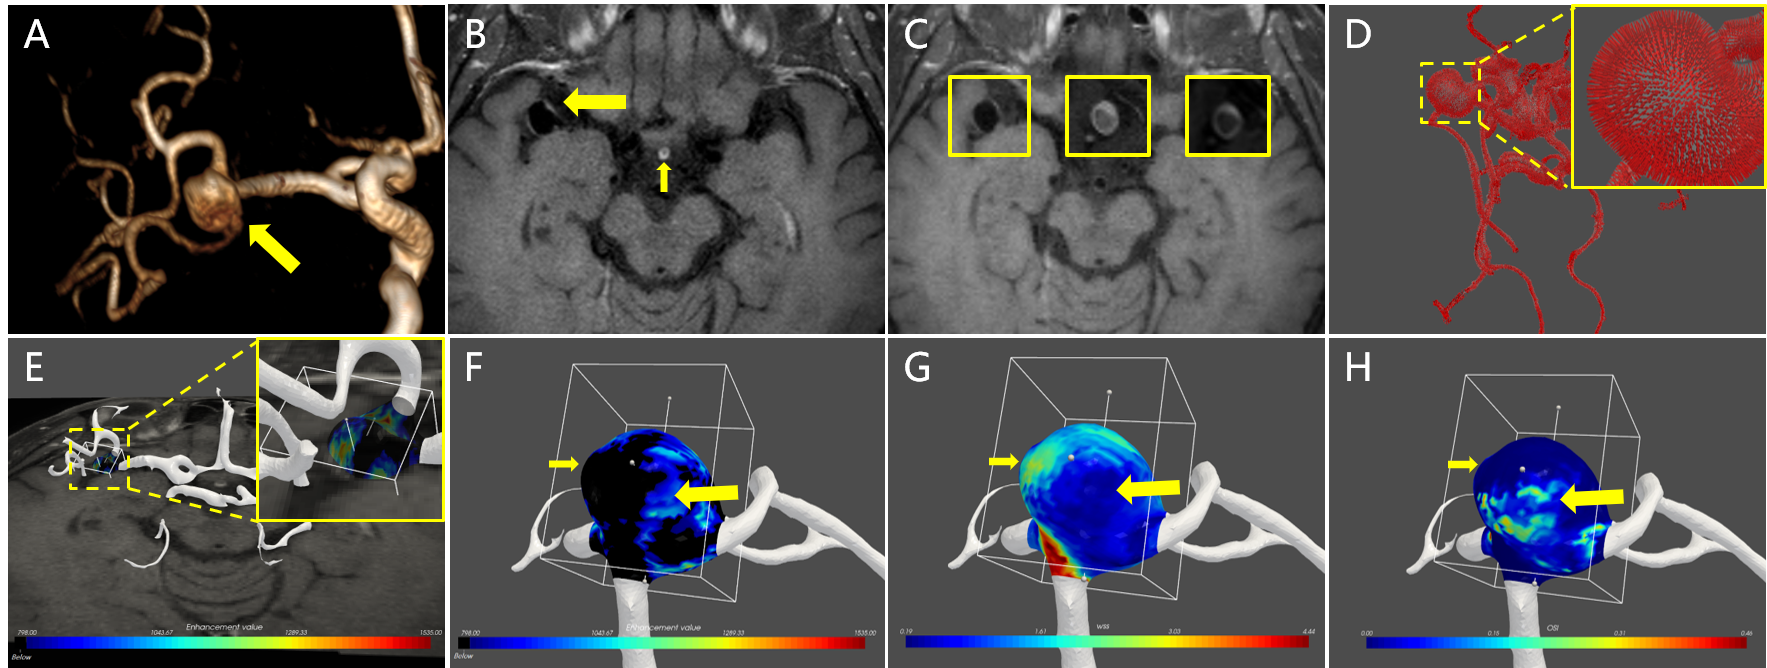
Figure.1 A, MRA. B, Enhancement on aneurysm (large
arrow) and pituitary infundibulum (small arrow). C, Corresponding image of aneurysm
on MR-VW postgadolinium T1WI (left), TOF (inset, middle) and 4D Flow MRI
(inset, right). D, Normal vectors of vessel wall. E, Joint visualization of MR-VW
postgadolinium T1WI and vessel model. F, Distribution of enhancement values on
low enhanced area (black) and high enhanced area (polychrome). G, WSS
distribution. H, OSI distribution. The high enhanced area (large arrow) had
lower WSS and higher OSI than low enhanced area (small arrow).
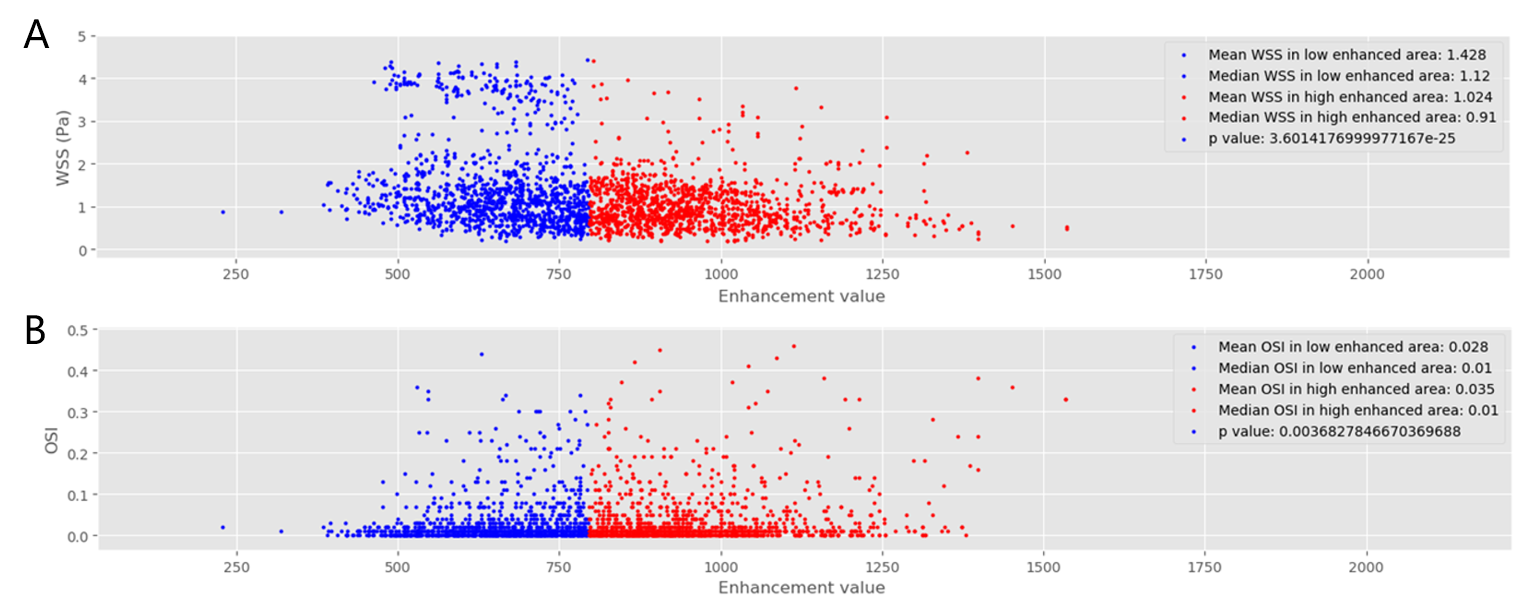
Figure.2 Scatter plot
of distributions of WSS (A) and OSI (B) on low enhanced area (blue dots) and
high enhanced area (red dots) of aneurysm located at the end of M1 of
middle cerebral artery.