Dan Zhu1 and Qin Qin2,3
1Department of Biomedical Engineering, Johns Hopkins University, Baltimore, MD, United States, 2The Division of MR Research, Department of Radiology, Johns Hopkins University, Baltimore, MD, United States, 3F.M. Kirby Research Center for Functional Brain Imaging, Kennedy Krieger Institute, Baltimore, MD, United States
1Department of Biomedical Engineering, Johns Hopkins University, Baltimore, MD, United States, 2The Division of MR Research, Department of Radiology, Johns Hopkins University, Baltimore, MD, United States, 3F.M. Kirby Research Center for Functional Brain Imaging, Kennedy Krieger Institute, Baltimore, MD, United States
We
provide analytical formulation of the point spread function of Cartesian TFE,
bSSFP, and TSE with 180° refocusing. The contrast-to-noise ratio is defined and
maximized analytically with optimal TFE/TSE factors and flip angles.
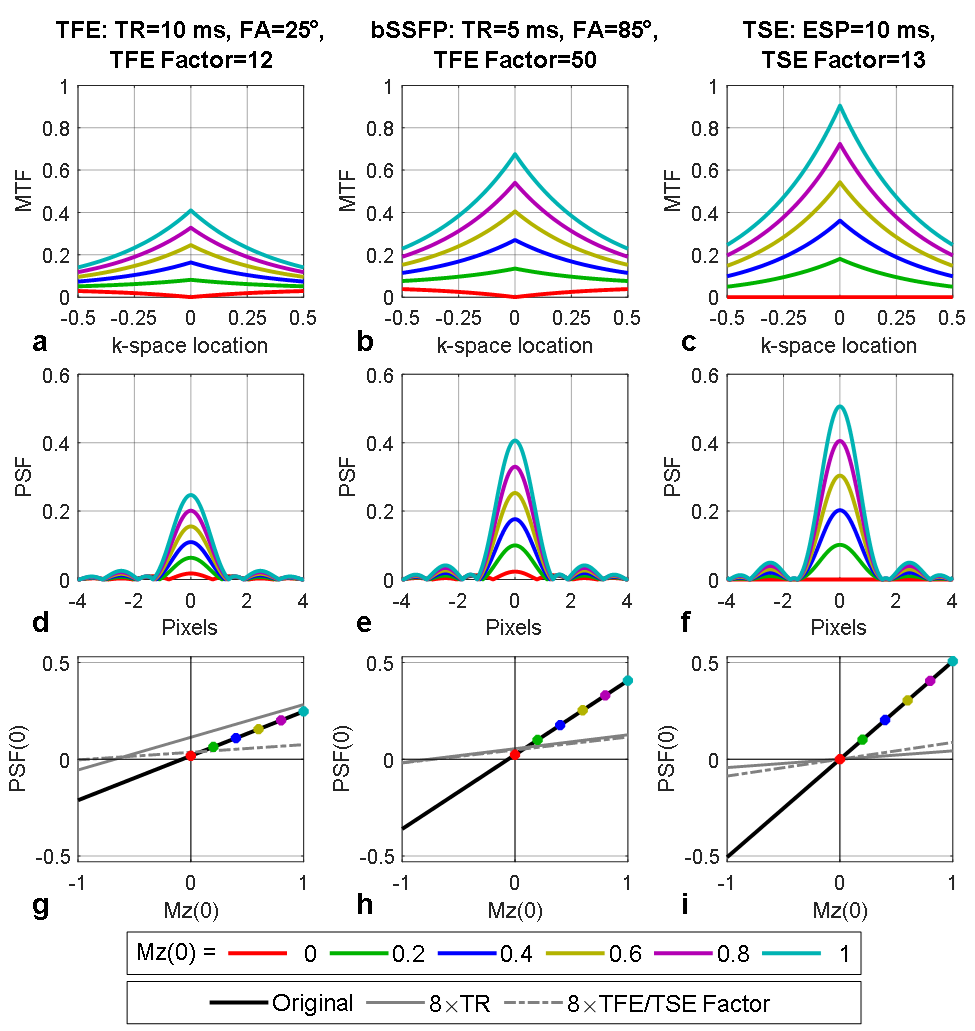
Figure 1: MTF (a-c) and PSF(d-f) at variant Mz(0) levels, and
the linear relationship between Mz(0) and the PSF peak-amplitude (g-i) of a
typical TFE (left), bSSFP (center) and TSE sequence (right) when T1=1000ms,
T2=100ms and T2*=50ms. Optimal TFE/TSE factors and FAs are chosen for TFE and
TSE sequence at TR/ESP=10ms that maximize CNR. The TFE factor and the flip
angle of bSSFP are chosen with 95% maximum CNR. Grey lines in g-i demonstrate contrast
loss in all sequences and increased intercept (bias) in TFE and bSSFP with TR
or TFE/TSE Factors 8 times larger than the optimal choice.
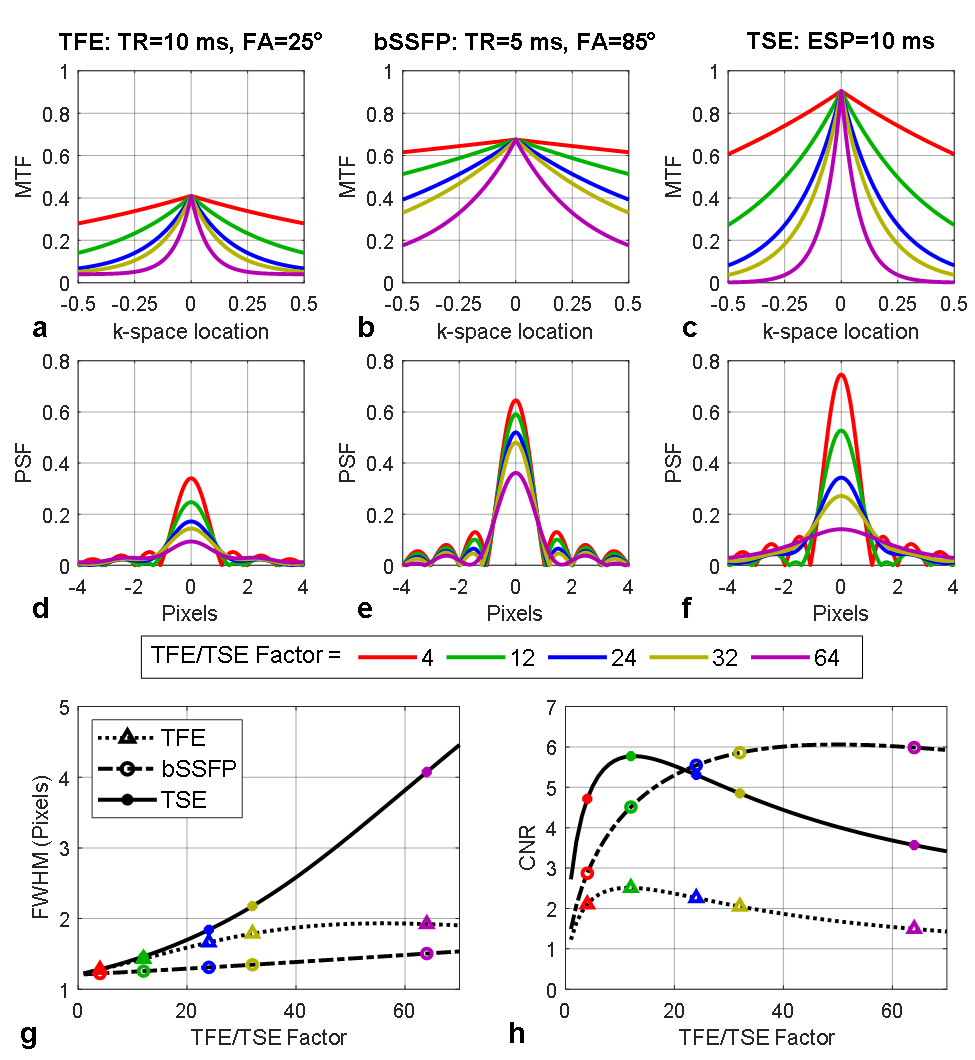
Figure 2: MTF (a-c) and PSF(d-f) with different TFE/TSE
factors of a typical TFE (a,d), bSSFP (b,e) and TSE sequence (c,f) when
T1=1000ms, T2=100ms, T2*=50ms and Mz(0)=1. The FWHM of the main PSF lobe (g)
and CNR (h) are plotted as curves over TFE/TSE factors, demonstrating the
blurring effect and contrast preservation performance, respectively. The
colored markers are from the respective TFE/TSE factors shown in (a-f). All methods are
subject to peak-amplitude loss of the PSF peak with longer TFE/TSE factors.