John P. Murray1,2,3, Richard Lartey1,3, Jeehun Kim1,3, Mei Li1,3, Sibaji Gaj1,3, Brendan Eck1,4, Donxing Xie1,3, Carl Winalski1,3,4, Faysal Altahawi3,4, Morgan H. Jones3,5, Bruce M Damon6, Laura J Huston7, Huyen T. Nguyen8, Michael V Knopp8, Kurt P. Spindler3,5, and Xiaojuan Li1,3,4
1Dept. of Biomedical Engineering, Lerner Research Institute, Cleveland Clinic, Cleveland, OH, United States, 2Dept. of Biomedical Engineering, Case Western Reserve University, Cleveland, OH, United States, 3Program of Advanced Musculoskeletal Imaging (PAMI), Cleveland Clinic, Cleveland, OH, United States, 4Dept. of Diagnostic Radiology, Imaging Inst., Cleveland Clinic, Cleveland, OH, United States, 5Dept. of Orthopaedic Surgery, Orthopaedics and Rheumatology Inst., Cleveland, OH, United States, 6Dept. of Radiology, Vanderbilt University, Nashville, TN, United States, 7Dept. of Orthopaedics and Rehabilitation, Vanderbilt University, Nashville, TN, United States, 8Dept. of Radiology, Wright Ctr. Of Innovation in BioMed. Imaging, The Ohio State University, Columbus, OH, United States
1Dept. of Biomedical Engineering, Lerner Research Institute, Cleveland Clinic, Cleveland, OH, United States, 2Dept. of Biomedical Engineering, Case Western Reserve University, Cleveland, OH, United States, 3Program of Advanced Musculoskeletal Imaging (PAMI), Cleveland Clinic, Cleveland, OH, United States, 4Dept. of Diagnostic Radiology, Imaging Inst., Cleveland Clinic, Cleveland, OH, United States, 5Dept. of Orthopaedic Surgery, Orthopaedics and Rheumatology Inst., Cleveland, OH, United States, 6Dept. of Radiology, Vanderbilt University, Nashville, TN, United States, 7Dept. of Orthopaedics and Rehabilitation, Vanderbilt University, Nashville, TN, United States, 8Dept. of Radiology, Wright Ctr. Of Innovation in BioMed. Imaging, The Ohio State University, Columbus, OH, United States
In a multi-vendor multi-site prospective study, significantly elevated cartilage
MR T1ρ and T2 were observed
in operated knees as compared to the contra-lateral knees at 10 years after ACL
reconstruction.
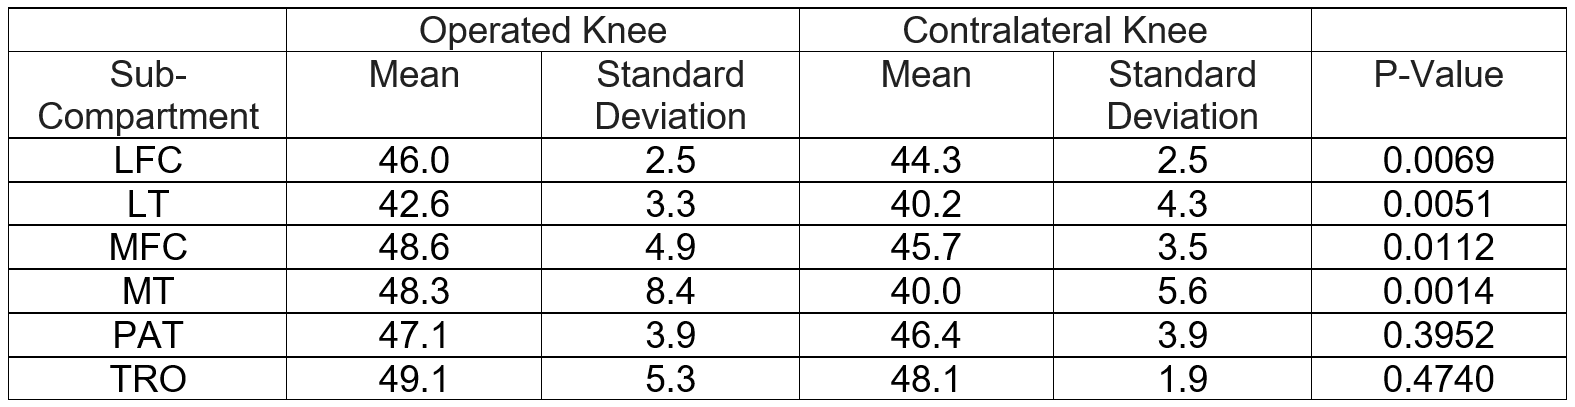
Table 2. T1ρ values (in ms) of patients in the operated
and contralateral knees. Significantly elevated T1ρ were observed in
LFC, LT, MFC and MT.
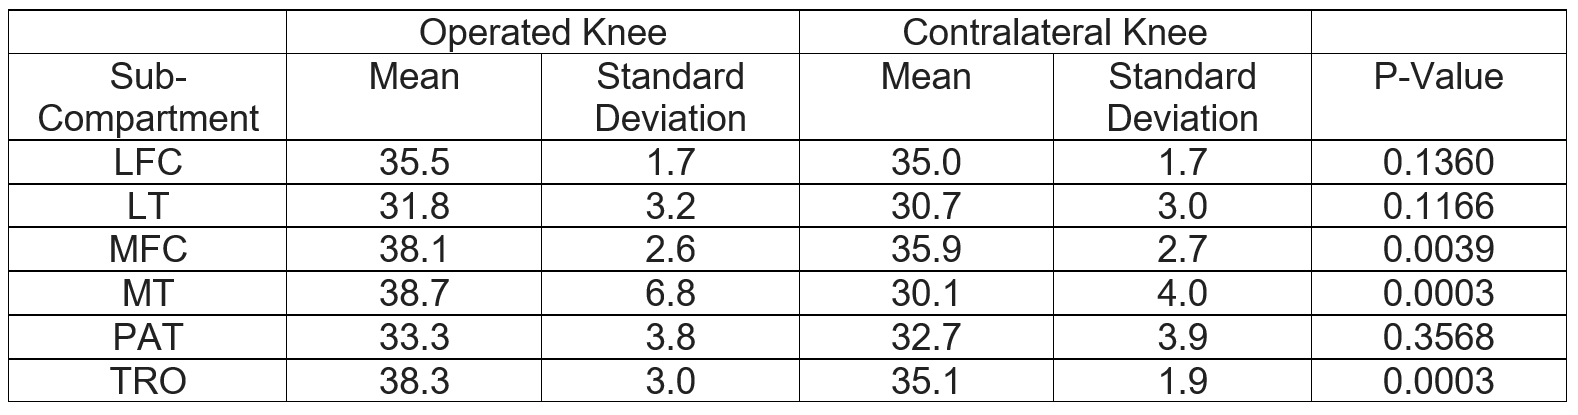
Table 3. T2 values (in ms) of patients in
the operated and contralateral knees. Significantly elevated T1ρ were
observed in MFC, MT and TRO.