Woo Young Kang1, Suk-Joo Hong1, Jinwoo Han1, Yoonmi Choi1, Chang Ho Kang2, Kyung-sik Ahn2, Baek Hyun Kim3, and Euddeum Shim3
1Radiology, Korea University Guro Hospital, Seoul, Korea, Republic of, 2Radiology, Korea University Anam Hospital, Seoul, Korea, Republic of, 3Radiology, Korea University Ansan Hospital, Ansan, Korea, Republic of
1Radiology, Korea University Guro Hospital, Seoul, Korea, Republic of, 2Radiology, Korea University Anam Hospital, Seoul, Korea, Republic of, 3Radiology, Korea University Ansan Hospital, Ansan, Korea, Republic of
Statistically
significant correlations were revealed between WORMS features and K-L grade in
MFTJ and total joint, pain (VAS) and R1rho value in MFC, and pain (VAS) and BME
in intercondylar area.
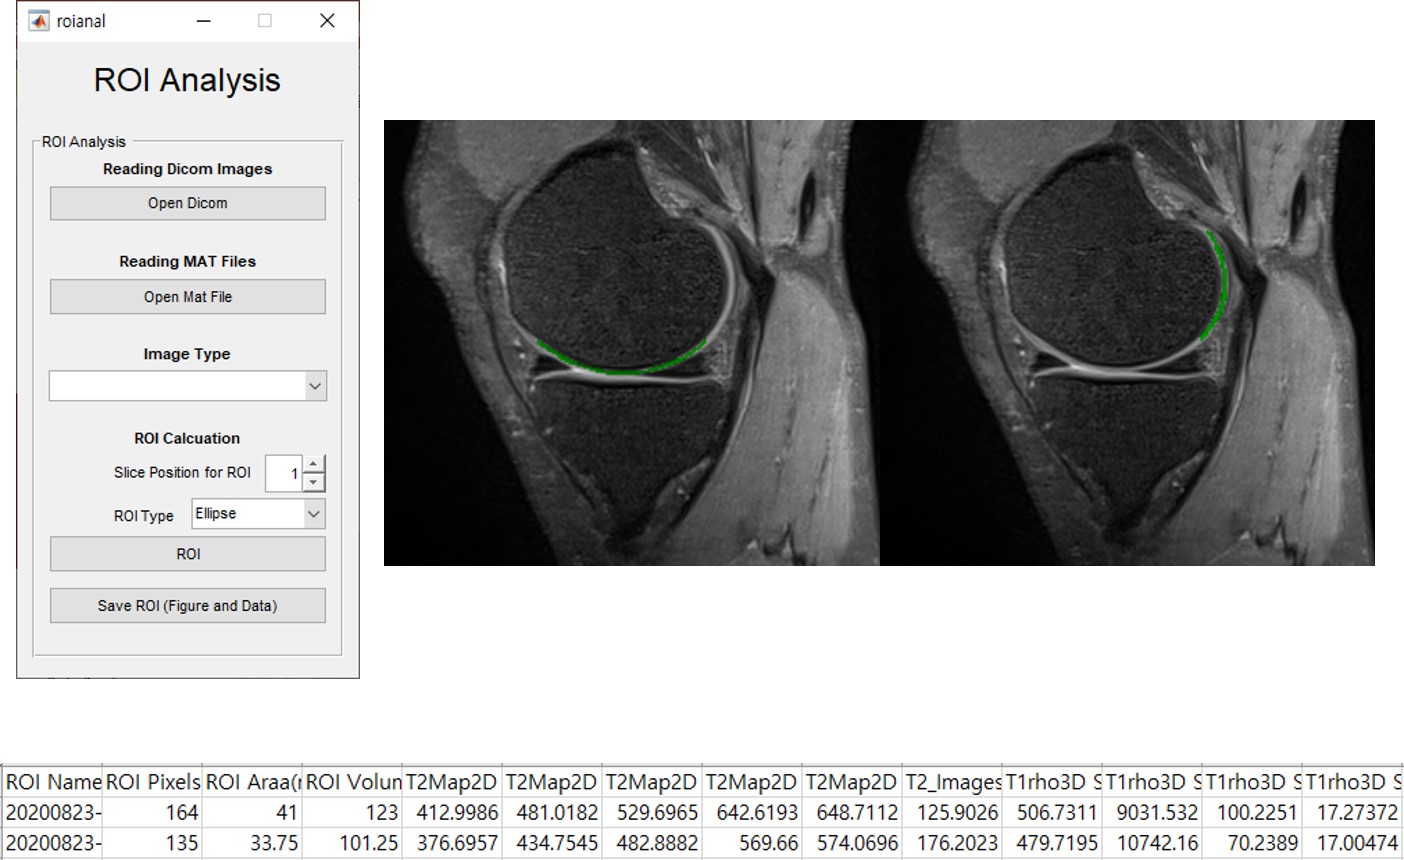
In
order
to place the ROIs in the same locations on both T1ρ and T2 maps, ROIs were
drawn manually on the PD weighted images and automatically copy –pasted on to
T1ρ and T2 maps. The automatically measured T1ρ, R1ρ and T2 TRs of each ROI
were plotted in Microsoft Excel.
All of image processing described above
was performed using software in Matlab (Mathworks, Natick, MA) that was developed
and implemented in-house.
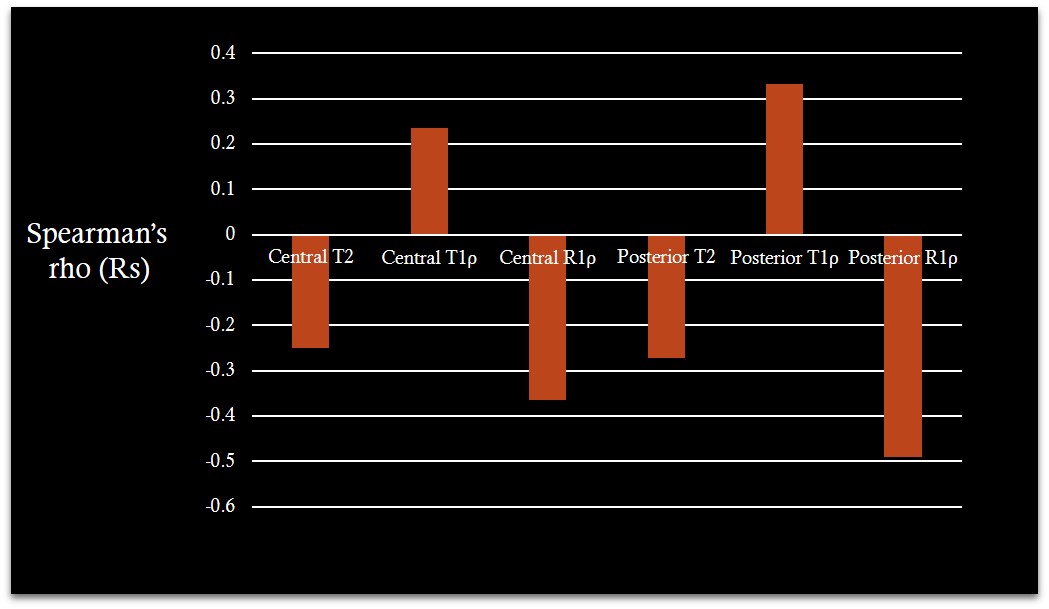
In the analysis of the association between VAS and T1ρ, R1ρ and T2 values, VAS
was significantly correlated and negatively with the R1 ρ
values in central and posterior portion of MFC.