Marco Barbieri1, Lauren Watkins1,2, Arjun D. Desai1,3, Valentina Mazzoli1, Elka Rubin1, Andrew Schmidt1, Garry E. Gold1,2, Brian A. Hargreaves1,2,3, Akshay S. Chaudhari1,4, and Feliks Kogan1
1Department of Radiology, Stanford University, Stanford, CA, United States, 2Department of Bioengineering, Stanford University, Stanford, CA, United States, 3Department of Electrical Engineering, Stanford University, Stanford, CA, United States, 4Department of Biomedical Data Science, Stanford University, Stanford, CA, United States
1Department of Radiology, Stanford University, Stanford, CA, United States, 2Department of Bioengineering, Stanford University, Stanford, CA, United States, 3Department of Electrical Engineering, Stanford University, Stanford, CA, United States, 4Department of Biomedical Data Science, Stanford University, Stanford, CA, United States
B1-correction
for qDESS T2 mapping corrected
for between-sample pair differences in the T2-phantom.
In-vivo results showed that B1-correction can mitigate variations
driven by the sensitivity of the T2
mapping method to B1 instead of reflecting biological
changes.
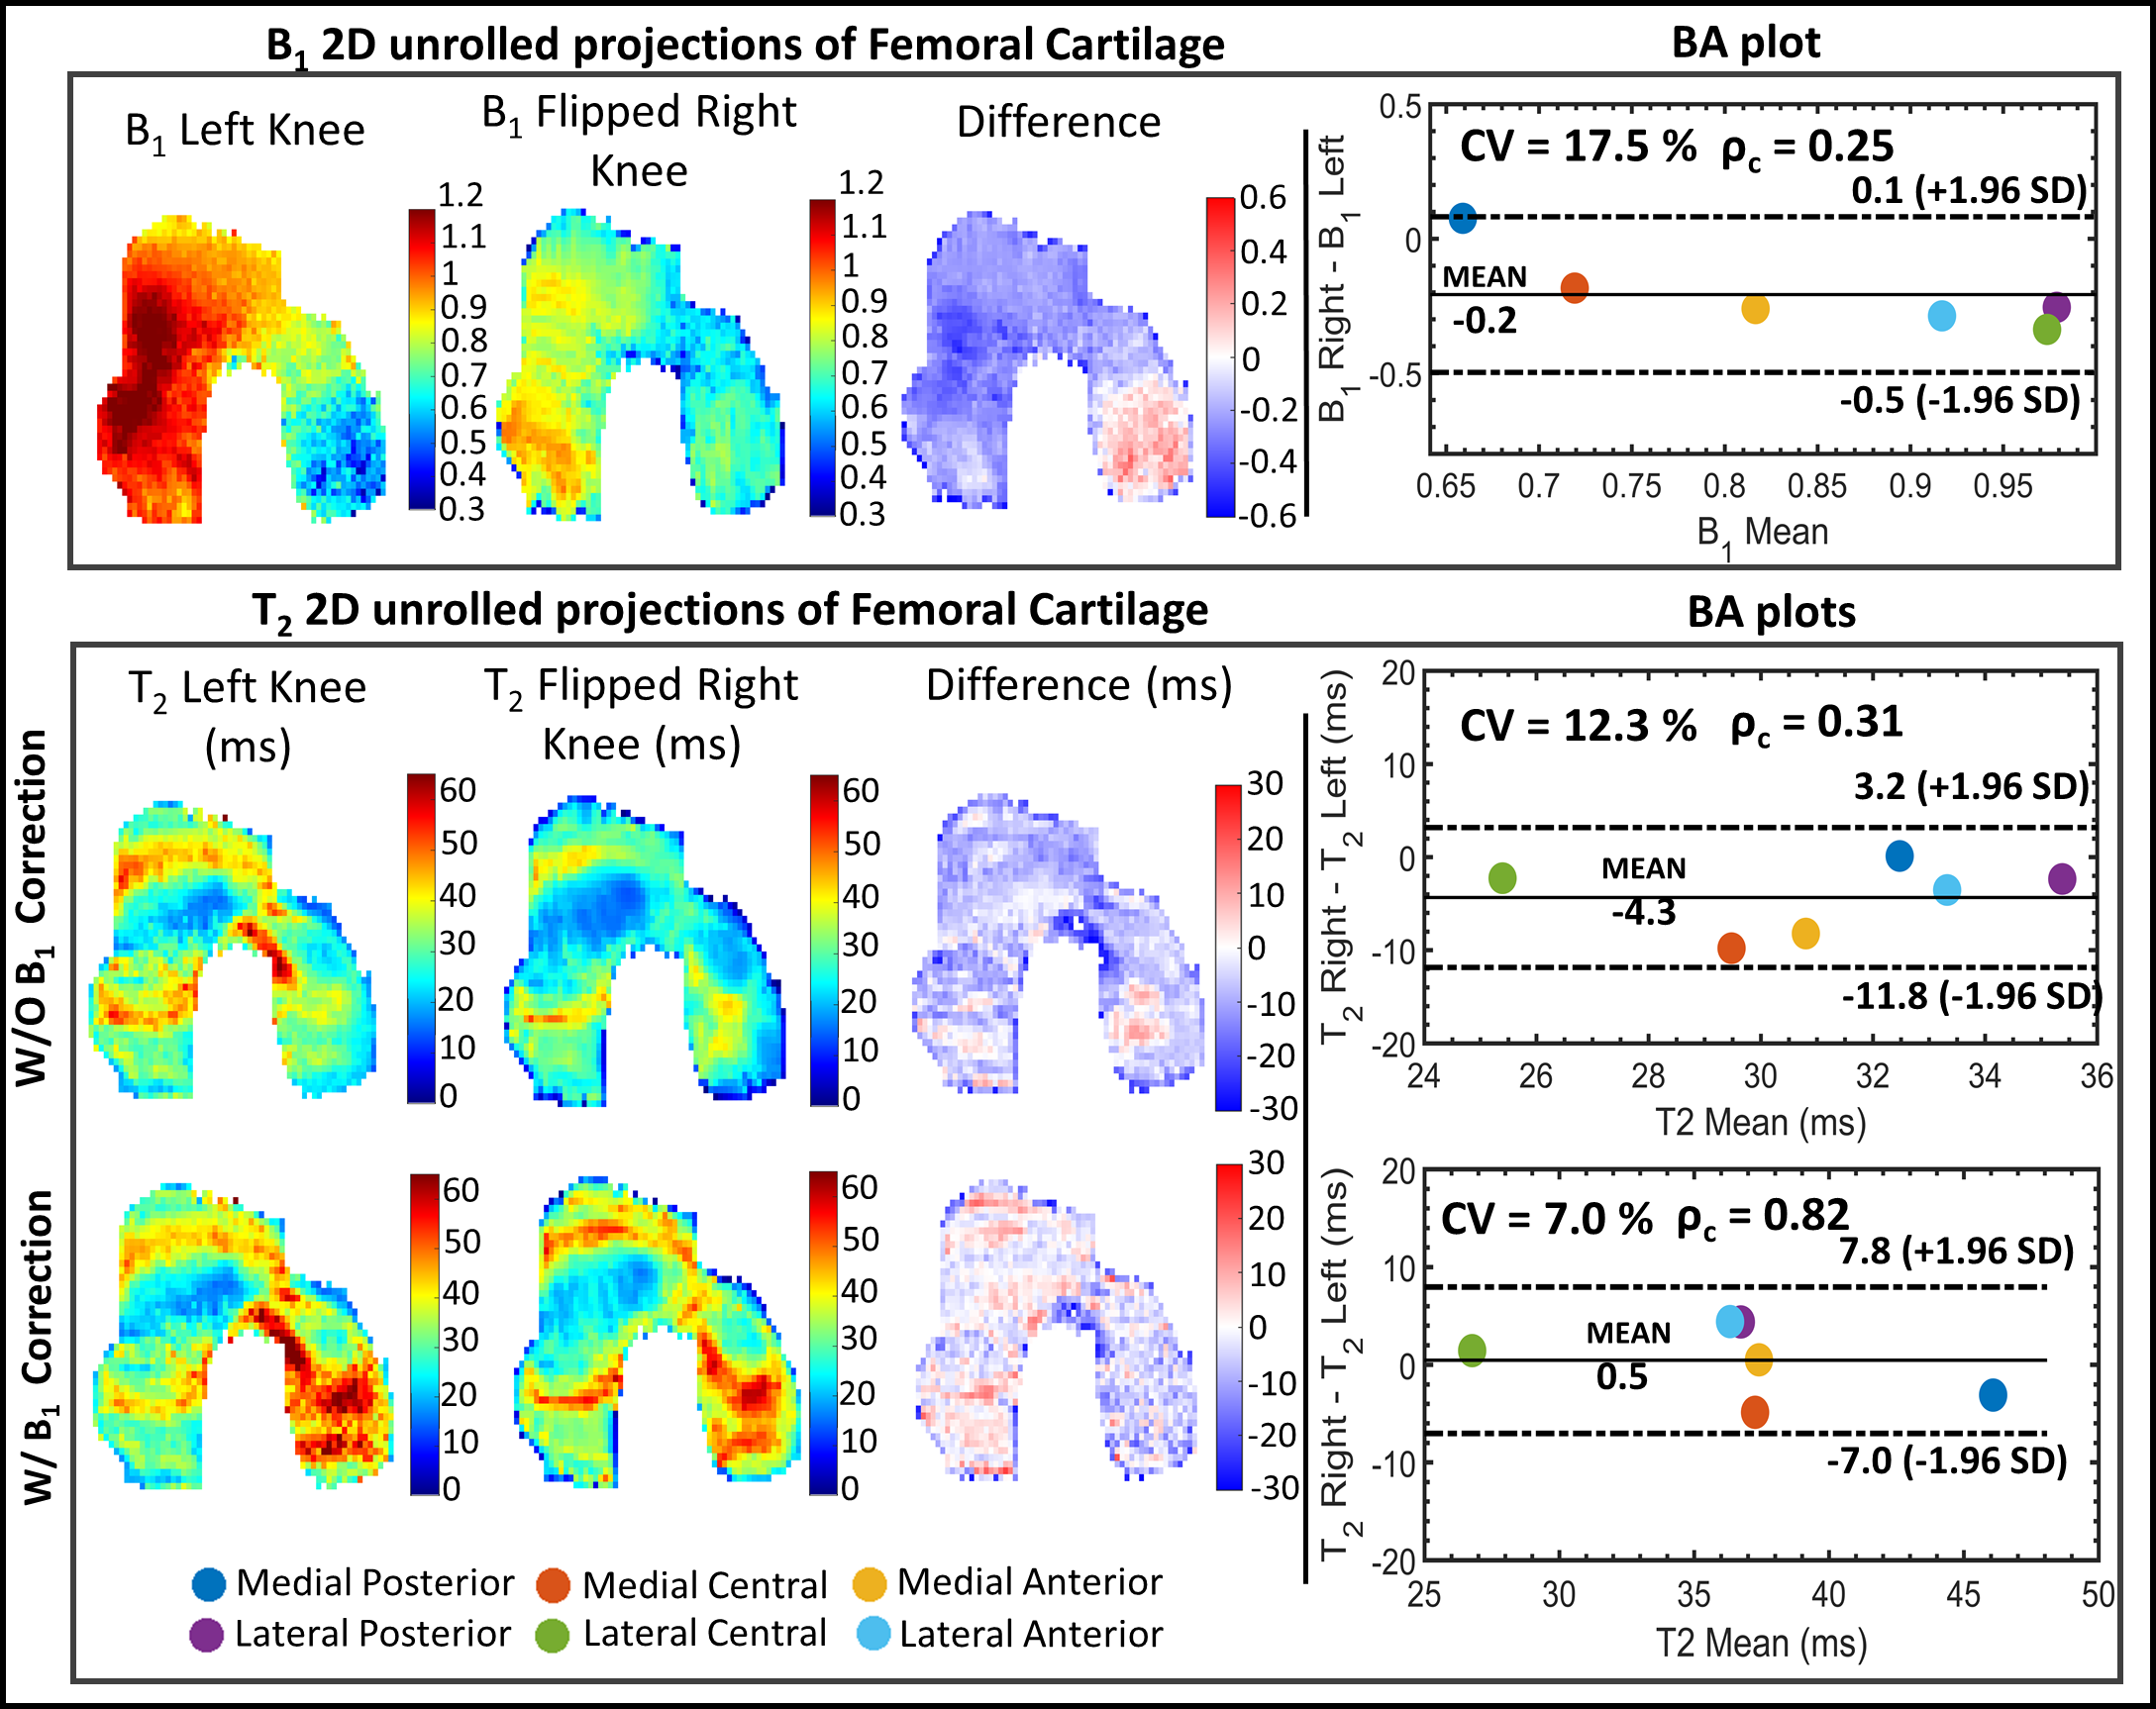
Fig.3:Example of comparison
between the left and right T2
maps of FC where B1 differs substantially
between the left and right knee. Each row displays the quantitative parameter
(B1 and T2 in the top and bottom panels, respectively) 2D unrolled
projections of FC for the left and the mirrored right knee along with their pixel-wise
difference and the BA plots between left and right parameter values in the six FC sub-regions. Overall, there is a relatively high difference
between B1 in the left and right knee. Applying the B1 correction improves the
expected symmetry in T2.
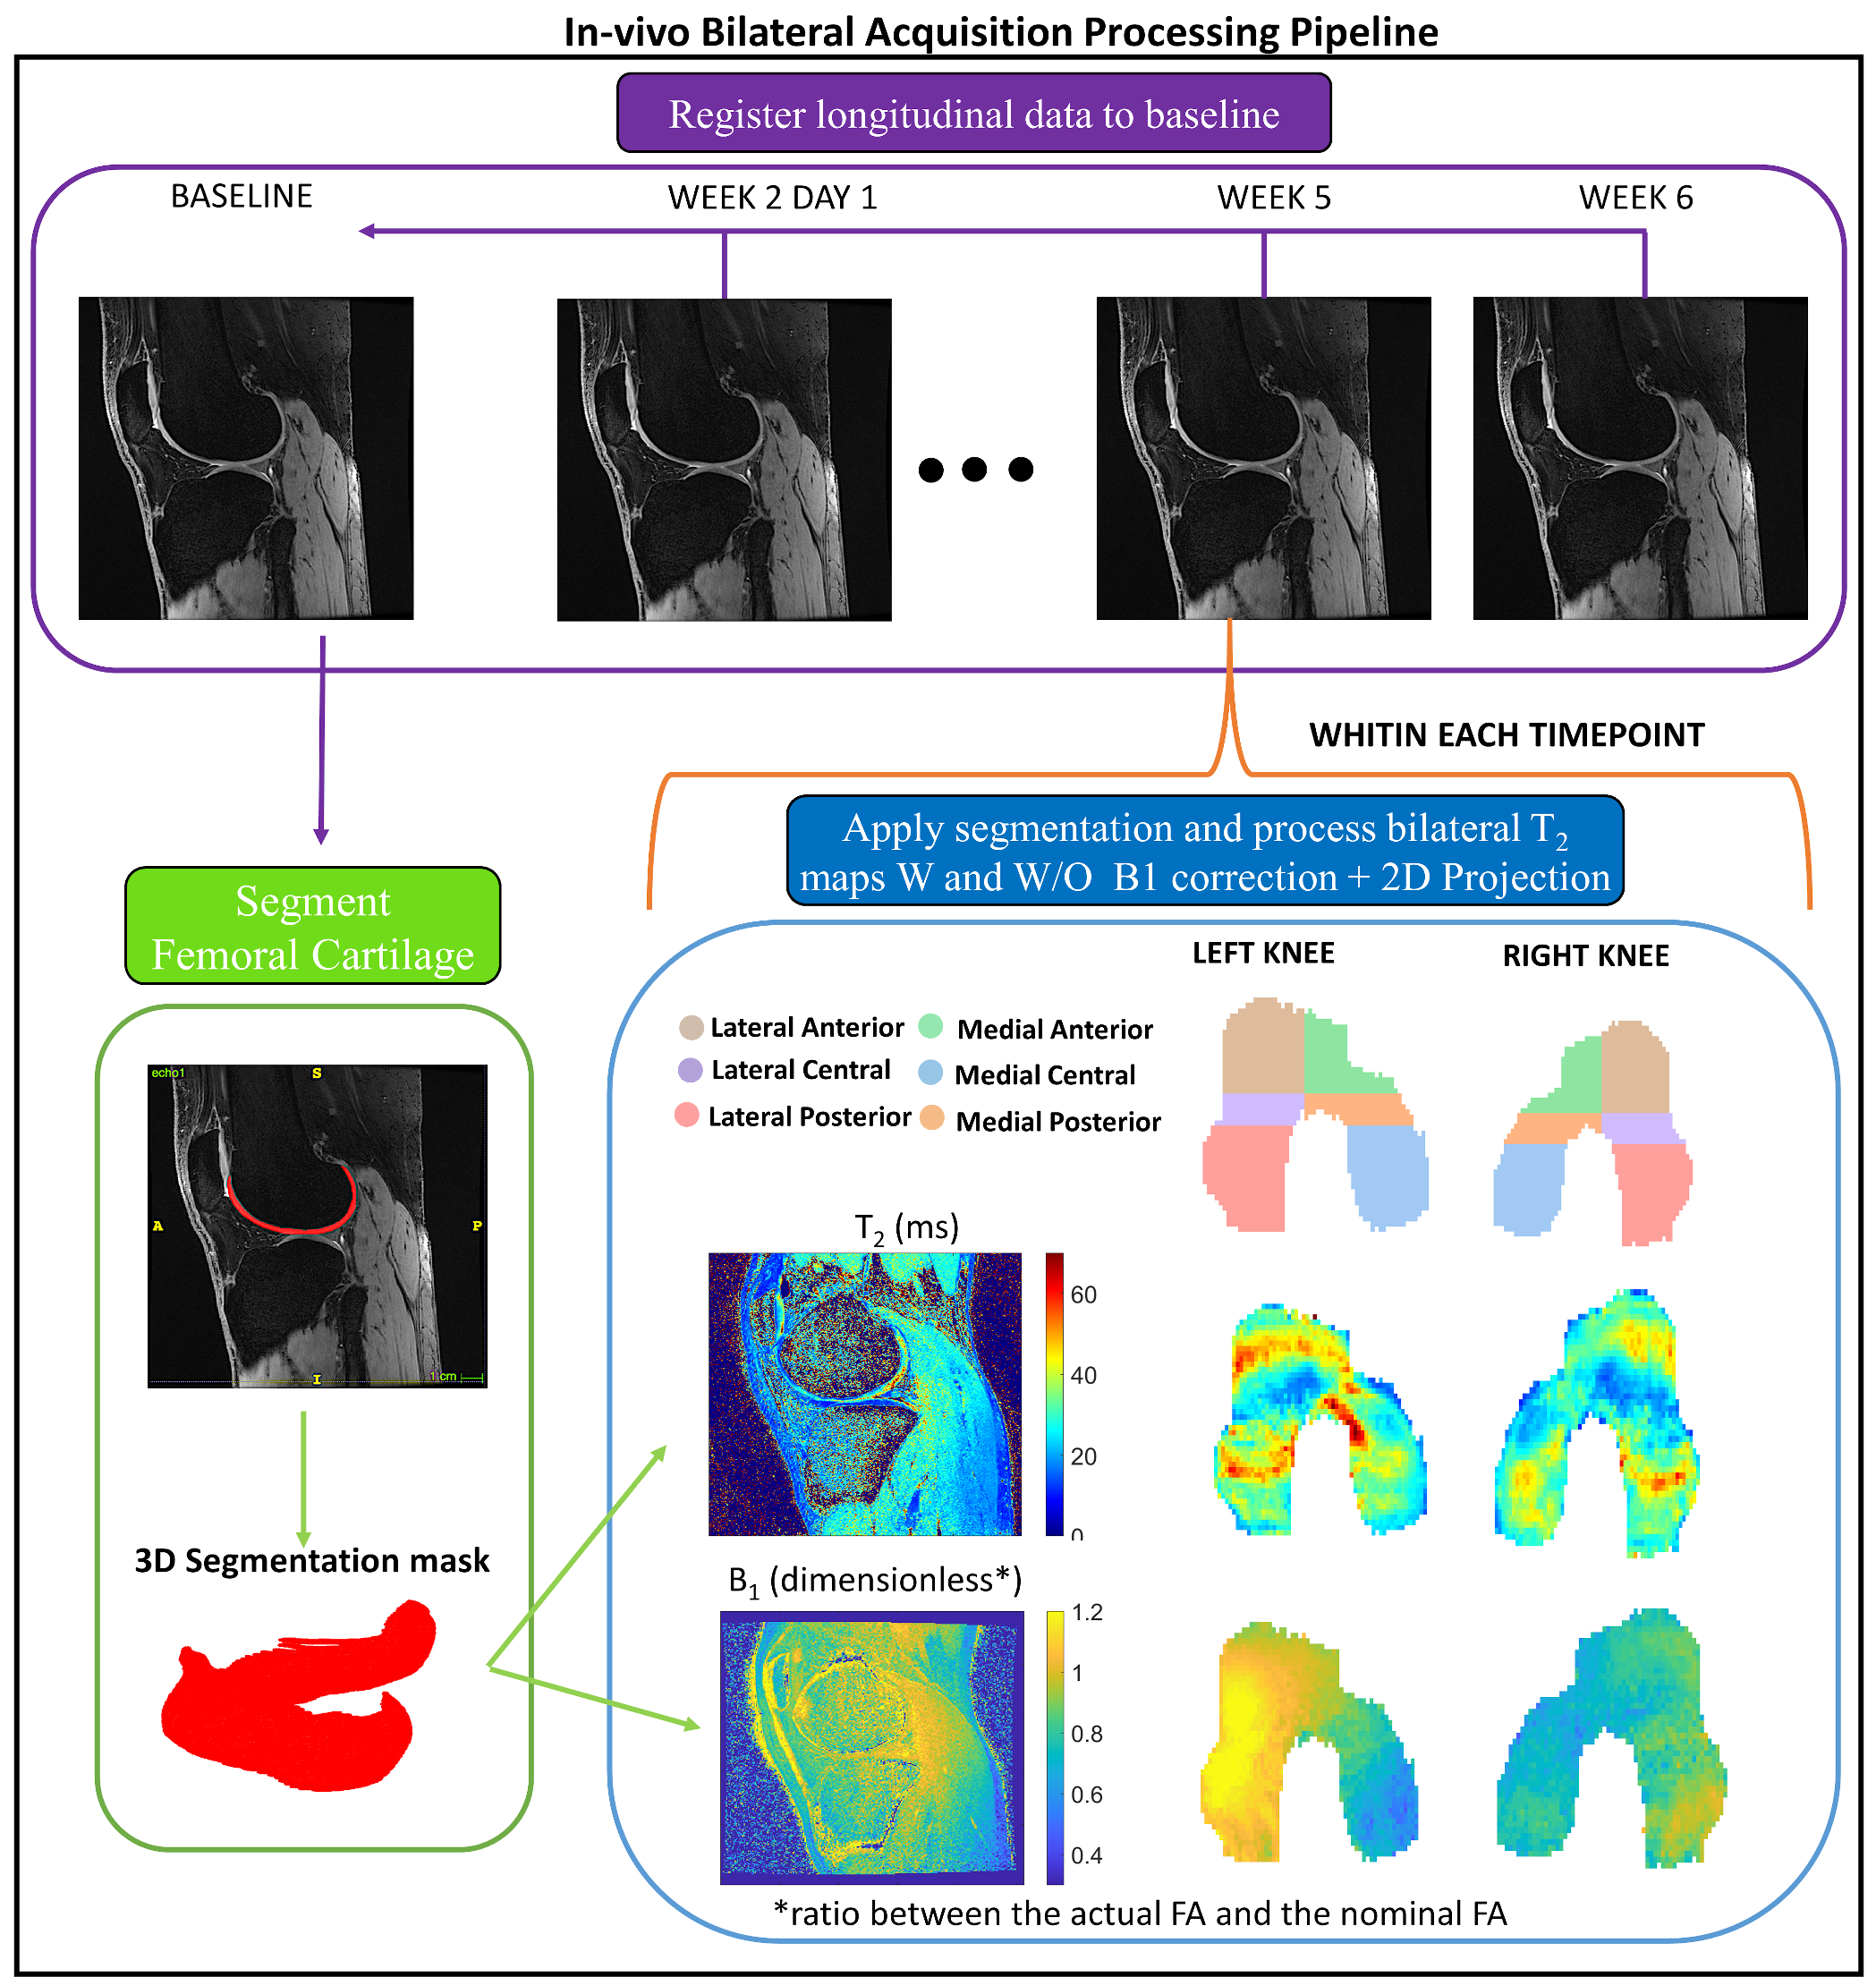
Fig.1:Schematization of
the pipeline used to process the longitudinal in-vivo bilateral acquisitions.
Each time-point was registered to the baseline.
The FC was manually segmented at the baseline time-point. For each time-point,
the open-source DOSMA framework9 was used to compute T2 map
with and without B1 correction and to visualize the 3D
segmented volume projected onto a 2D space2. The FC was
automatically sub-divided into 3 different layers (total, deep and superficial) and 6 sub-regions
(anterior/central/posterior for the medial/lateral sides).