1School of Medicine, Queen's University, Kingston, ON, Canada, 2Center for Neuroscience Studies, Queen's University, Kingston, ON, Canada, 3Orthopedic Surgery, Queen's University, Kingston, ON, Canada, 4Diagnostic Radiology, Queen's University, Kingston, ON, Canada, 5Orthopedic Surgery, McGill University, Montreal, QC, Canada
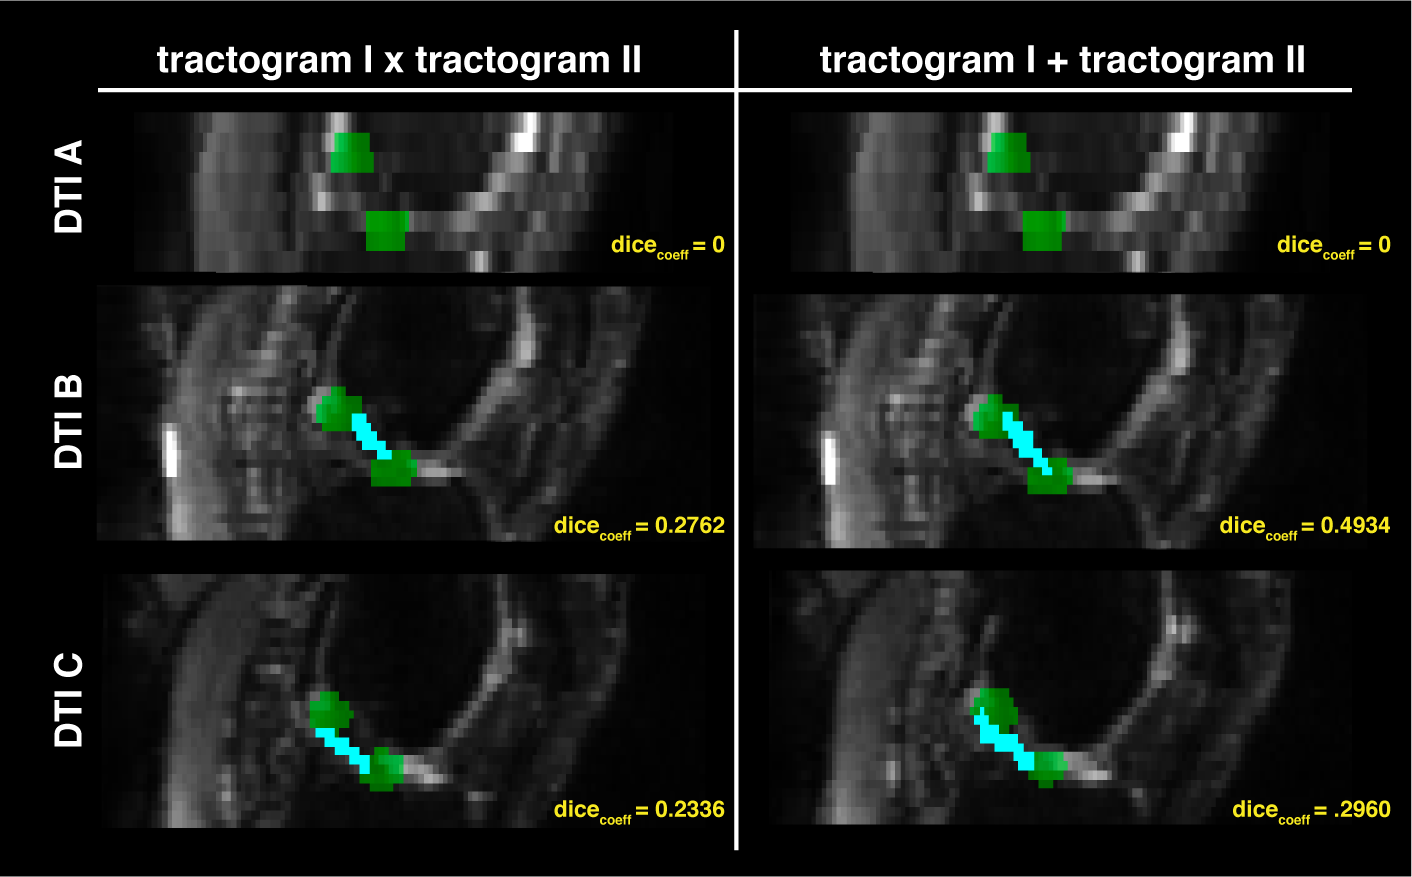
Figure 5. Results from the fiber-based probabilistic tractography and Dice Coefficient analysis
Sagittal slices of the diffusion weighted images (grayscale) are displayed and overlaid with the resampled regions of interest (green, see Figure 2), as well as the reconstructed anterior cruciate ligament (cyan blue), estimated based on fiber-based probabilistic tractography. Both segmentation reconstructions are shown including voxels traversed by the two (left), or either (right), tractograms.
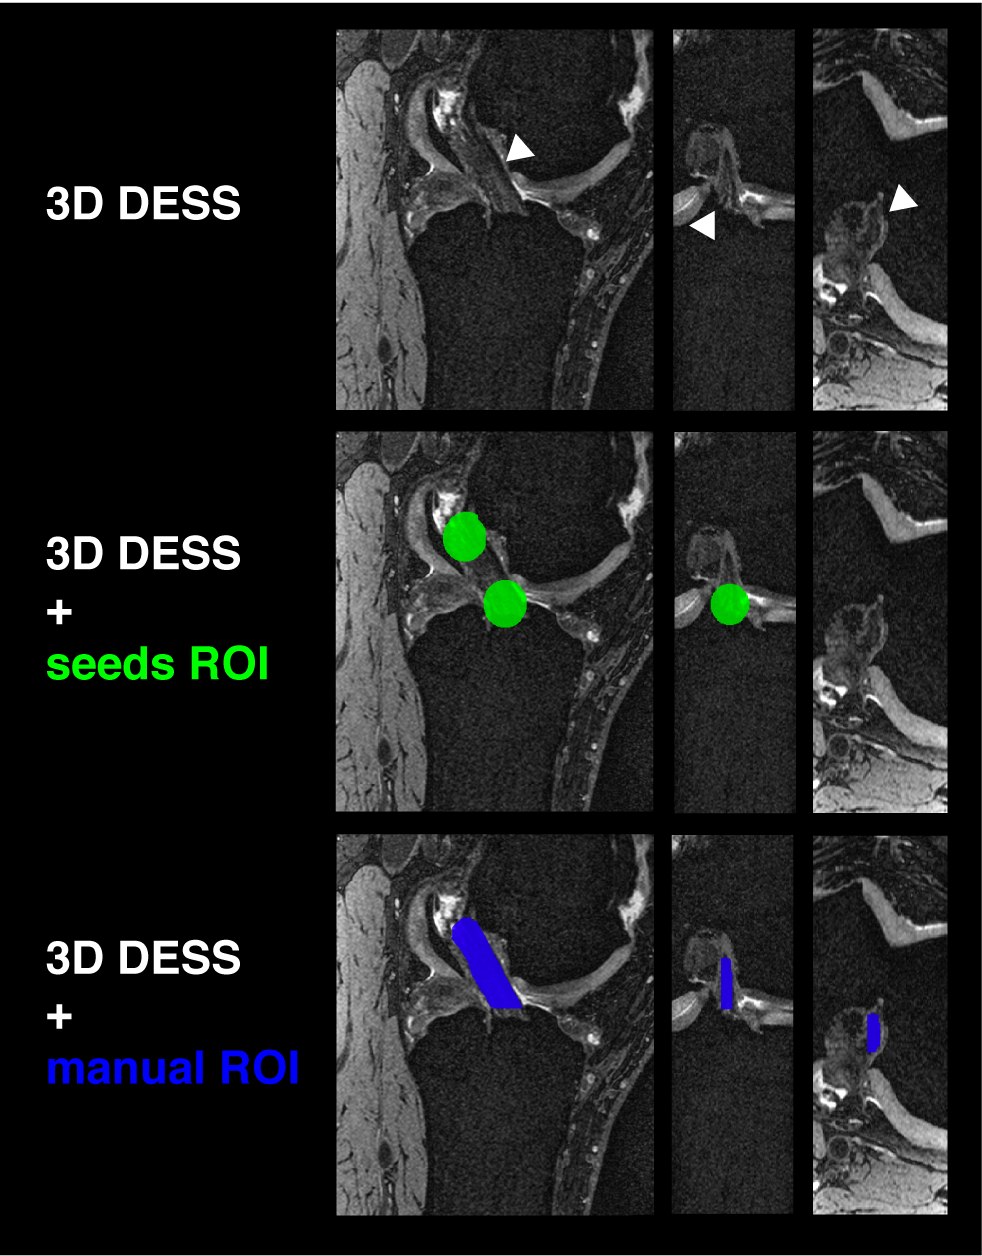
Figure 3. Three-dimensional high resolution structural imaging of the left knee
Three views (sagittal, coronal and axial) of the Double Echo Steady State (DESS) scan are shown highlighting the healthy anterior cruciate ligament (ACL) for this patient (top). The middle and bottom views show the placement of the region of interest seeds within the tibia and femur insertions of the ACL (green), as well as the manual segmentation of the ligament (blue) used for assessment of the tractography outputs.