1School of Biomedical Sciences and Pharmacy, University of Newcastle, Newcastle, Australia, 2School of Health Sciences, University of Newcastle, Newcastle, Australia, 3Hunter Medical Research Institute, Newcastle, Australia, 4Faculty of Health and Medicine, University of Newcastle, Newcastle, Australia, 5University of Newcastle, Newcastle, Australia
Using Magnetic Resonance (MR) data acquired as part of a feasibility study in stroke rehabilitation, a novel post-processing pipeline was designed and implemented to explore metabolic factors with MR Spectroscopy (MRS).
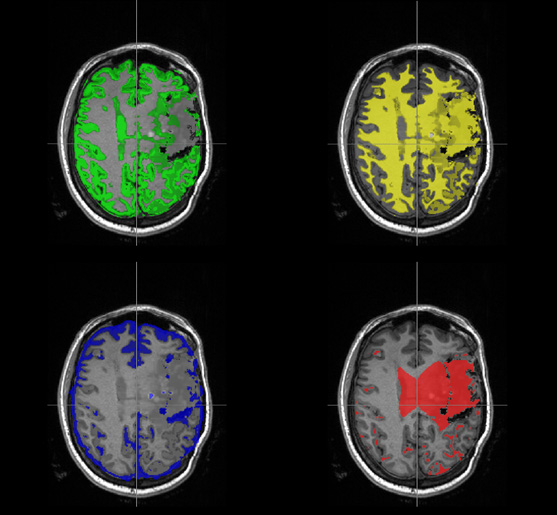
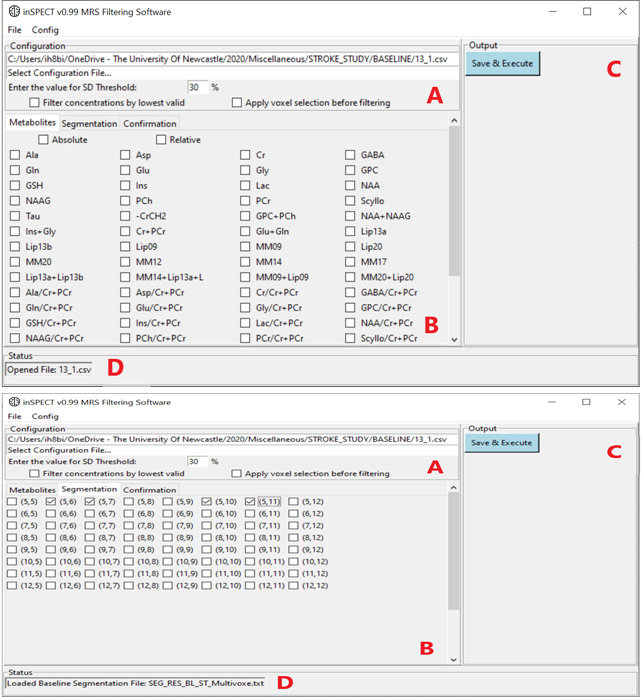
Figure 1i: inSPECT GUI displaying list of selectable metabolites (B), the configuration panel (A) Cramer-Rao lower bounds SD% threshold. Output panel (C) contains the button to execute processing of data, the lower edge (D) is the status bar, indicating a single CSV file has been opened.
Figure 1ii: inSPECT GUI with voxel selection tab active (B) with voxels checked for filtering. (A) is selected file information and checkboxes for inputting the concentration filter method. Panel (C) is the Save & Execute button, panel (D) is current status, a Baseline Segmentation file has been loaded.