Takuya Urushihata1, Hiroyuki Takuwa1, Manami Takahashi1, Yasuhiko Tachibana2, Jeff Kershaw2, Nobuhiro Nitta2, Sayaka Shibata2, Masato Yasui3, Makoto Higuchi1, and Takayuki Obata2
1Department of Functional Brain Imaging Research, National Institute of Radiological Sciences, QST, Chiba, Japan, 2Applied MRI Research, National Institute of Radiological Sciences, QST, Chiba, Japan, 3Keio Advanced Research Center for Water Biology and Medicine, Keio University, Tokyo, Japan
1Department of Functional Brain Imaging Research, National Institute of Radiological Sciences, QST, Chiba, Japan, 2Applied MRI Research, National Institute of Radiological Sciences, QST, Chiba, Japan, 3Keio Advanced Research Center for Water Biology and Medicine, Keio University, Tokyo, Japan
Comparison of aquaporin-4 knockout and wild-type mice using multi-b-value multi-diffusion-time DWI detected different ADCs and water exchange-time for ischemic and healthy tissue.
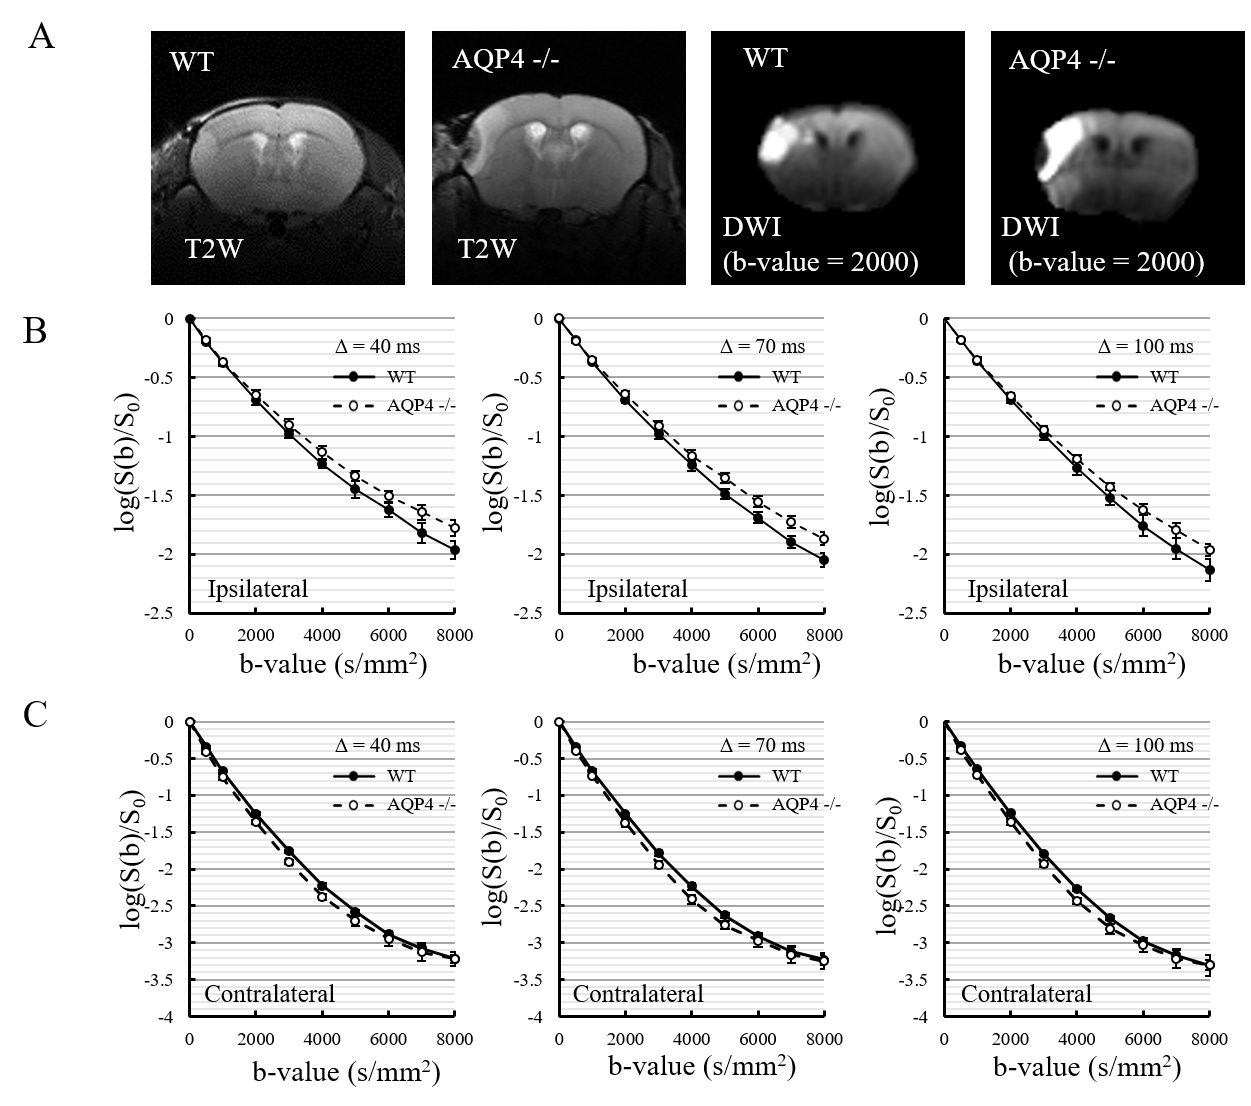
Fig. 1. (A)
Typical T2-weighted (T2W) and diffusion-weighted images (DWI) for wild-type
(WT) and AQP4 knockout (AQP4-KO) mice. The left side of the brain had a middle
cerebral artery occlusion. (B) and (C) Normalized b-value dependent signal
decay for the ipsilateral (B) and contralateral (C) sides at different
diffusion times (Δ = 40, 70 and 100 ms). Solid lines indicate WT mice (closed
circles with SD bars) and broken lines indicate AQP4-KO mice (white circles
with SD bars).
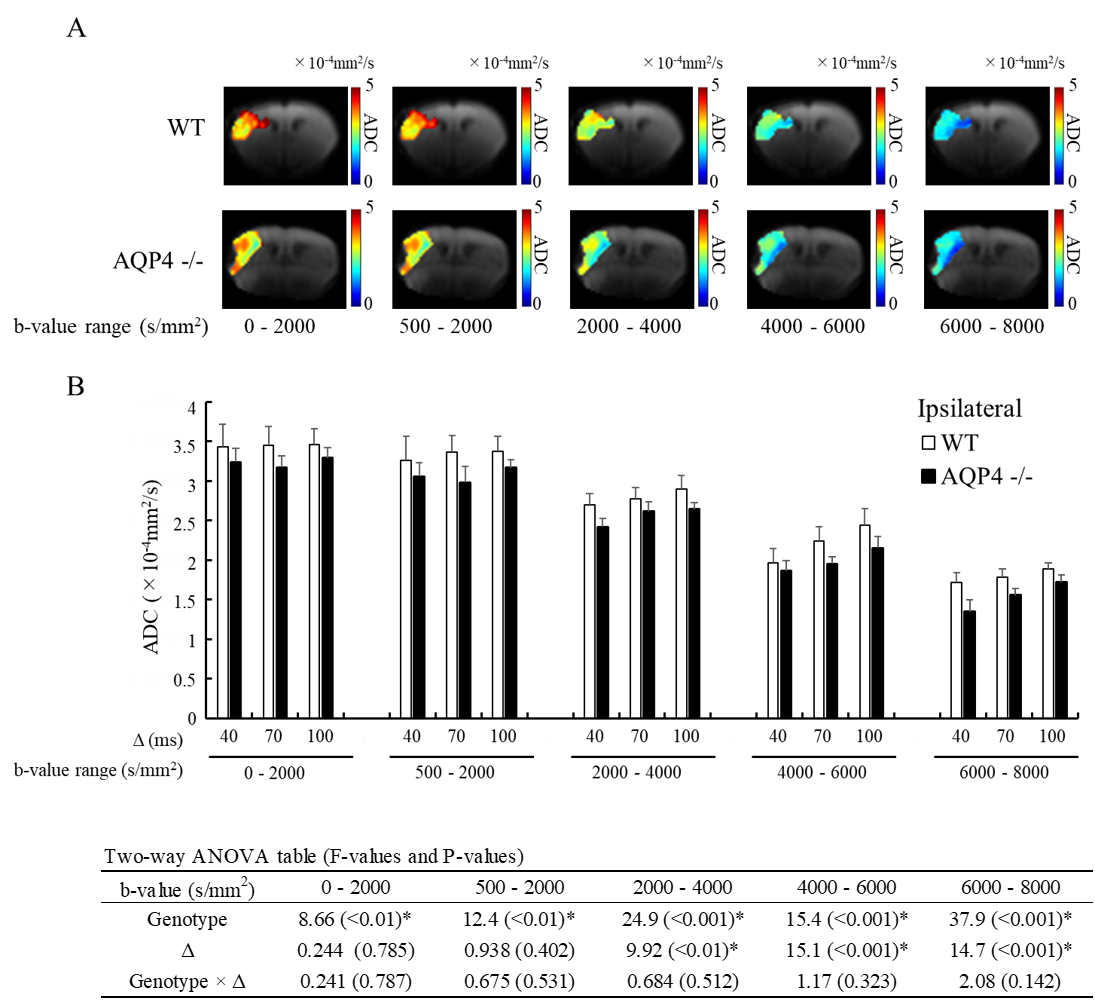
Fig. 3. (A) Typical apparent diffusion coefficient
(ADC) maps of wild-type (WT, top) and AQP4 knockout (AQP4-KO, bottom) mice
focused on the ipsilateral region at Δ =70 ms. The ADC in the ischemic region
has a range of 0 – 5×10⁻⁴ mm2/s. (B) The bar graphs show
the mean ADC of WT (white) and AQP4-KO (black) mice for each b-value range and
Δ. The error bars correspond to the SD over animals. The results of Two-way ANOVA are shown in the
table at the base of the figure.