David C. Hike1,2, Taylor A. Ariko1,2, Frederick A. Bagdasarian1,2, Shannon Helsper1,2, and Samuel Colles Grant1,2
1National High Magnetic Field Laboratory, Florida State University, Tallahassee, FL, United States, 2Chemical & Biomedical Engineering, FAMU-FSU College of Engineering, Tallahassee, FL, United States
1National High Magnetic Field Laboratory, Florida State University, Tallahassee, FL, United States, 2Chemical & Biomedical Engineering, FAMU-FSU College of Engineering, Tallahassee, FL, United States
This
research provides a method for monitoring the progression of stroke recovery
and highlights the continuous degradation that occurs for multiple days after
the stroke event, even after cerebral blood flow is re-established.
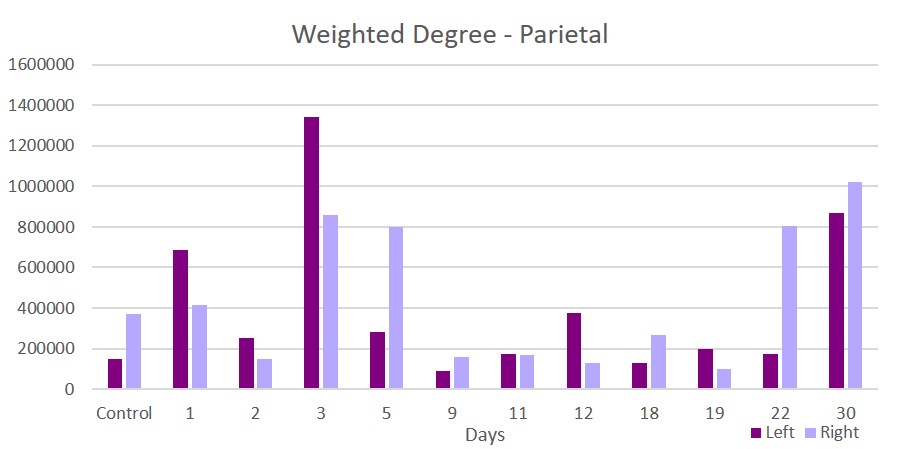
Figure 1: Weighted degree in the parietal region of the
brain over 30
days post ischemic event . No change is seen in the contralateral side 1 day
post stroke; however, effects of edema can be seen on the ipsilateral side.
Weighted degree levels can be seen returning to control levels at day 9 until
spiking at day 30. Contralateral (right) changes at days 3 & 5 can be
attributed to swelling on the ipsilateral (left) side that compresses the contralateral
hemisphere.
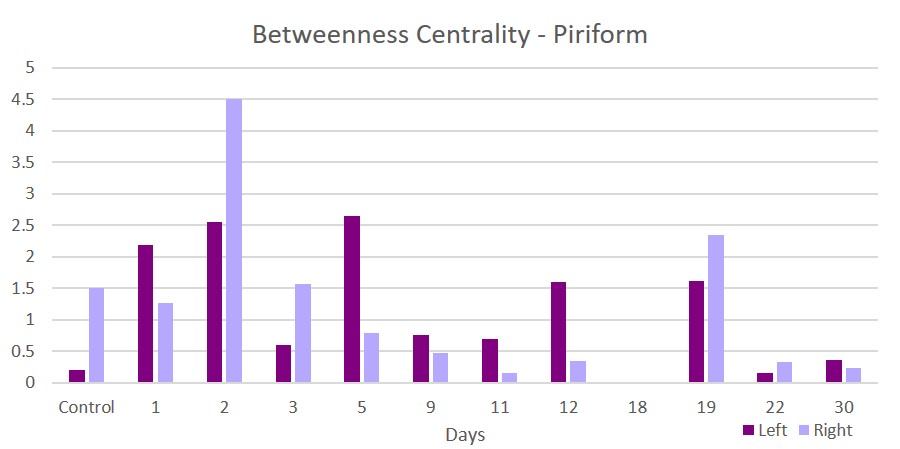
Figure 3: Changes in betweenness centrality in the
piriform region indicate how many times a node acts as a bridge. Immediately
following stroke, the ipsilateral side shows an increase in the number of nodes
acting as a bridge while the contralateral side displays a slight delay. The
contralateral also recovers sooner than the ipsilateral, indicating a
prolonged/delayed restructuring process on that side.