
By Pinar Ozbay
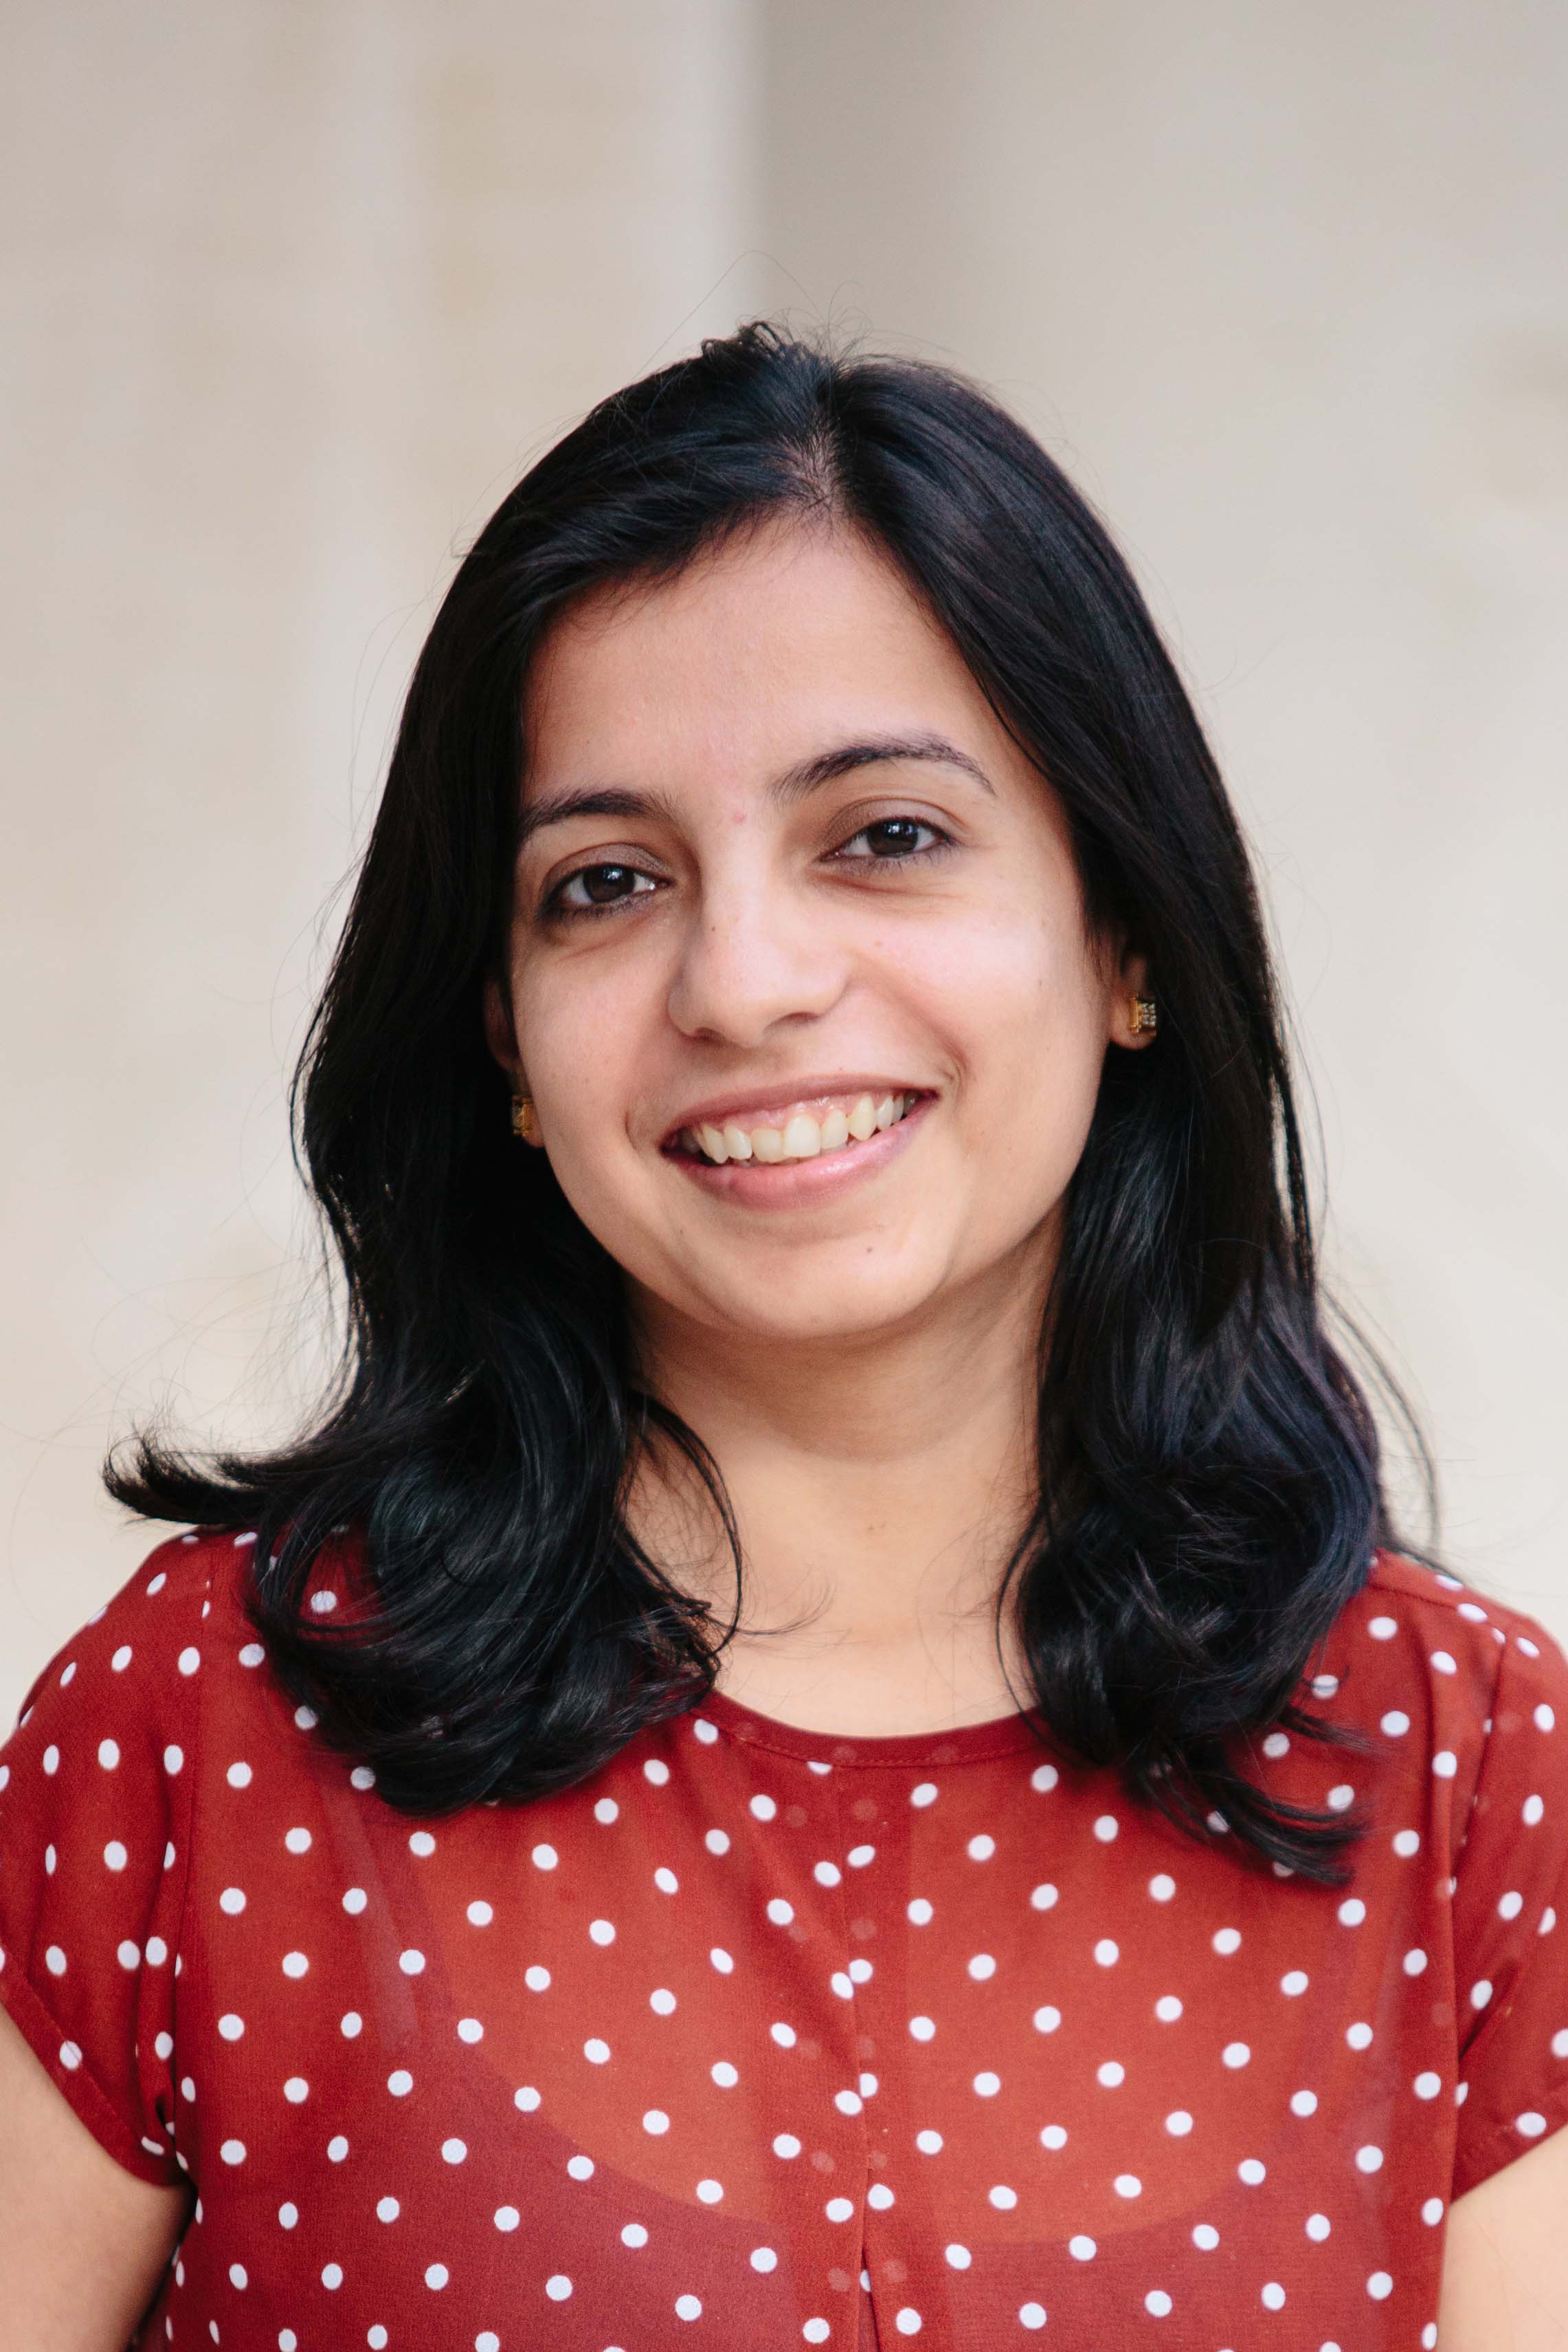
Surabhi Sood
Among the Editor’s picks for May comes a paper from the Center for Advanced Imaging at the University of Queensland, Australia. In their work, entitled ‘Echo Time-Dependent Quantitative Susceptibility Mapping Contains Information on Tissue Properties’, Surabhi Sood and Viktor Vegh used a 3-compartment model to explore the echo time dependence of Quantitative Susceptibility Mapping and how this trend is varying in different regions of the brain. We conducted this Skype interview on a Tuesday evening Eastern time, while Viktor Vegh and Surabhi Sood were having their Wednesday morning coffee.
Pinar: How did you get into the field of MRI?
Surabhi: When I decided to do my MSc, I was browsing through websites, and ran across the Center for Advanced Imaging. Then I had a word with Viktor and found his suggestions very interesting. That’s how I started my MSc and continued with a PhD.
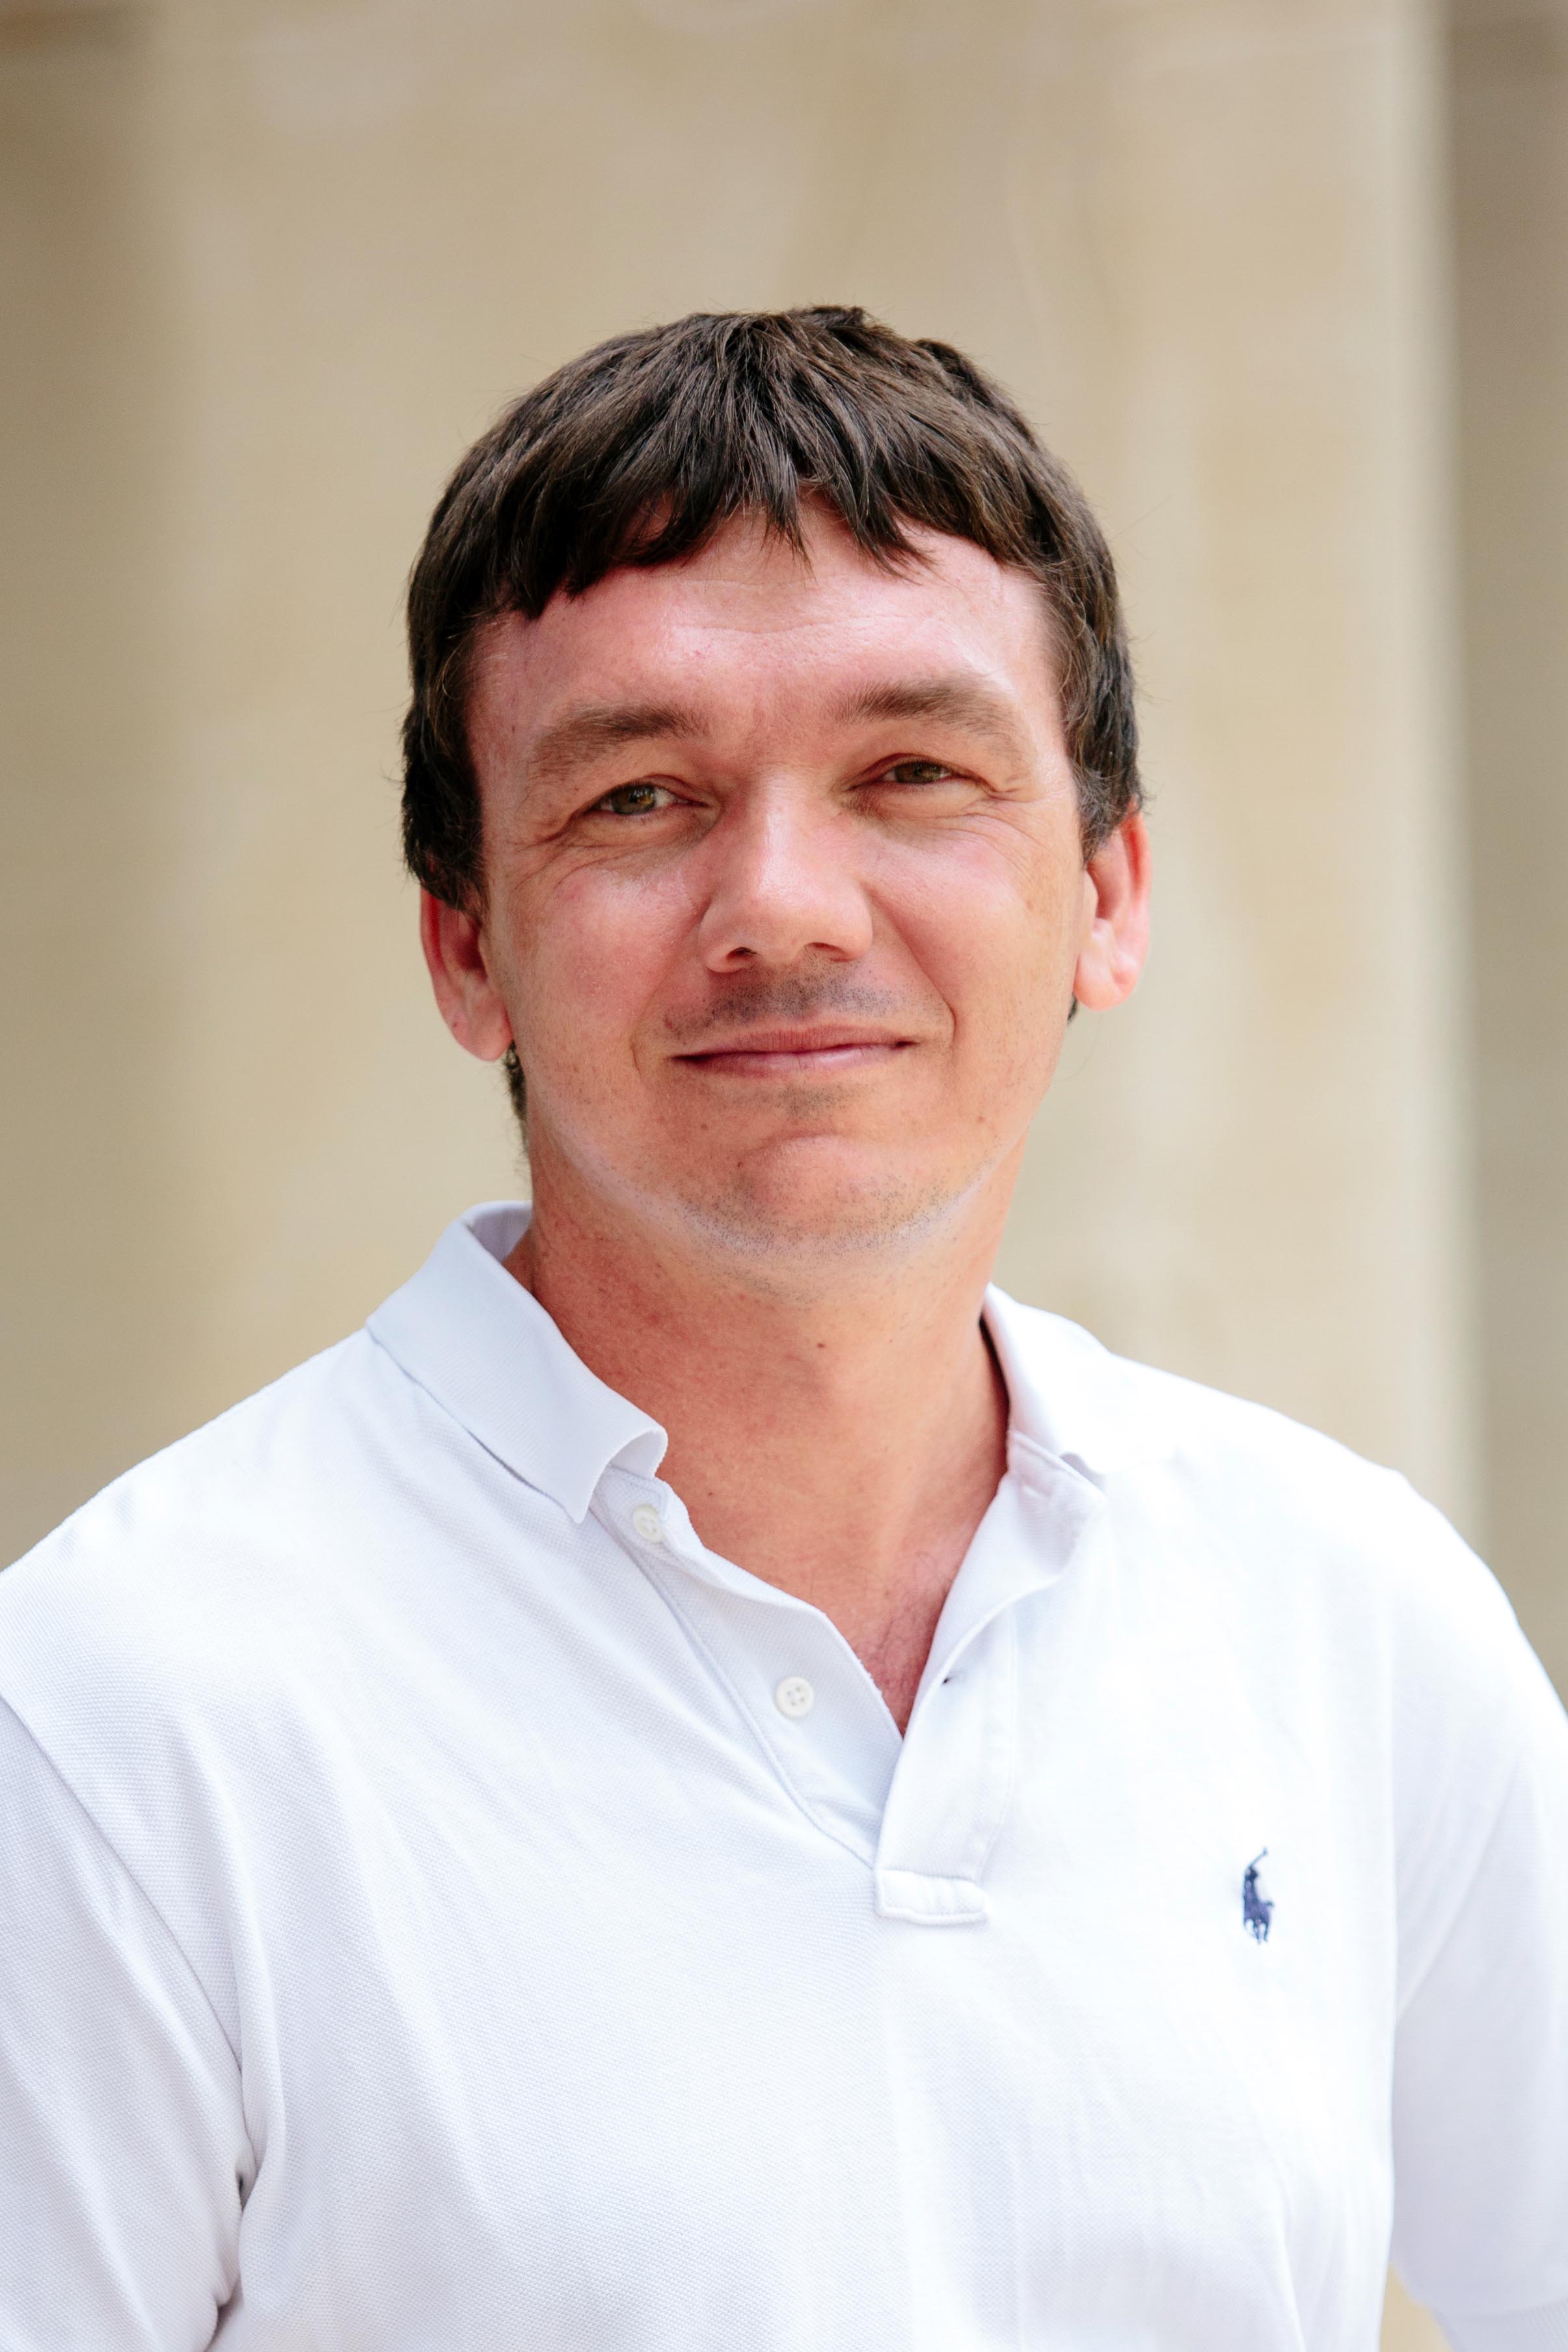
Viktor Vegh
Viktor: Well, my path was not that simple. I did my PhD in applied mathematics in microwave heating. After my PhD I lectured at another university, then I decided to do a postdoc, and looking around my neighborhood I found the Center for Magnetic Resonance, led by David Doddrell. One colleague advised me to give everything up and try this, so I did and started with MR instrumentation.
Pinar: Could you give us some information on QSM, and temporal QSM in particular?
Surabhi: QSM is a post-processing technique which resolves tissue magnetic susceptibility. It is used in neurodegenerative diseases to study iron distribution. With our paper, we introduced temporal QSM, because we observed echo-time dependent changes in susceptibility curves that were specific to different regions.
Viktor: It is not really QSM in the usual sense. QSM should be quantitative, and you would think the results should not depend on how you make the measurement. People have observed echo-time dependence in white matter in terms of frequency shifts, but it was interesting we saw it in general in the brain. We probably should not call it QSM. We are trying to come up with a new name, something like ‘apparent susceptibility’.
Pinar: People would like that, because even in traditional QSM there is a big debate if it is really quantitative or not. Could you briefly summarize your work?
Surhabi: Our main aim was to study susceptibility trends in grey and white matter, and to see how the trend varies between regions. The results were diverse, there were some similar compartments in grey matter structures, and others in white matter.
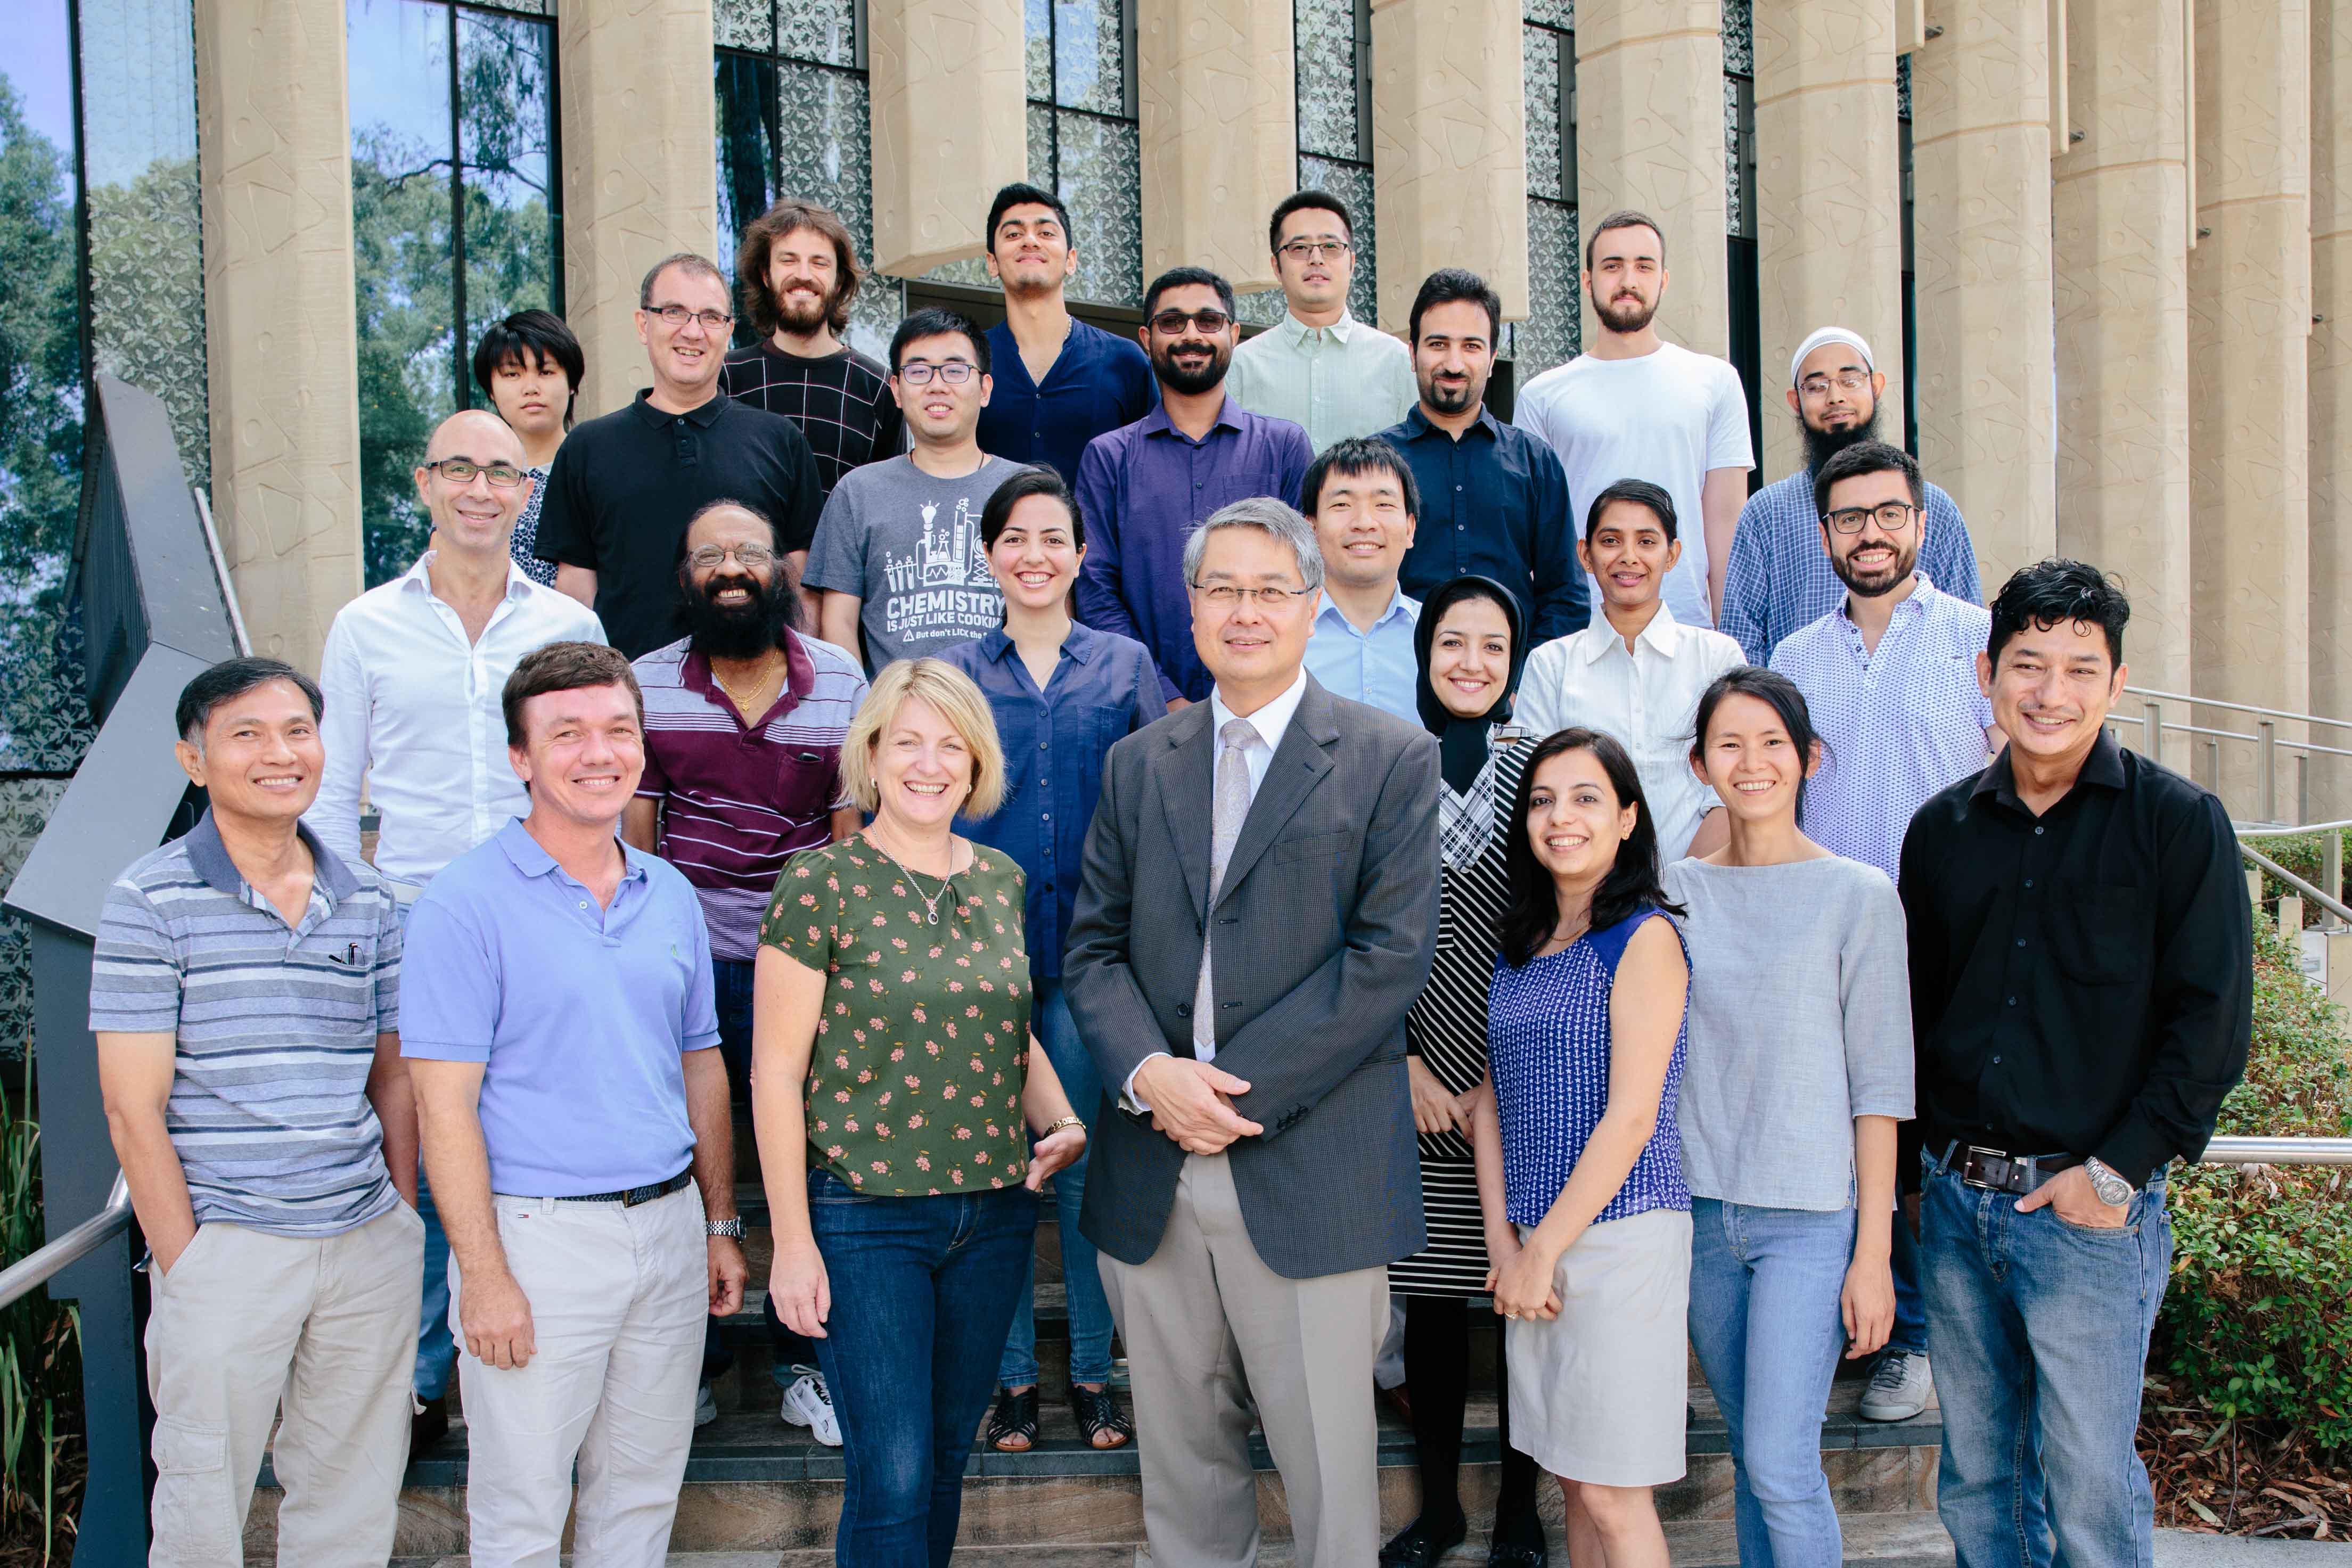
Surabhi Sood (front row, third from the right) and Viktor Vegh (front row, second from the left) with colleagues from the Center for Advanced Imaging in Queensland.
Viktor: We initially wanted to do something completely different and simple. We recognized that increasing TE will increase noise, and with short TE acquisitions we might not have enough phase evolution. We wanted to write a paper about what echo time is best for QSM.
Pinar: So it was more like an optimization you wanted to do?
Viktor: That’s right, but then we started finding temporal trends in the susceptibility curves and they were different in each brain region.
Pinar: Can we say that the modeling part of the paper is added afterwards?
Surabhi: Yes, initially we thought there will be a plateau over the echo time, but then we noticed it is completely different for all brain regions, and thought compartmentalization is a good idea to analyze those trends.
Pinar: This was also my feeling that there were two big points in the paper, and they were merging together. So how did you come up with the model?
Viktor: We basically started using the frequency-shift model commonly used for white matter, and we adapted it to susceptibility imaging. For white matter there is a good justification for 3 compartments and it seems to be accepted by the community, but in grey matter this is not clear yet and we are still working on it.
Pinar: You used the STI Suite toolbox for your pipeline, what was your experience like?
Surabhi: We processed data from each channel individually, and combined them at the end. Viktor has a paper where you can leave out the noisy channels, and reduce the noise in the final maps. For the phase data, we used iHARPERALLA from STI Suite to unwrap and remove the background fields, and iLSQR to calculate susceptibility maps.
Viktor: Our experience was really good with the toolbox, we also used it for a mice study in another work.
Pinar: Do you already have any ideas to improve the model?
Viktor: We would like to know if there is a direct link between tissue properties and the model. In white matter they say there is a specific compartment for myelin, but in fact the signal is not formed in that way, it is formed in the presence of a distribution of fields, which may be local to the voxel, but not local at the microscopic level. The models are compartmentalizing microscopic components, but we are not sure that is the right thing to do. Maybe we should compartmentalize the field effects and interpret those, so there is room for improvement.
Pinar: Do you see QSM in clinics in 5 years? Any advice to the QSM community?
Surabhi: We need to standardize the pipeline first. If at any step noise is introduced, we need to cut it down to make this work efficiently.
Viktor: Studying brain with QSM is very accepted. For us it is more about trying to identify compartments and produce spatially resolved maps across the brain. If we can do that, we can apply this approach to myelin and so on. That is actually our 3 year goal, hopefully we’ll do even better in 5 years.