Presurgical planning of MRgFUS for Essential Tremor (ET) with protocol for high quality DTI
Amritha Nayak1,2, Angela Bissoli3, Okan M Irfanoglu2, Guiseppe Ricciardi3, Elisa Ciceri3, and Carlo Pierpaoli Pierpaoli2
1Henry Jackson Foundation for advancement in Military Medicine Inc, Rockville, MD, United States, 2National Insitutes of Health, Bethesda, MD, United States, 3Azienda Ospedaliera Universitaria Integrata, Verona, Italy
The role of high quality DTI is clearly highlighted in this preliminary evaluation, to more accurately identify the initial target for sonication in MRgFUS presurgical planning.
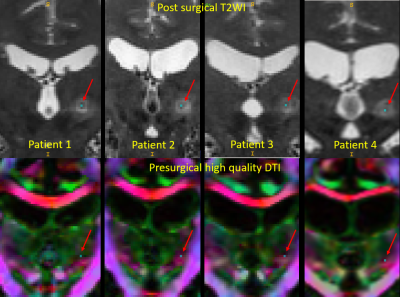
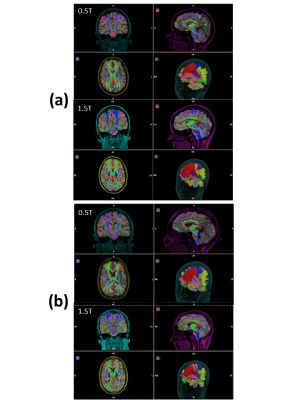
Figure2:
Top row: coronal view of the acute postsurgical T2WI from four patients where
final target has been identified (blue dot), based on the criteria described in
figure1. Bottom row: coronal view of the high quality presurgical DTI and the
corresponding location of the final target, for each patient.
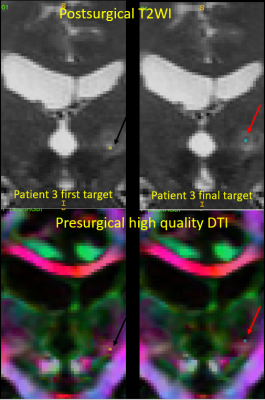
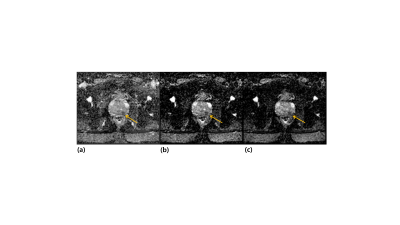
Figure3:
Left column: In patient 3, the location of the first target point of
sonification on postsurgical T2WI and its corresponding location on the high quality
DTI. The sub threshold initial sonication at this site resulted in patient experiencing slight paresthesia. Right column: The final target location selected for surgery based on
the positive functional feedback received from the patient and its corresponding
location on the presurgical high quality DTI.
Abnormal insula white matter tracts in smokers
Chao Wang1, Shuyue Wang1, Peiyu Huang1, and Minming Zhang1
1Department of Radiology, the Second Affiliated Hospital, Zhejiang University School of Medicine, Hangzhou, China
In this study, we found abnormal white matter tracts of insula subregions in smokers.These altered insula microstructural connectivity could interfere with the normal neural circuitry of reward processing, which might be the underlying neurobiology of nicotine addiction.
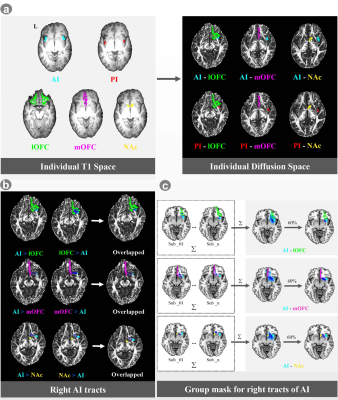
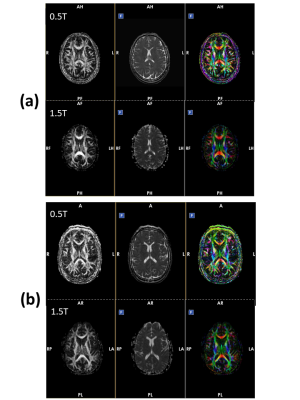
Figure 1. Probabilistic tractography of the AI tracts.
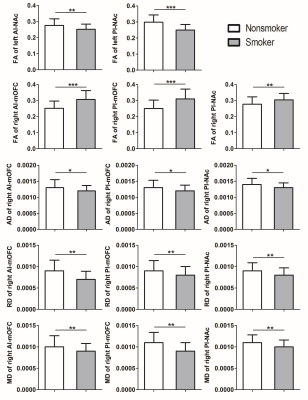
Figure 2. The differences of the diffusion findings of insula tracts between smokers and nonsmokers. Compared with nonsmokers, in the left hemisphere, smokers showed lower FA values of PI-NAc and AI-NAc. In the right hemisphere, smokers showed increased FA values of AI-mOFC, PI-mOFC and PI-NAc; decreased AD values of AI-mOFC, PI-mOFC and PI-NAc; decreased RD values of AI-mOFC, PI-mOFC, and PI-NAc; as well as decreased MD values of AI-mOFC, PI-mOFC, and PI-NAc.
Rich-Club Organizational Changes Over the Course of Motor Recovery after First-Time Acute Stroke
Lu Wang1, Hing-Chiu Chang1, Peng Cao1, and Edward.S Hui1
1Department of Diagnostic Radiology, The University of Hong Kong, Hong Kong, China
Rich-club
organization remerged one month after stroke and high order regions were found
at 6 months when patients functionally recovered, which suggests potential relation between reemergence of rich-club organization and motor recovery.
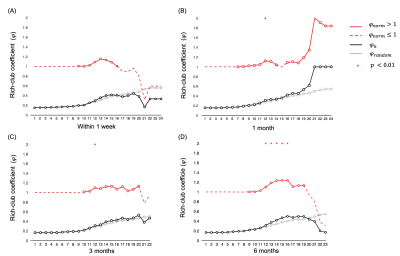
Figure
1. Rich club coefficient of group-averaged structural
brain networks at (A) within 1 week,
and (B) 1, (C) 3 and (D) 6 months after first-time ischemic acute
stroke. * p < 0.01 after FDR correction, indicating a significant rich-club
organization at nodal degree k.
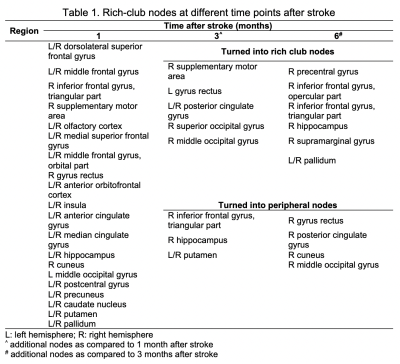
Table
1. Rich-club nodes at different time points after stroke
Tractography based organization of the hyperdirect pathway to the subthalamic area in HCP subjects and parkinsonian patients
Gizem Temiz1, Sophie Sébille1, Chantal François1, Eric Bardinet1, and Carine Karachi1,2
1CENIR, Institut du Cerveau et de la Moelle Epinière, Paris, France, 2AP-HP, Hôpital de la Pitié-Salpêtrière, Department of Neurosurgery, Paris, France, Paris, France
Our aim is to analyze the tractography based sub-parcellisation of subthalamic regions. Motor cluster was located in the posterolateral STN, a limbic cluster located medially in the MSR, and a motor-limbic cluster located in between were observed.
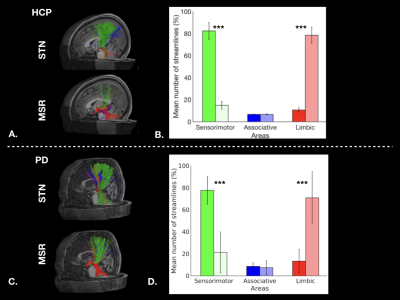
Figure 1: Cortical streamlines for STN and MSR: A. for a HCP subject, and C. for a PD patient. Histograms for HCP dataset (B.) and for PD dataset (D.) showing averaged connectivity of different cortical areas to the STN and MSR. The percentages of mean streamline numbers connecting the different sensorimotor (green), associative (blue) and limbic (red) cortical areas to the STN (dark bars) and to the MSR (bright bars) are shown for the left hemisphere (LH).
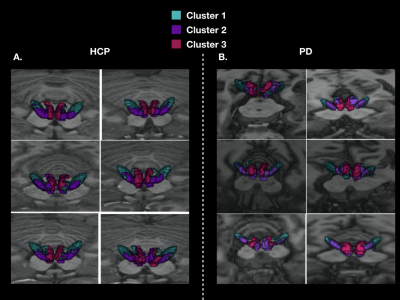
Figure 2: 3D localization of the three cortical clusters in both the STN and MSR in native spaces A. for 6 HCP subjects, and B. for 6 PD patients
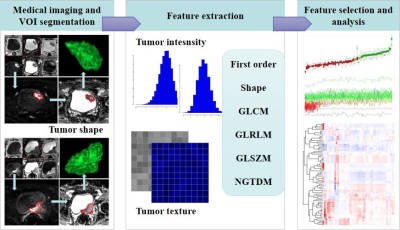
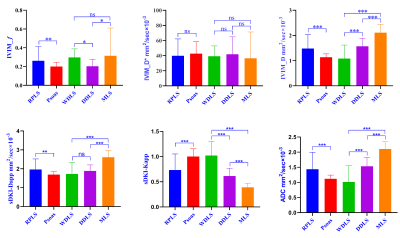
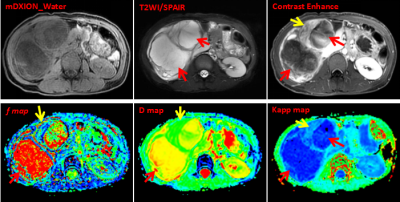
Differentiating Low- and High-Grade Adult glioma Using Multi-diffusion Models
Junqi Xu1, He Wang1,2, Xueying Zhao1, Hui Zhang1, Xiaoyuan Feng3, and Ren Yan3
1Institute of Science and Technology for Brain-Inspired Intelligence, Fudan University, Shanghai, China, 2Human Phenome Institute, Fudan University, Shanghai, China, 3Radiology, Huashan Hospital, Fudan University, Shanghai, China
We
have developed a multi-model of DWI platform for pathological diagnosis. Herein,
FROC, CTRW and DKI performed best among these models in differentiating low-
and high-grade adults brain tumor.
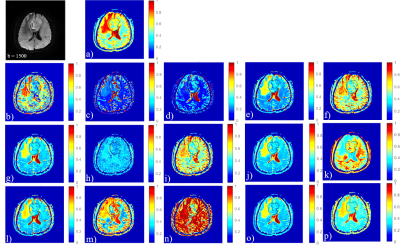
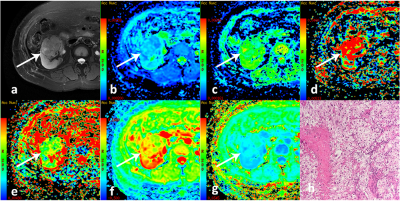
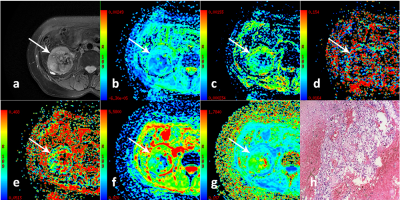
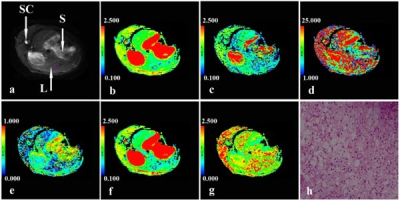
Fig. 1 All models of diffusion MR imaging. This image
shows one patient with high-grade brain tumor, where the first image is DWI at b = 1500s/mm2and from image
a) to p) represents "ADCmap", "Dmap", "Df map", "Dsmap" of IVIM ,"DDCmap","$$$\alpha$$$map" of SEM,"Dmap","$$$\mu$$$map","$$$\beta_f$$$map" of FROC,"Dcmap","$$$\alpha_c$$$map","$$$\beta_c$$$map" of CTRW, "Dk map","Kmap"of DKI and "ADCSmap ” of SM respectively.
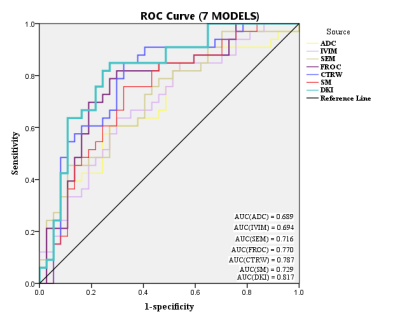
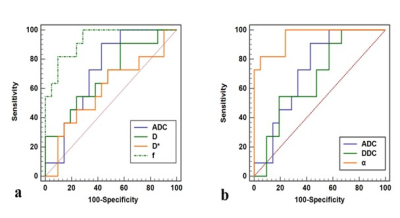
Fig.
2
Jointly parameters in each models and this picture shows ROC analysis of 7
models.
Evaluating advanced multi-shell diffusion MRI microstructural biomarkers of Alzheimer’s disease
Julio Ernesto Villalon Reina1, Talia Miriam Nir2, Sophia Thomopoulos2, Lauren E Salminen3, Neda M Jahanshad2, Rutger Fick4, Matteo Frigo5, Rachid Deriche5, and Paul M Thompson2
1USC Imaging Genetics Center, University of Southern California, Los Angeles, CA, United States, 2USC Stevens Neuroimaging and Informatics Institute, University of Southern California, Marina del Rey, CA, United States, 3USC Imaging Genetics Center, University of Southern California, Marina del Rey, CA, United States, 4Therapanacea, Paris, France, 5Athena Project Team, Inria Sophia-Antipolis Méditerranée, Université Côte d'Azur, Nice, France
We found that DTI diffusivity and MC-SMT measures showed the highest prediction accuracy, but differential anatomical distributions of classifying voxels. MC-SMT may offer greater sensitivity and specificity to MCI as MC-SMT resulted in the highest recall and fewest classifying voxels.
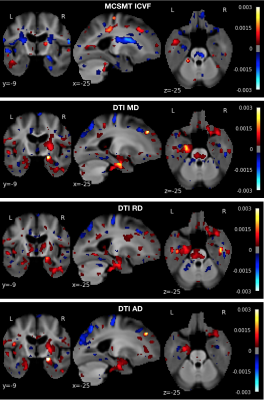
Figure 1. Anatomical distribution of logistic regression voxel-wise weights (i.e., odds) that contribute to correct classification, for the four best classifying dMRI measures.
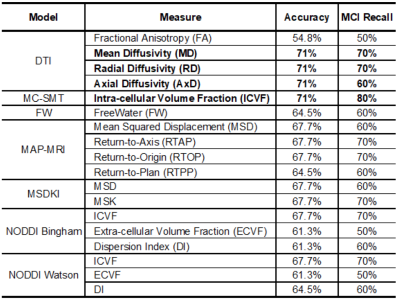
Table 1. Classification accuracy and MCI recall for all tested measures. Recall values are multiples of 10% as there were 10 MCI individuals in the test group. As the training and test group sizes increase, these measures may differ more from one another.
Topological alterations in structural brain connectivity networks are associated with survival after out-of-hospital cardiac arrest
Timo Roine1,2, Oskari Kantonen3, Ulrika Roine1, Sami Virtanen4, Jani Saunavaara4,5, Riitta Parkkola4, Ruut Laitio6, Olli Arola6, Marja Hynninen7, Juha Martola8, Heli M Silvennoinen8, Marjaana Tiainen9, Risto O. Roine10, Harry Scheinin6, and Timo Laitio6
1Department of Neuroscience and Biomedical Engineering, Aalto University School of Science, Espoo, Finland, 2Turku Brain and Mind Center, University of Turku, Turku, Finland, 3Turku PET Centre, University of Turku and the Hospital District of Southwest Finland, Turku, Finland, 4Department of Radiology, Turku University Hospital, University of Turku, Turku, Finland, 5Department of Medical Physics, Turku University Hospital, University of Turku, Turku, Finland, 6Division of Perioperative Services, Intensive Care and Pain Medicine, Turku University Hospital, University of Turku, Turku, Finland, 7Division of Intensive Care Medicine, University of Helsinki and Helsinki University Hospital, Helsinki, Finland, 8Department of Radiology, University of Helsinki and Helsinki University Hospital, Helsinki, Finland, 9Department of Neurology, University of Helsinki and Helsinki University Hospital, Helsinki, Finland, 10Division of Clinical Neurosciences, Turku University Hospital, University of Turku, Turku, Finland
We investigated structural brain connectivity networks after
out-of-hospital cardiac arrest to detect differences related to survival. We
found that decreased strength and efficiency were both globally and locally related
to increased mortality at 6 months.
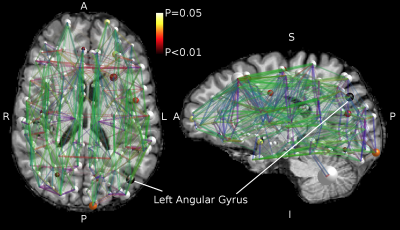
Figure
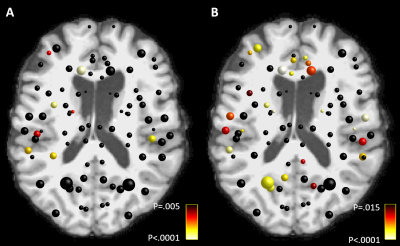
2. Local decreases in A) strength and B) local
efficiency of the structural brain connectivity networks in patients who did
not survive after OHCA compared to the survivors. The color of the node
indicates the statistical significance of the results. The results were adjusted for false discovery rate (FDR) with a
significance threshold 0.05. Age, gender, and imaging site were used as
covariates in the statistical model.
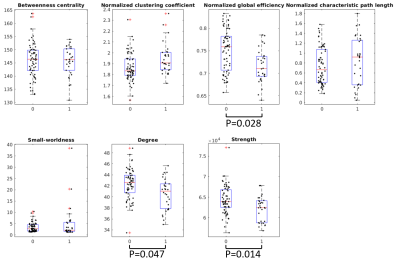
Figure 1. Global structural
brain connectivity network differences between the survivors (group 0) and
those who did not survive (group 1) after OHCA. The P-values were adjusted for
false discovery rate (FDR). Age, gender, and imaging site were used as
covariates in the statistical model.
Diffusion MRI reveals macro- and microstructural changes in cosmonauts' brains after long-duration spaceflight
Steven Jillings1, Angelique Van Ombergen2, Elena Tomilovskaya3, Alena Rumshiskaya4, Liudmila Litvinova4, Inna Nosikova3, Ekaterina Pechenkova5, Ilya Rukavishnikov3, Inessa Kozlovskaya3, Stefan Sunaert6, Paul M Parizel7, Valentin Sinitsyn8, Victor Petrovichev4, Steven Laureys9, Peter zu Eulenburg10, Jan Sijbers11, Floris Wuyts1, and Ben Jeurissen11
1Lab for Equilibrium Investigations and Aerospace, Dept. of Physics, University of Antwerp, Antwerp, Belgium, 2Translations Neuroscience, Dept. of Medicine, University of Antwerp, Antwerp, Belgium, 3Institute of Biomedical Problems, Russian Academy of Sciences, Moscow, Russian Federation, 4Dept. of Radiology, Federal Center of Treatment and Rehabilitation, Moscow, Russian Federation, 5Laboratory for Cognitive Research, National Research University Higher School of Economics, Moscow, Russian Federation, 6Dept. of Imaging and Pathology, KU Leuven, Leuven, Belgium, 7Dept. of Radiology, Royal Perth Hospital and University of Western Australia, Perth, Australia, 8Faculty of Fundamental Medicine, Lomonosov Moscow State University, Moscow, Russian Federation, 9Coma Science Group, Dept. of Neurology, University (Hospital) of Liège, Liège, Belgium, 10German Center for Vertigo and Balance Disorders, Dept. of Neurology, Ludwig-Maximilians-University Munich, Munich, Germany, 11imec - Vision Lab, Dept. of Physics, University of Antwerp, Antwerp, Belgium
Spaceflight causes a redistribution of CSF and concomitant GM density changes. As opposed to earlier findings, we can strongly conclude that the GM changes are morphological and do not point to atrophy. The net amount of GM and WM increased in sensorimotor areas, indicating neuroplasticity.
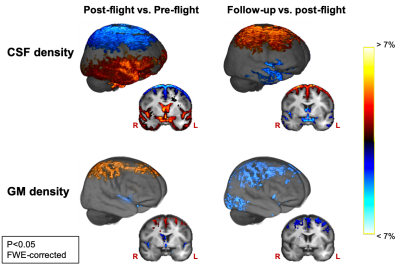
Fig 2: CSF and GM density change in the opposite direction at the superior frontal and parietal part of the cerebrum, and along the ventricles and the Sylvian fissure between pre-flight and post-flight. These changes are then largely reversed seven months after spaceflight as revealed by the comparison of follow-up to post-flight. Results are scaled by effect size and are overlayed onto the group template image.
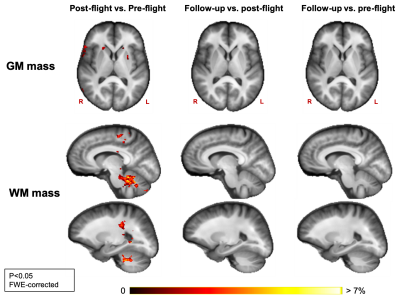
Fig 1: GM mass increases from pre- to post-flight are found in the basal ganglia. WM mass increased from pre- to post-flight in the cerebellum, in a part of the corticospinal tract and in the pre- and postcentral gyri. No significant decreases in GM or WM tissue mass were found between pre- and post-flight. No significant changes were observed between post-flight and follow-up, and between pre-flight and follow-up. Results are scaled by effect size and are overlayed onto the group template image.
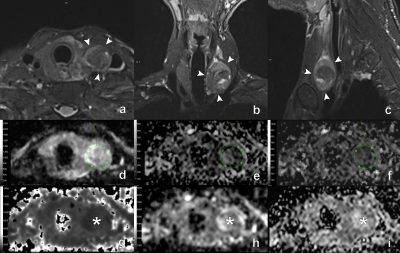
High-resolution Distortion-free DWI of Pituitary Adenomas and Rathke Cleft Cysts Using Point-spread-function Encoded EPI
Jieying Zhang1, Chunjie Guo2, Xinrui Liu3, Yishi Wang1,4, Huimao Zhang2, and Hua Guo1
1Center for Biomedical Imaging Research, Department of Biomedical Engineering, School of Medicine, Tsinghua University, Beijing, China, 2Department of Radiology, the First Hospital of Jilin University, Changchun, China, 3Department of Neurosurgery, the First Hospital of Jilin University, Changchun, China, 4Philips Healthcare, Beijing, China
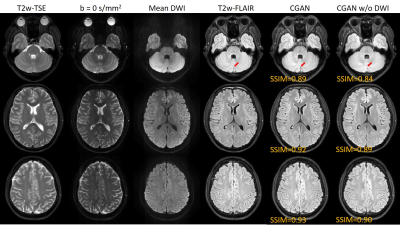
PSF-EPI can
achieve high-resolution distortion-free DWI in the pituitary, in which two
kinds of lesions show different features. PSE-EPI may help with the preoperative
differentiation of pituitary lesions without contrast agent.
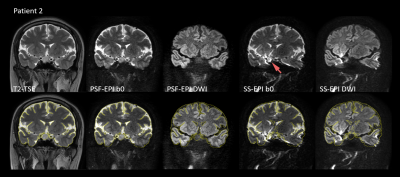
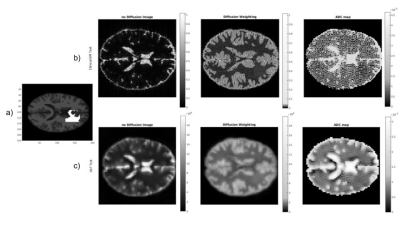
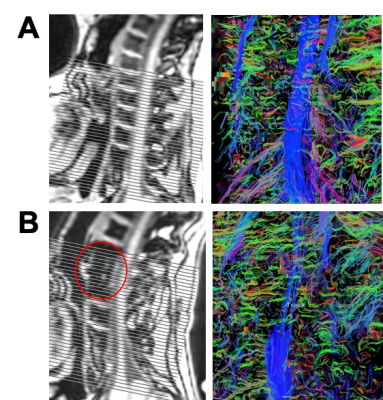
Figure 1: Images
of patient 2 (female, 41-year-old) with an RCC in coronal view.
The
upper row shows the images of T2-TSE, non-DW PSF-EPI, mean DW PSF-EPI, non-DW
SS-EPI and mean DW SS-EPI from left to right.
In
PSF-EPI, resolution = 1 x 1 x 2 mm3 and b-value = 800 mm/s2 were used.
The
bottom row shows the same images as those of upper but overlaid with the edges
extracted from T2-TSE.
Image
distortion and signal piling up exist in SS-EPI (red arrow).
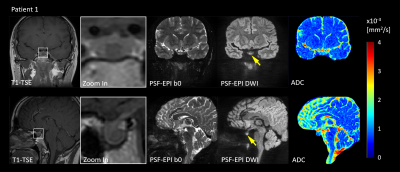
Figure 2: Images
of patient 1 (female, 36-year-old) with microadenomas (8.3 mm) in coronal
(upper) and sagittal view (bottom).
From
left to Right: T1-TSE, zoom-in T1-TSE, non-DW PSF-EPI, mean DWI(1 x 1 x 2 mm3, b=800 mm/s2) and ADC maps.
The
lesion shows hypointense in T1-TSE and hyperintense in distortion-free DWI
(yellow arrows).
Can mapping cortical diffusivity provide unique microstructural insight into aging?
Graham A. D. Archibald1, Jordan A. Chad1,2, David H. Salat3,4, and J. Jean Chen1,2
1Rotman Research Institute, Baycrest Health Sciences, Toronto, ON, Canada, 2Department of Medical Biophysics, University of Toronto, Toronto, ON, Canada, 3MGH/HST Athinoula A. Martinos Center for Biomedical Imaging, Massachusetts General Hospital, Harvard Medical School, Charlestown, MA, United States, 4Neuroimaging Research for Veterans Center, VA Boston Healthcare System, Boston, MA, United States
Mean diffusivity (MD), derived from diffusion MRI, serves as a more sensitive measure of aging than thickness across the cortex. MD shows distinct effects than thickness, suggesting that MD provides insight into microscopic degeneration that cannot be detected with macroscopic MRI measures.
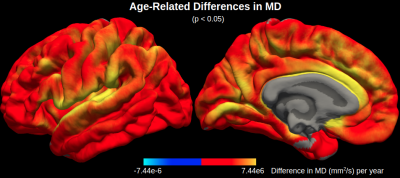
Figure 1. Age-related differences in mean diffusivity (MD). MD is significantly correlated with age across the cerebral cortex, particularly in the cingulate, insular and superior temporal cortices.
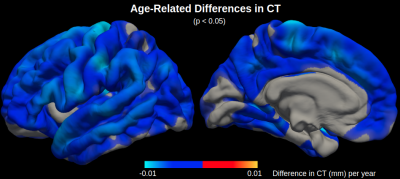
Figure 2. Age-related differences in cortical thickness (CT). CT is significantly correlated with age across the cerebral cortex, particularly in the motor cortex, although there are less significant regions with age-related differences in CT than there are in MD.
Hemodialysis can contribute to acute changes in cerebral volume and white matter structure
Madeleine T Dacey1,2,3, Stefan E Poirier1,3, Janice Gomes2,4, Udunna C Anazodo1,3, and Christopher W McIntyre1,2
1Medical Biophysics, Western University, London, ON, Canada, 2Kidney Clinical Research Unit, Lawson Health Sciences Center, London, ON, Canada, 3Imaging, Lawson Health Research Insitute, London, ON, Canada, 4Pathology and Laboratory Medicine, Western University, London, ON, Canada
Cognitive impairment and white matter degeneration are common in hemodialysis (HD) patients. To identify the acute effects of HD on the brain, we used a novel system to perform MRI scans during HD. The results indicate ischemia and osmotic imbalances cause acute brain injury.

White and grey matter volume increase significantly at peak stress during hemodialysis while cerebrospinal fluid volume decreases (p<0.05). These changes are consistent with brain swelling and indicate ionic edema.
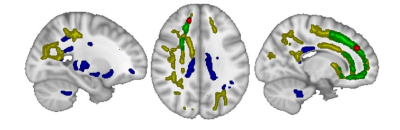
The colored regions show where each diffusion metric increased significantly (P<0.05) at peak stress during hemodialysis. The blue and yellow regions correspond to fractional anisotropy and axial diffusivity, respectively, and indicate cytotoxic edema. The green and red regions correspond to mean diffusivity. Radial diffusivity is shown in red.
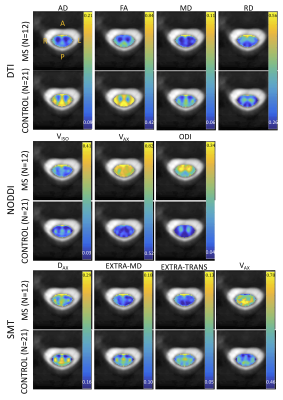
Clinical monitoring of axonal loss in multiple sclerosis using advanced diffusion MRI
Scott Kolbe1, Meaghan Clough1, Frederique Boonstra1, Myrte Strik2, Anneke van der Walt1, Helmut Butzkueven1, Owen White1, Joanne Fielding1, and Meng Law1
1Monash University, Prahran, Australia, 2University of Melbourne, Parkville, Australia
Axonal fibre density measured from clinically acquired diffusion weighted imaging data is seven times more sensitive to longitudinal change compared to brain atrophy.
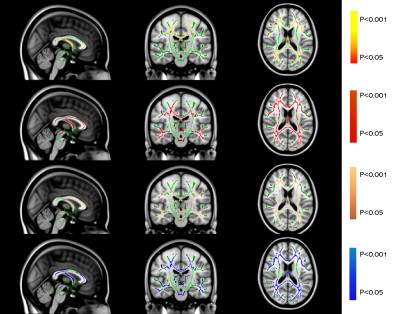
Figure 1. Top row: Template fibre map showing regions included in analysis. Bottom row: Regions of significant correlation (FWE-corrected p<0.05) between fibre density and brain parenchymal fraction at baseline.
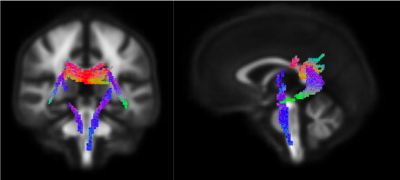
Figure 2. Regions showing significant longitudinal decline in fibre density over time in patients (FWE-corrected p<0.05).
White matter fiber density and cross-section alterations in neuropathic pain after spinal cord injury
Shana Black1,2, Andrew Janson1,2, and Christopher R Butson1,2,3
1Biomedical Engineering, University of Utah, Salt Lake City, UT, United States, 2Scientific Computing and Imaging Institute, University of Utah, Salt Lake City, UT, United States, 3Neurology, Neurosurgery, and Psychiatry, University of Utah, Salt Lake City, UT, United States
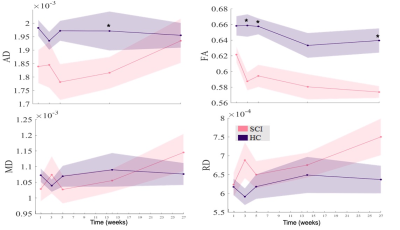
Statistically significant (FWE-corrected p<0.1)
increases in FC and FDC are evident in a commissural pathway including the
splenium and regions of the retrosplenial complex in SCI subjects with chronic
neuropathic pain when compared to SCI subjects without any pain symptoms.
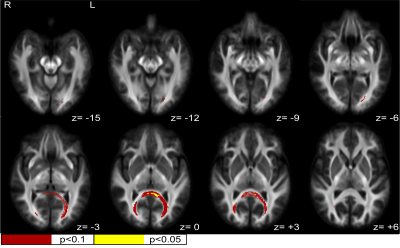
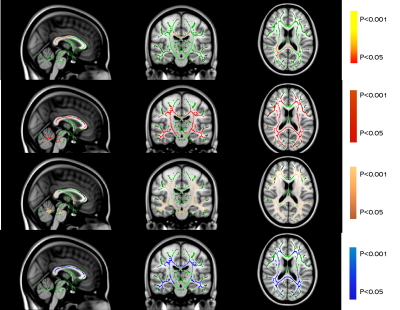
Figure 1. White matter fiber cross-section (FC) increases in neuropathic pain. Statistically significant (FWE-corrected) FC increases in SCI subjects with neuropathic pain compared to healthy SCI controls were seen in the posterior splenium of the corpus callosum/retrosplenial complex region. Z values are relative to the AC/PC plane.
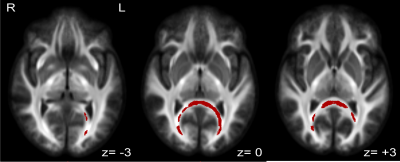
Figure 2. White matter fiber density and cross-section (FDC) increases in neuropathic pain. Statistically significant (FWE-corrected p<0.1) FDC increases in SCI subjects with neuropathic pain compared to healthy SCI controls were seen in the posterior splenium of the corpus callosum/ retrosplenial complex region. Z values are relative to the AC/PC plane.
Brain white matter abnormalities and correlation with severity in amyotrophic lateral sclerosis: An atlas-based diffusion tensor imaging study
XiaoQiang Du1, YunJing Xue1, HuaJun Chen1, and ZhongShuai Zhang2
1Fujian Medical University Union Hospital, Fuzhou, China, 2SIEMENS Healthcare, Shanghai, China
We found WM abnormalities extending from
the motor to the extra-motor regions in ALS and observed a correlation between
distinct diffusion metrics and various clinical variables. In addition, LDH
generated the information that could complement conventional DTI metrics.
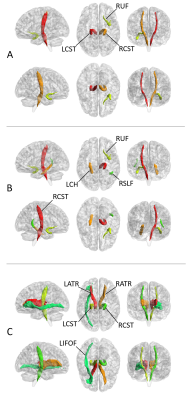
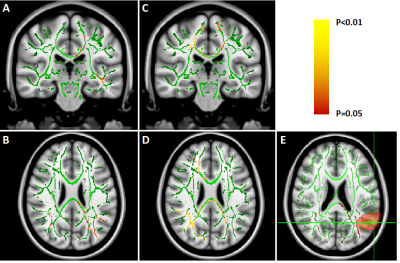
Fig. 2. The white matter (WM) tracts with
significant between-group differences in FA (A), MD (B) and LDH (C),
respectively. “R” and “L” indicate right and left side, respectively. RUF,
right uncinate fasciculus; RCST, right corticospinal tract; LCST, left
corticospinal tract; LCH, left cingulum hippocampus; RSLF, right superior
longitudinal fasciculus (temporal part); LATR, left anterior thalamic radiation;
RATR, right anterior thalamic radiation; LIFOF, left inferior frontal-occipital
fasciculus. These tracts were defined by the JHU ICBMDTI-81 white matter atlas.
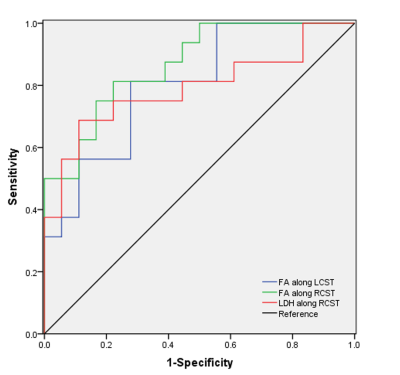
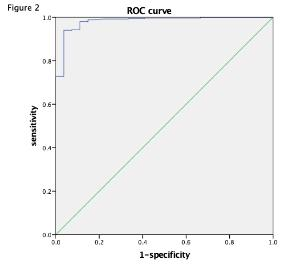
Fig. 4. The results of receiver operating characteristic (ROC) curve analysis.
Diffusion Tensor Imaging Detects Cross-Sectional and Longitudinal Brain Changes in Type 2 Diabetes Mellitus
Bhaswati Roy1, Sarah E Choi2, Milena Lai3, Luke Ehlert3, Rashmi Mullur4, Matthew J. Freeby4, and Rajesh Kumar3,5,6,7
1University of California at Los Angeles, LOS ANGELES, CA, United States, 2UCLA School of Nursing, University of California at Los Angeles, Los Angeles, CA, United States, 3Anesthesiology, University of California at Los Angeles, Los Angeles, CA, United States, 4Medicine, University of California at Los Angeles, Los Angeles, CA, United States, 5Radiology, University of California at Los Angeles, Los Angeles, CA, United States, 6Bioengineering, University of California at Los Angeles, Los Angeles, CA, United States, 7Brain Research Institute, University of California at Los Angeles, Los Angeles, CA, United States
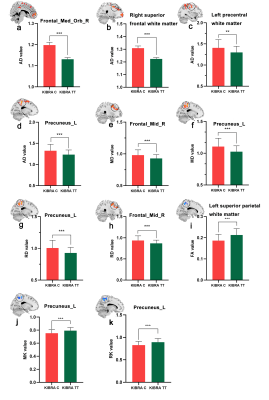
Patients with Type 2 diabetes mellitus (T2DM) show brain tissue changes, but the nature and extent of damage and their progression with time are unclear. Using DTI based MD procedures, we showed chronic tissue changes in T2DM subjects and their continued progression after 6 months follow-up.
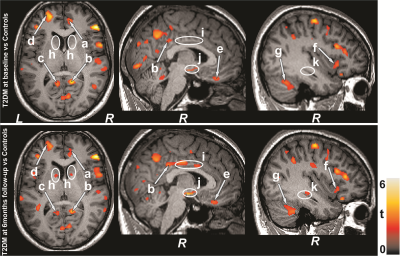
Figure 1: Brain regions with increased MD values in T2DM
patients at baseline and 6 months follow-up appeared over controls. These sites
included the (arrows) anterior and posterior cingulate (a-c), frontal
(d) and prefrontal (e), insular cortices (f), and cerebellum (g). Few
regions emerged with widespread damage in follow-up over baseline
T2DM patients, and these sites (ellipses) included the caudate (h),
middle cingulate (i), hypothalamus (j), and hippocampus (k). All images are in
neurological convention (L = left; R = right). Color bar indicates t-statistic
values.
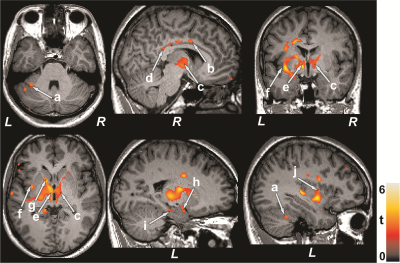
Figure 2: Paired t-test exhibit higher MD values in 6-months
follow-up T2DM patients over baseline. The regions with increased MD values
included the cerebellum (a), mid (b) and posterior (d) cingulate, thalamus (c,
e), insular cortices (f, j), caudate (g), amygdala (h), and hippocampus (i).
Figure conventions are same as in Figure 1.
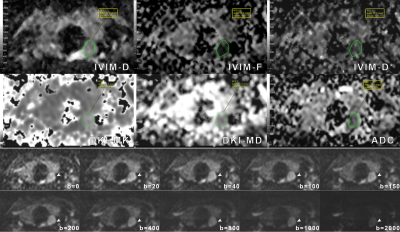
Preliminary Assessment of Intravoxel Incoherent Motion Diffusion-Weighted MRI (IVIM-DWI) Metrics in Alzheimer’s Disease
Maurizio Bergamino1, Ashley Nespodzany1, Leslie C Baxter1,2, Anna Burke3, Richard Caselli2, Marwan N Sabbagh4, Ryan R Walsh5, and Ashley M Stokes1
1Division of Neuroimaging Research, Barrow Neurological Institute, Phoenix, AZ, United States, 2Mayo Clinic Arizona, Phoenix, AZ, United States, 3Department of Neuropsychiatry, Barrow Neurological Institute, Phoenix, AZ, United States, 4Lou Ruvo Center for Brain Health, Cleveland Clinic, Las Vegas, NV, United States, 5The Muhammad Ali Parkinson Center, Barrow Neurological Institute, Phoenix, AZ, United States
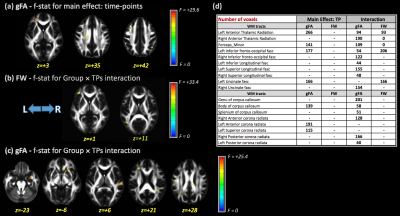
IVIM-DWI was used to investigate early
AD-related microstructural and functional changes. Significant differences were
observed using IVIM biomarkers between healthy controls, MCI, and AD groups,
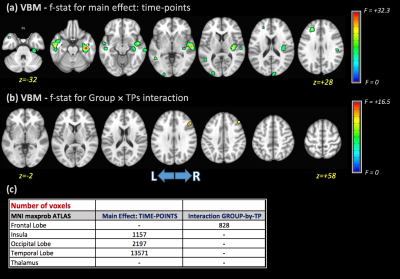
while VBM showed differences only in later AD stages.
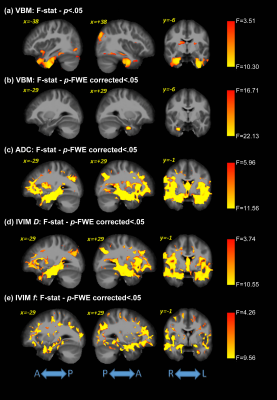
Voxel-based analysis
for the F-statistics across groups for all analysis methods. VBM results are
also shown uncorrected for family-wise error (FWE) in panel (a). For all other
panels, we report clusters at a significance threshold of p-value < 0.05 corrected for FWE.
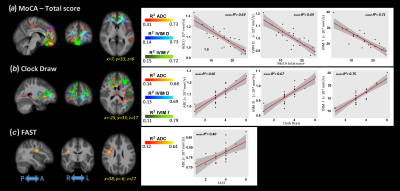
Voxel-based
correlations between MoCA/Clock Draw/FAST and VBM/ADC/IVIM metrics. The plots,
with the relative mean of R2, represent the correlations of the
average values inside the significant clusters.