Oral Session
Advances in Quantitative Neuroimaging
ISMRM & ISMRT Annual Meeting & Exhibition • 03-08 June 2023 • Toronto, ON, Canada

Oral Session
Advances in Quantitative Neuroimaging
16:00 |
0269.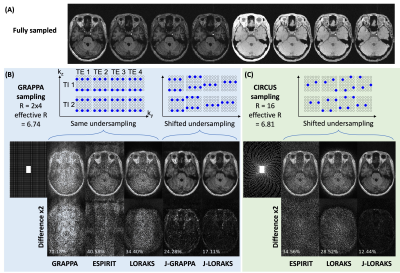 |
Acceleration of Multi-Echo MP2RAGE using Interleaved Undersampling and Joint-Contrast Reconstruction
Jingwen Yao1, Jing Liu1, Brian Burns2, Roland Henry3, and Peder Larson1,4
1Department of Radiology and Biomedical Imaging, University of California, San Francisco, San Francisco, CA, United States, 2Applied Sciences Lab, GE Healthcare, Menlo Park, CA, United States, 3Department of Neurology, University of California, San Francisco, San Francisco, CA, United States, 4UCSF/UCB Graduate Program in Bioengineering, University of California, San Francisco, San Francisco, CA, United States Keywords: Quantitative Imaging, Quantitative Imaging, MP2RAGE, multi-echo In this study, we evaluated the use of interleaved undersampling and joint-contrast reconstruction to accelerate multi-echo MP2RAGE. We compared three sampling patterns (GRAPPA, interleaved GRAPPA, and CIRCUS) and five reconstruction algorithms (GRAPPA, ESPIRIT, LORAKS, Joint-GRAPPA, and Joint-LORAKS) using retrospective undersampling experiments. The results demonstrated better performance achieved using joint-contrast compared to single-contrast reconstruction, and CIRCUS sampling compared to GRAPPA. With the combination of CIRCUS undersampling and Joint-LORAKS reconstruction, we obtained quantitative measurements of T1, R2*, QSM, and volumes at R=6.8 highly consistent with the fully sampled data, demonstrating the potential of using the proposed strategy to accelerate ME-MP2RAGE acquisition. |
| 16:08 | 0270. |
High-resolution whole-brain multi-parameter mapping at 7 Tesla with interleaved fly-back 3D-EPI and universal pTX pulses
Rüdiger Stirnberg1, Yannik Völzke1, Daniel Löwen1, Eberhard Daniel Pracht1, Vincent Gras2, Nicolas Boulant2, Siya Sherif3, Difei Wang1, Mónica Ferreira1, Jennifer Faber1,4, and Tony Stöcker1,5
1German Center for Neurodegenerative Diseases (DZNE), Bonn, Germany, 2Commissariat à l’Energie Atomique, CNRS, NeuroSpin, Baobab, Université Paris-Saclay, Gif sur Yvette, France, 3GIGA - Cyclotron Research Centre - In Vivo Imaging, University of Liège, Liège, Belgium, 4Department of Neurology, University Hospital Bonn, Bonn, Germany, 5Department of Physics and Astronomy, University of Bonn, Bonn, Germany Keywords: Quantitative Imaging, High-Field MRI, MPM, QSM, 3D-EPI We present a versatile high-resolution whole-brain multiparametric/susceptibility mapping protocol at 7T, introducing interleaved fly-back skipped-CAIPI 3D-EPI. To overcome the impeding limitations of B1+ inhomogeneity, universal pTX pulses for excitation and magnetization transfer saturation are employed. Within 17 minutes scan time, 0.6mm isotropic whole-brain MT-/PD-/T1-weighted magnitude and phase images at four echo times and corresponding quantitative parameter maps are obtained. Supplementary output, like SWI and MPRAGE-like images can be generated as well. Scan efficiency is high and geometric distortions are negligible. Optionally, the interleaved fly-back acquisition allows a separate analysis of two monopolar readout images. |
| 16:16 | 0271. |
Full brain relaxometry at 7T in 3 minutes by accelerated MR-STAT using a low-SAR flip angle train
Edwin Versteeg1, Hongyan Liu1, Oscar van der Heide1, Miha Fuderer1, Cornelis AT van der Berg1, and Alessandro Sbrizzi1
1Computational Imaging Group for MR diagnostics & therapy, Center for Image Sciences, UMC Utrecht, Utrecht, Netherlands Keywords: Quantitative Imaging, Quantitative Imaging MR-STAT is a framework that enables the estimation of multi-parametric quantitative MR-maps from a single short scan. Quantitative imaging at 7T can be used to probe the brain’s microstructure at high resolution. We show the first results of MR-STAT at 7T and show that SAR-limitations and B1+-inhomogeneities can be successfully addressed by designing a low-SAR flip angle train and using a B1+-prior during reconstruction. In addition, we use the increased SNR at 7T to achieve two-fold acceleration of the MR-STAT acquisition and show that high quality parameters can be obtained both on a gel-phantom and in-vivo (full-brain) in 3 minutes. |
| 16:24 | 0272.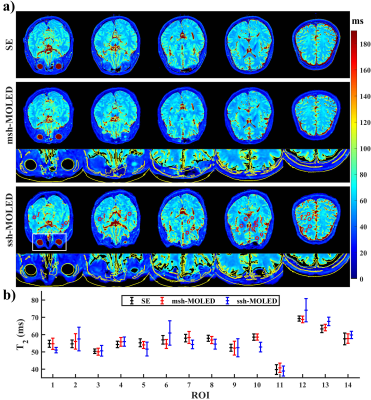 |
High spatial resolution T2 mapping via multi-shot multiple overlapping-echo detachment imaging
Yang Qizhi1, Wenhua Geng1, Hongjian He2, Jianhui Zhong2,3, Congbo Cai1, Zhong Chen1, and Shuhui Cai1
1Xiamen University, Xiamen, China, 2Zhejiang University, Hangzhou, China, 3University of Rochester, Rochester, NY, United States Keywords: Quantitative Imaging, Quantitative Imaging, multiple overlapping-echo detachment imaging A multi-shot acquisition strategy is adapted to multiple overlapping-echo detachment imaging (MOLED), implementing T2 mapping with the spatial resolution of submillimeter. Compared with ssh-MOLED (ssh- for single-shot), msh-MOLED (msh- for multi-shot) are more resistant to B0 inhomogeneity, leading to quantitative results with less distortion. Besides, msh-MOLED fulfills a high acquisition efficiency. Accuracy of msh-MOLED was validated on phantoms with a 7T zoological scanner and a 3T whole-body scanner. Higher spatial resolution also alleviates partial volume effect and results in a better structure delineation of msh-MOLED, which was corroborated with in vivo experiments. |
| 16:32 | 0273.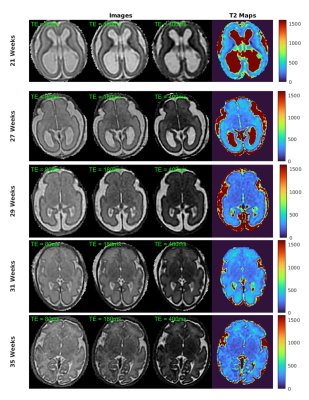 |
In-Vivo T2 measurements of fetal brain in 1.5T
Suryava Bhattacharya1, Anthony Price1,2,3, Alena Uus1,3, Helena S. Sousa1, Massimo Marenzana2,3, Kathleen Colford2,3, Peter Murkin2,3, Maggie Lee2,3, Lucilio Cordero-Grande3,4, Rui Pedro Azeredo Gomes Teixeira1,3, Shaihan J. Malik1,3, and Maria Deprez1,3
1Department of Biomedical Engineering, King's College London, London, United Kingdom, 2Guy's and St Thomas Trust, London, United Kingdom, 3Centre for the Developing Brain, King's College London, London, United Kingdom, 4Biomedical Image Technologies, ETSI Telecomunicación, Universidad Politécnica de Madrid and CIBER-BBN, Madrid, Spain Keywords: Quantitative Imaging, Fetus Fetal brains go through rapid development, resulting in significant changes in tissue observable by MRI, during gestation. This work presents a quantitative MR imaging pipeline that aims to measure T2 relaxation in fetal brains from clinically acquired single-shot TSE sequences, reconstructed using slice to volume registration (SVR). Images with different echo times (TE) were acquired using a 1.5T MR system; we explored both a simple exponential decay model and more complex simulation-based dictionary for T2 estimation. Measured T2 values are greater than estimates from neonates and developmentally important regions such as the subplate are visible with significantly longer T2s. |
| 16:40 |
0274.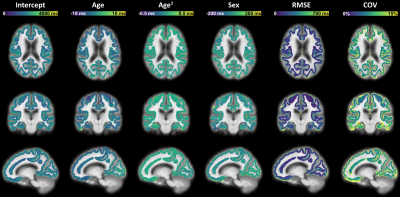 |
A normative cortical T1 atlas for single-subject pathology detection at 7T
Samuele Caneschi1,2,3, Tom Hilbert1,2,3, Gabriele Bonanno4,5,6, Robert Hoepner7, Roland Wiest5,8, Piotr Radojewski5,8, Bénédicte Maréchal1,2,3, Jean-Philippe Thiran2,3, Tobias Kober1,2,3, and Gian Franco Piredda1,9,10
1Advanced Clinical Imaging Technology, Siemens Healthineers International AG, Lausanne, Switzerland, 2Department of Radiology, Lausanne University Hospital and University of Lausanne, Lausanne, Switzerland, 3LTS5, École Polytechnique Fédérale de Lausanne (EPFL), Lausanne, Switzerland, 4Advanced Clinical Imaging Technology, Siemens Healthineers International AG, Bern, Switzerland, 5Translational Imaging Center (TIC), Swiss institute for Translational and Entrepreneurial Medicine, Bern, Switzerland, 6Magnetic Resonance Methodology, Institute of Diagnostic and Interventional Neuroradiology, University of Bern, Bern, Switzerland, 7Department of Neurology, University Hospital Bern, Inselspital, University of Bern, Bern, Switzerland, 8Support Center for Advanced Neuroimaging, Institute for Diagnostic and Interventional Neuroradiology, Inselspital, University of Bern, Bern, Switzerland, 9Human Neuroscience Platform, Fondation Campus Biotech Geneva, Geneva, Switzerland, 10CIBM-AIT, École Polytechnique Fédérale de Lausanne (EPFL), Lausanne, Switzerland Keywords: Quantitative Imaging, Data Processing, Brain cortex Quantitative MRI allows establishing normative atlases of relaxometry parameters which enable single-subject comparisons for anomaly detection. The large anatomical inter-subject variability of the brain cortex and its convoluted shape, however, complicate such comparison in this region. In this study, a method to align inter-subject brain cortices is proposed and a voxel-wise normative T1 atlas in the cortex is built from a cohort of 133 healthy subjects scanned at 7T. The atlas is used to detect and characterize T1 alterations in two multiple sclerosis patients on a single-subject basis. |
| 16:48 | 0275.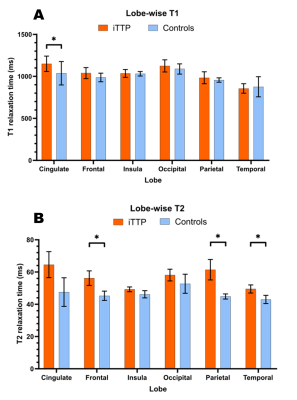 |
Investigating the effect of thrombotic thrombocytopenic purpura on neurocognitive function using relaxation and myelin water fraction maps
Fahad Hannan1, Michael T. Jurkiewicz2, Jonathan Thiessen1,2,3, and Susan Shih-Han Huang1,4,5
1Medical Biophysics, University of Western Ontario, London, ON, Canada, 2Medical Imaging, University of Western University, London, ON, Canada, 3Lawson Health Research Institute, London, ON, Canada, 4Medicine, Schulich School of Medicine & Dentistry, London, ON, Canada, 5The Lilibeth Caberto Kidney Clinical Research Unit, London, ON, Canada Keywords: Quantitative Imaging, Neurodegeneration, Cognitive decline, neuroinflammation, myelin water fraction Despite being in remission, patients with immune-mediated thrombotic thrombocytopenic purpura (iTTP) experience a variety of cognitive health problems. Quantitative MRI was used to verify the health of white matter in 19 patients. Patients had increased T1 in the cingulate cortex and increased T2 in the frontal, parietal, and temporal lobes. These regions correlate with decreased cognitive scores and depression tests taken by patients alongside the MRI scan. Increased T1 and T2 could suggest a variety of tissue pathologies but require further investigation to determine exactly what condition is affecting white matter health. |
| 16:56 | 0276.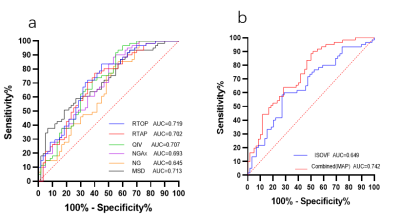 |
MRI profiling of temporal lobe epilepsy with hippocampal sclerosis using multi-compartment diffusion models
Xiaonan Zhang1, Guohua Zhao1, Huiting Zhang2, Eryuan Er Gao1, and Jingliang Cheng1
1The First Affiliated Hospital of Zhengzhou University, Zhengzhou, China, 2MR Scientific Marketing, Siemens Healthineers Ltd., Wuhan, China Keywords: Quantitative Imaging, Brain The hippocampal microstructural alterations by using routine magnetic resonance imaging presents a challenge. This study aimed to evaluate the performance of the NODDI and MAP models in temporal lobe epilepsy (TLE) patients with hippocampal sclerosis (HS). Our results found that all NODDI and MAP parameters had significant differences between ipsilateral HS and contralateral HS/HC, and had MAP models better diagnostic performance than NODDI. In addition, combined MAP model had significant better diagnostic performance than all the single parameters. In conclusion, MAP is superior to NODDI in diagnosing TLE with HS. |
| 17:04 | 0277.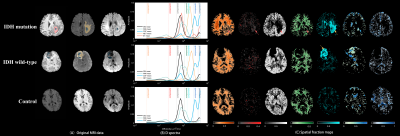 |
Multi-exponential diffusivity spectroscopy with clinical DWI protocol has the potential to diagnose and characterize gliomas
Junqi Xu1, Yaru Sheng2, Hao Li1, Qianfeng Wang1, Zidong Yang1, Yan Ren2, and He Wang1,3
1Institute of Science and Technology for Brain-Inspired Intelligence, Fudan University, Shanghai, China, 2Radiology Department, Hua Shan Hospital, Fudan University, Shanghai, China, 3Human Phenome Institute, Fudan University, Shanghai, China Keywords: Quantitative Imaging, Brain, Diffusion, Multi-exponential spectroscopy We present a multi-exponential diffusivity spectroscopy model to measure the diffusivity distribution of individual voxels in gliomas, which enables the comparison of the spectral fraction components between brain tumors and normal tissues. A neural network algorithm was used to speed up and improve the stability of the decomposition of multi-exponential decay data with a lower signal-to-noise ratio. The results show that diffusivity fractions of some spectral components were significantly different between IDH-mutant and -wild gliomas in grades 2 and 3. |
| 17:12 | 0278.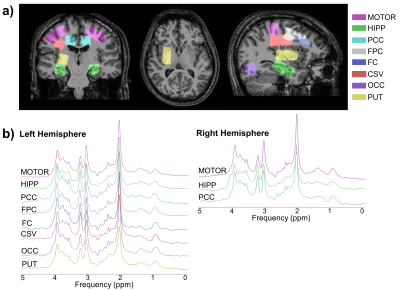 |
Dependency of Proton MR Spectroscopy Neuro-Metabolite Concentrations on Grey Matter Fraction and Location in the Healthy Human Brain
Ana Jorge Gonçalves1, Julian Matthews2, Hamied Haroon2, Laura M. Parkes2, Marie-Claude Asselin1, and Stephen Williams1
1Division of Informatics, Imaging and Data Sciences, School of Health Sciences, Faculty of Biology, Medicine and Health, The University of Manchester, Manchester, United Kingdom, 2Division of Psychology, Communication and Human Neuroscience, School of Health Sciences, Faculty of Biology, Medicine and Health, The University of Manchester, Manchester, United Kingdom Keywords: Quantitative Imaging, Spectroscopy, Brain Variations in six neuro-metabolite (N-acetylaspartate, creatine, myo-inositol, glutamate, glutamine and glycerophosphorylcholine) signals from MR spectroscopy (MRS) data across eleven brain regions were tested for regional differences and for dependence on the spectroscopic volume tissue composition (fractional grey matter (GM)), using a linear mixed-effect model. We found significant positive correlations of N-acetylaspartate, creatine and glutamate concentrations with fractional GM across all eleven regions and a significant regional effect for all six metabolites. This provides clear evidence that brain metabolite measurements are dependent on both the region and fractional GM, demonstrating the importance of knowing tissue fractions when interpreting MRS measurements. |
| 17:20 | 0279.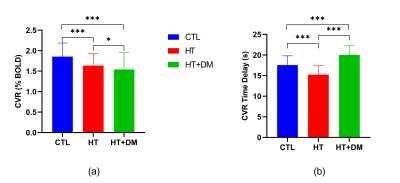 |
Effects of hypertension and type 2 diabetes on cerebrovascular reactivity in older adults
Nuwan D. Nanayakkara1, Liesel-Ann Meusel1, Nicole D. Anderson1,2, and J. Jean Chen1,3,4
1Rotman Research Institute, Baycrest Health Sciences, Toronto, ON, Canada, 2Departments of Psychology and Psychiatry, University of Toronto, Toronto, ON, Canada, 3Department of Medical Biophysics, University of Toronto, Toronto, ON, Canada, 4Department of Biomedical Engineering, University of Toronto, Toronto, ON, Canada Keywords: Quantitative Imaging, Diabetes, Cerebrovascular reactivity, CVR Differences in CVR amplitude and time delay were assessed among patients with hypertension (HT), hypertension-plus-type-2 diabetes (HT+DM), and age-matched controls (CTL) using a pipeline for adaptive capturing of the BH response directly from BOLD data, ensuring greater robustness. The lowest CVR amplitude and the longest delay were found in the HT+DM group. CTL had the highest CVR amplitude, and the HT group had the shortest time delays. CVR delay was more sensitive to group differences than amplitude. |
| 17:28 | 0280.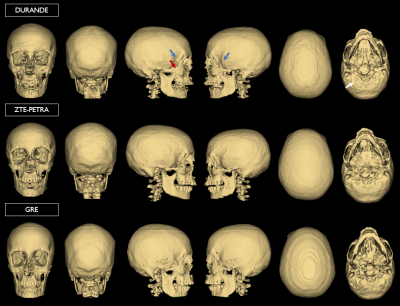 |
Quantitative Comparison of Bone-Selective MRI Techniques for Craniofacial Imaging
Nada Kamona1,2, Brandon C. Jones1,2, Hyunyeol Lee1,3, Connor S. Wagner4, Makayla Clark1, Advait Thaploo1, Sandhya Konar1, Carlos Mendez Cruz1, Kevin Li1, Bartlett P. Bartlett4, Chamith S. Rajapakse1,5, Hee Kwon Song1, and Felix W. Wehrli1
1Department of Radiology, Perelman School of Medicine, University of Pennsylvania, Philadelphia, PA, United States, 2Department of Bioengineering, University of Pennsylvania, Philadelphia, PA, United States, 3School of Electronics Engineering, Kyungpook National University, Daegu, Korea, Republic of, 4Division of Plastic, Reconstructive, and Oral Surgery, Children's Hospital of Philadelphia, University of Pennsylvania, Philadelphia, PA, United States, 5Department of Orthopaedic Surgery, University of Pennsylvania, Philadelphia, PA, United States Keywords: Quantitative Imaging, Bone, Skull imaging Risk of ionizing radiation from CT remains a concern for pediatric patients, such as craniosynostosis patients who may require multiple scans at a young age. We quantitatively compared three MRI methods for imaging the skull by scanning healthy adults using our solid-state bone-selective ultrashort echo subtraction sequence, along with zero echo time and gradient-echo sequences. We demonstrate the similarities among the 3D rendered bone segmentations in terms of Dice similarity coefficient and craniometric measurements across all imaging methods. Our UTE echo subtraction technique shows clear visualization of craniofacial structures near the bone-air boundaries and superior signal suppression of soft-tissues. |
| 17:36 |
0281.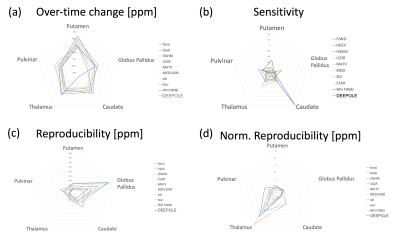 |
Systematic assessment of published QSM inversion algorithms for detecting longitudinal changes in brain susceptibility
Fahad Salman1, Abhisri Ramesh1, Thomas Jochmann1,2, Mirjam Prayer1, Niels Bergsland1,3, Michael G. Dwyer1,4, Dejan Jakimovski1, Robert Zivadinov1,4, and Ferdinand Schweser1,4
1Buffalo Neuroimaging Analysis Center, Department of Neurology, Jacobs School of Medicine and Biomedical Sciences, University at Buffalo, The State University of New York, Buffalo, NY, United States, 2Department of Computer Science and Automation, Technische Universität Ilmenau, Ilmenau, Germany, 3IRCCS, Fondazione Don Carlo Gnocchi ONLUS, Milan, Italy, 4Center for Biomedical Imaging, Clinical and Translational Science Institute, University at Buffalo, The State University of New York, Buffalo, NY, United States Keywords: Quantitative Imaging, Quantitative Susceptibility mapping Quantitative susceptibility mapping (QSM) calculates the tissue magnetic susceptibility from gradient-echo phase images. Tissue magnetic susceptibility is of high clinical interest because it reflects tissue iron, myelin, and calcium. However, the clinical significance of these findings remains unclear. In particular, it is unknown if algorithms differ in their ability to detect group differences and longitudinal changes in susceptibility.The present work compared a large number of published algorithms with respect to their ability to detect aging-related changes over time. |
| 17:44 |
0282.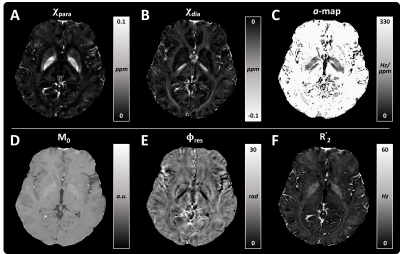 |
An improved sub-voxel QSM for susceptibility source separation
Zhenghao Li1, Ruimin Feng1, and Hongjiang Wei1
1Shanghai Jiao Tong University, Shanghai, China Keywords: Quantitative Imaging, Quantitative Susceptibility mapping Conventional quantitative susceptibility mapping (QSM) reconstruction methods only provide voxel-averaged susceptibility value. We proposed a comprehensive complex signal model that describes the relationship between the 3D GRE signal and the contributions of opposing susceptibility to the frequency shift and $$$R_2^*$$$ relaxation. We used an iterative data fitting scheme to alternatively determine the sub-voxel susceptibilities and the voxel-wise proportionality coefficient between $$$R_2'$$$ and absolute susceptibility. Our experiments on in-vivo human brain data compared with histological staining images demonstrate that the proposed method provides more accurate results for quantifying brain iron and myelin than previous QSM separation methods. |
| 17:52 | 0283.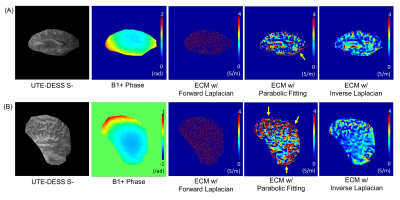 |
Electrical Conductivity Mapping Using Ultrashort Echo Time Double Echo Steady State
Hyungseok Jang1, Sam Sedaghat1, Soo Hyun Shin1, Saeed Jerban1, Yajun Ma1, Eric Y Chang1,2, and Jiang Du1,2,3
1Department of Radiology, University of California, San Diego, San Diego, CA, United States, 2Radiology Service, Veterans Affairs San Diego Healthcare System, San Diego, CA, United States, 3Department of Bioengineering, University of California, San Diego, San Diego, CA, United States Keywords: Quantitative Imaging, Electromagnetic Tissue Properties Electrical conductivity is an intrinsic tissue property. At the Larmor frequency of the MR system (i.e., ~128 MHz at 3T), the electrical conductivity reflects the tissue composition and ionic contents. Electrical conductivity mapping (ECM) has recently emerged as a promising MR-based biomarker. In this study, we show the feasibility of ECM using ultrashort echo time double echo steady state (UTE-DESS). In addition, three ECM methods, including forward Laplacian, parabolic fitting, and inverse Laplacian, are compared in computer simulation and ex vivo experiments with four cadaveric human brain specimens. |
 Back to Meeting Home
 Back to the Program-at-a-Glance
The International Society for Magnetic Resonance in Medicine is accredited by the Accreditation Council for Continuing Medical Education to provide continuing medical education for physicians.
 Back to Meeting Home
 Back to the Program-at-a-Glance
 View Presentation Video