-
Estimation of fractional myocardial blood volume and water exchange using ferumoxytol-enhanced MRI
Caroline Colbert1, Michael A. Thomas2, Ran Yan3, Aleksandra Radjenovic4, J. Paul Finn1,5, Peng Hu1,3,5, and Kim-Lien Nguyen1,2,5
1Physics and Biology in Medicine Graduate Program, David Geffen School of Medicine at UCLA, Los Angeles, CA, United States, 2Division of Cardiology, UCLA David Geffen School of Medicine, Los Angeles, CA, United States, 3Department of Radiology, UCLA David Geffen School of Medicine, Los Angeles, CA, United States, 4Institute of Cardiovascular & Medical Sciences, College of Medical, Veterinary and Life Sciences, University of Glasgow, Glasgow, United Kingdom, 5Diagnostic Cardiovascular Imaging Laboratory, Department of Radiological Sciences, UCLA David Geffen School of Medicine, Los Angeles, CA, United States
Healthy normal swine showed
a mean mid-ventricular fMBV of 7.2 ± 1.4%. This study demonstrates the
feasibility of fMBV estimation using multi-dose FE‑MRI with a two-compartment
water exchange model.
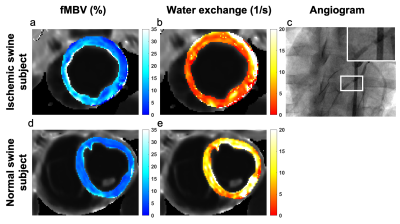
Figure 2. Pixelwise
fMBV and water exchange maps in a swine model of regional myocardial
hypoperfusion (a, b) and a normal swine subject (d, e). In the swine subject
with artificially induced coronary stenosis (top panel), differences in fMBV
(a) and water exchange (b) can be observed in the hypoperfused anterior,
septal, and inferior segments. Angiographic image (c) acquired following
deployment of a 3D printed coronary implant in the mid LAD shows severe
coronary narrowing.
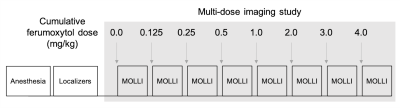
Figure 1. Ferumoxytol
multi-dose T1 mapping study protocol. Following anesthesia and localizers, we
acquired mid-ventricular short axis T1 maps at eight cumulative ferumoxytol
doses (0.0 – 4.0 mg/kg). Following each ferumoxytol infusion, we observed a
five-minute delay to achieve contrast steady state. MOLLI, Modified Look-Locker
Inversion.
-
Brain oxygen extraction is differentially altered by Alzheimer’s and vascular diseases
Dengrong Jiang1,2, Zixuan Lin1,2, Peiying Liu1, Sandeepa Sur1, Cuimei Xu1, Kaisha Hazel1, George Pottanat1, Jacqueline Darrow3, Jay J. Pillai1,4, Sevil Yasar5, Paul Rosenberg6, Abhay Moghekar3, Marilyn Albert3, and Hanzhang Lu1,2,7
1The Russell H. Morgan Department of Radiology & Radiological Science, Johns Hopkins University School of Medicine, Baltimore, MD, United States, 2Department of Biomedical Engineering, Johns Hopkins University School of Medicine, Baltimore, MD, United States, 3Department of Neurology, Johns Hopkins University School of Medicine, Baltimore, MD, United States, 4Department of Neurosurgery, Johns Hopkins University School of Medicine, Baltimore, MD, United States, 5Department of Medicine, Johns Hopkins University School of Medicine, Baltimore, MD, United States, 6Department of Psychiatry and Behavioral Sciences, Johns Hopkins University School of Medicine, Baltimore, MD, United States, 7F.M. Kirby Research Center for Functional Brain Imaging, Kennedy Krieger Research Institute, Baltimore, MD, United States
Cerebral oxygen extraction fraction (OEF) is
differentially affected by Alzheimer’s (decrease OEF) and vascular (increase
OEF) pathology. Therefore, OEF can be useful in differential diagnosis of
Alzheimer’s disease and vascular cognitive impairment.
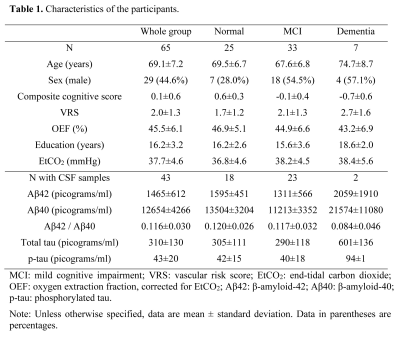
Table 1. Characteristics of the
participants.
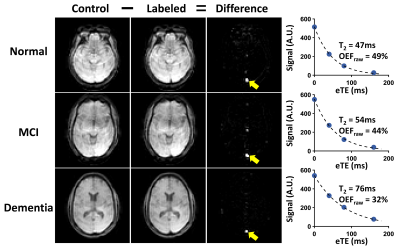
Figure 1. TRUST OEF data of
representative normal (top row), MCI (second row) and demented (bottom row)
subjects. Subtraction between control (first column) and labeled (second row)
images yields strong venous blood signal in the superior sagittal sinus (yellow
arrows) in the difference images (third column). The scatter plots on the far
right show venous signal as a function of effective TE (eTE). Fitted venous
blood T2 and the corresponding OEF values (before correction) are
also shown.
-
Three-Dimensional Surface-Based Analysis of Cartilage MRI Data in Knee Osteoarthritis: Validation and Initial Clinical Application
James W. MacKay1,2, Joshua Kaggie1, Graham M. Treece3, Stephen M. McDonnell4, Wasim Khan4, Alexandra R. Roberts5,6, Rob L. Janiczek5, Martin J. Graves1, Tom D. Turmezei2,7, Andrew W. McCaskie4, and Fiona J. Gilbert1
1Department of Radiology, University of Cambridge, Cambridge, United Kingdom, 2Norwich Medical School, University of East Anglia, Norwich, United Kingdom, 3Department of Engineering, University of Cambridge, Cambridge, United Kingdom, 4Department of Surgery, University of Cambridge, Cambridge, United Kingdom, 5Clinical Imaging, GlaxoSmithKline, London, United Kingdom, 6Antaros Medical, Uppsala, Sweden, 7Department of Radiology, Norfolk & Norwich University Hospital, Norwich, United Kingdom
We propose a novel approach to analysis of cartilage MRI
data in knee osteoarthritis which improves responsiveness and reduces analysis
burden vs standard methods. This could improve our ability to detect treatment
effects in shorter, smaller studies.
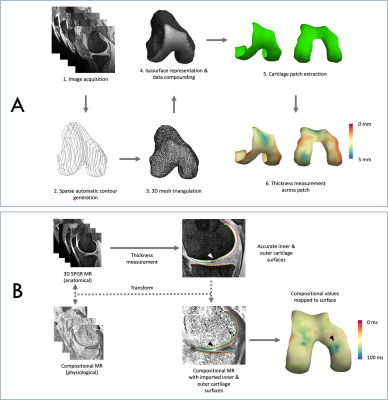
Figure 2:
Fig 2A: Outline of initial steps in 3D-CaSM
pipeline, from image acquisition to thickness measurement. Femur used for
demonstration purposes – 3D-CaSM is also performed for tibial cartilage
surfaces.
Fig 2B: Outline of cartilage composition measurement
process. In this example, a T1rho map is used. Note focal area of increased
T1rho values on the medial femoral condyle (black arrowhead) corresponding to
an area of partial thickness cartilage loss on the 3D SPGR images (white
arrowhead).
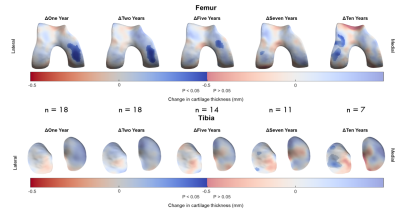
Figure 5: Implementation of 3D-CaSM in a clinical study of knee
joint distraction using statistical parametric mapping to detect effects at
group level. Surface data represent mean change from baseline mapped to the canonical
surface and masked for statistical significance. Significant increases in
cartilage thickness are seen over the weight-bearing medial femoral condyle at
up to 5 years follow-up, with a delayed compensatory response in the lateral
compartment at 7 years & 10 years follow-up.
-
Simultaneous Multiple Resonance Frequency Imaging (SMURF): Fat‑water imaging using multi‑band principles
Beata Bachrata1,2, Bernhard Strasser1,3, Wolfgang Bogner1, Albrecht Ingo Schmid4, Radim Korinek5, Martin Krššák1,2,6, Siegfried Trattnig1,2, and Simon Daniel Robinson1,7,8
1High Field MR Centre, Department of Biomedical Imaging and Image-Guided Therapy, Medical University of Vienna, Vienna, Austria, 2Karl Landsteiner Institute for Clinical Molecular MR in Musculoskeletal Imaging, Vienna, Austria, 3Athinoula A. Martinos Center for Biomedical Imaging, Department of Radiology, Massachusetts General Hospital, Harvard Medical School, Boston, MA, United States, 4High Field MR Centre, Center for Medical Physics and Biomedical Engineering, Medical University of Vienna, Vienna, Austria, 5Institute of Scientific Instruments of the CAS, Brno, Czech Republic, 6Department of Internal Medicine III, Division of Endocrinology and Metabolism, Medical University of Vienna, Vienna, Austria, 7Centre of Advanced Imaging, University of Queensland, St. Lucia, Australia, 8Department of Neurology, Medical University of Graz, Graz, Austria
The proposed Simultaneous Multiple Resonance Frequency imaging (SMURF)
approach achieved similar or better fat-water separation than state-of-the-art techniques in the knee, breasts and abdomen and allowed the
elimination of chemical shift effects in fat-water images.
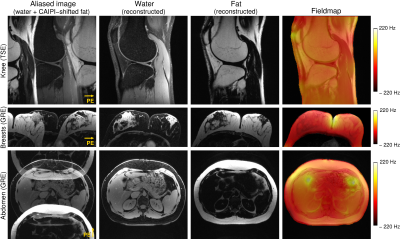
Figure
3: Excitation selectivity and unaliasing quality of SMURF imaging demonstrated
for one exemplary volunteer for each body region under consideration. The
acquired aliased images show the overlapping water and fat images, which are CAIPIRINHA‐shifted
along the phase‐encoding (PE) direction. Separate SMURF water and fat images,
reconstructed from the aliased images, illustrate the achieved separation
quality. (The separated images were rescaled for improved visibility.)
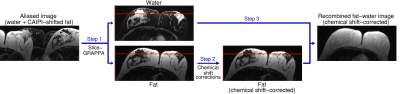
Figure 1: Fat‐water separation, chemical shift corrections, and
recombination in Simultaneous Multiple Resonance Frequency (SMURF) imaging.
Overlapping water and CAIPIRINHA‐shifted fat images are unaliased using
slice‐GRAPPA (Step 1). The fat image is shifted to reverse chemical shift
displacement – see the positions relative to the red reference line – and, for
GRE acquisitions, corrected for chemical shift‐related phase evolution (Step 2).
The fat and water images are then recombined (Step 3), generating a fat‐water
image free of chemical shift artefacts.
-
MRI of [2-13C]Lactate without J-coupling artifacts
Keshav Datta1 and Daniel Spielman1
1Department of Radiology, Stanford University, Stanford, CA, United States
Two
methods based on quadrature detection are presented to resolve J-coupling modulated
artifacts during imaging of spin-1/2 nuclei. A primary application is imaging
of [2-13C]Lactate in hyperpolarized [2-13C]Pyruvate experiments.
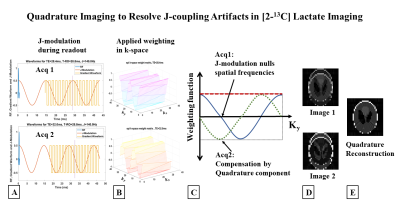
Figure 1 (A) Schematic of an RF pulse followed by gradient
waveform for EPI readout (FOV=128mm, 32x32 matrix, TE=28.4ms, readout=28.8ms)
highlights the evolution of J-modulation during imaging. (B) k-space weighting due
to J-modulation is significant in the slower phase encode direction (ky). (C) Spatial frequencies nulled due to J-coupling
evolution during readout (Acq1), compensated by acquiring a quadrature
component by delaying the acquisition time by 1/2J (Acq2). (D) Complex
combination of these two quadrature components restores the original image, (E).
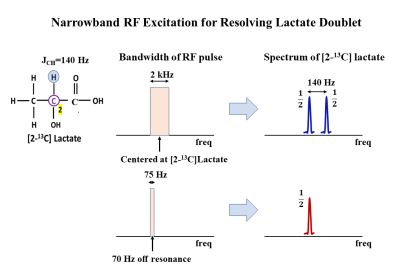
Figure 2 Narrowband excitation for resolving J-coupling
induced doublet in [2-13C]Lac. Evolution of J-coupling during a
short RF pulse (500μs, 2kHz bandwidth) is negligible and hence results
in a doublet during signal collection (top row). A long narrow bandwidth pulse
(13.33ms, 75Hz), J/2 Hz off-resonance (70Hz), on the other hand, generates
in-phase and anti-phase coherences that combine to result in a singlet during
signal acquisition.
-
Five-Dimensional Quantitative Low-Dose Multitasking Dynamic Contrast- Enhanced MRI (LD-MT-DCE): Preliminary Study on Breast Cancer
Nan Wang1,2, Yibin Xie1, Zhaoyang Fan1,2, Sen Ma1,2, Rola Saouaf3, Yu Guo1,4, Stephen L. Shiao5,6, Anthony G. Christodoulou1,2, and Debiao Li1,2
1Biomedical Imaging Research Institute, Cedars Sinai Medical Center, Los Angeles, CA, United States, 2Department of Bioengineering, University of California, Los Angeles, Los Angeles, CA, United States, 3Department of Imaging, Cedars Sinai Medical Center, Los Angeles, CA, United States, 4Department of Radiology, Tianjin First Central Hospital, Tianjin, China, 5Department of Radiation Oncology, Cedars-Sinai Medical Center, Los Angeles, CA, United States, 6Biomedical Sciences, Division of Immunology, Cedars-Sinai Medical Center, Los Angeles, CA, United States
The
low-dose Multitasking DCE was proposed for DCE quantification with whole-breast
coverage and high spatiotemporal resolution at 20% dose. The technique showed excellent
image quality and repeatability, and matched diagnosis from clinical standard.
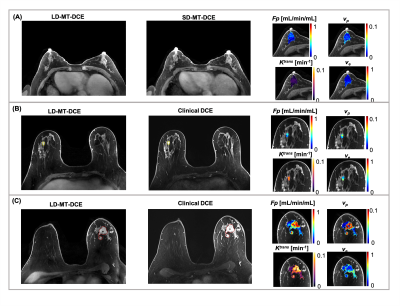
Figure
2: Representative maps of kinetic parameters showing normal breast tissue from
a 52-year-old healthy volunteer (A), a benign tumor (marked by a yellow solid
boundary) from a 49-year-old patient (B), and a malignant tumor (marked by a
red dashed boundary) from a 65-year-old patient (C). The gray-scale images
display peak-enhanced LD-MT-DCE images and the standard-dose images at the same
slice. The overlaid colormaps represents Fp, vp, Ktrans,
and ve, respectively.
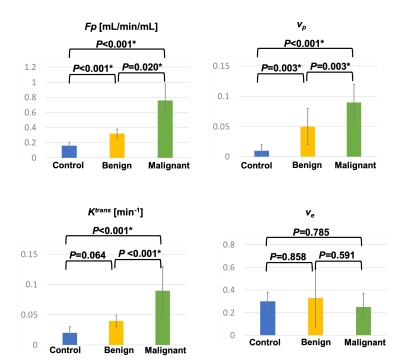
Figure
4: Mean and standard deviation measurements of Fp, vp, Ktrans,
and ve for control group, and benign and malignant tumors in patient
group. The P value of each pair by one-way ANOVA with Tukey test are marked on
top of the bar graphs. Fp, vp, and Ktrans were
significantly different between control and malignant tumor, and between benign
and malignant tumors; Fp, and vp were significantly
different between control and benign tumors. * indicates statistically
significant difference.

