-
Respiration induced B1+ changes and its compensation via respiration robust 3D kT point pulses in 7T body imaging
Christoph Stefan Aigner1, Sebastian Dietrich1, Tobias Schaeffter1,2, and Sebastian Schmitter1,3
1Physikalisch-Technische Bundesanstalt (PTB), Braunschweig and Berlin, Germany, 2Division of Imaging Sciences and Biomedical Engineering, King's College London, London, United Kingdom, 3Medical Physics in Radiology, German Cancer Research Center (DKFZ), Heidelberg, Germany
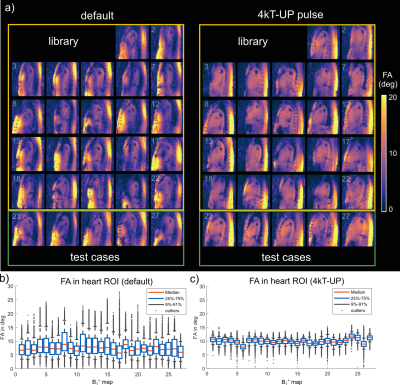
This in-vivo study demonstrates that respiration-resolved
B1+ maps and respiration-robust 4kT pTx pulses are highly preferred to achieve
3D heart FA homogenization at 7T when subjects perform strong breathing.
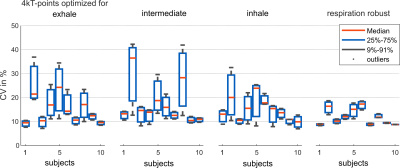
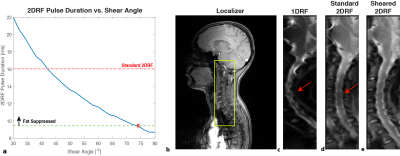
Figure 4: Evaluation
of four different pulses optimized for the heart ROI on exhale, intermediate,
inhale and optimized on all respiration states (respiration robust) for deep
breathing of all 10 subjects. Depicted are boxplots containing the CVs of all
respiration states. The respiration robust pulse performs best across all subjects
and respiration states with the lowest median and spread.
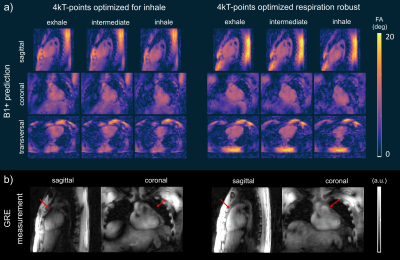
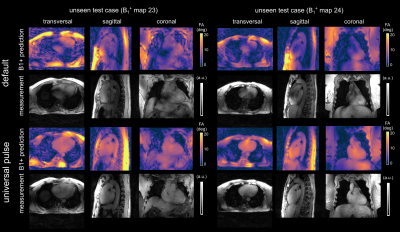
Figure 5:
Side-by-side comparison of B1+ predictions (a) and reconstructed 3D GRE images
(b) with the 4 kT-points pTx pulses optimized on inhale (left) and respiration
robust (right) of subject 7. Depicted are the views of the acquired 3D volume
close to the position of the B1+ prediction. The arrows point to signal
drop-out regions in using the inhale pulse which are corrected by the
respiration robust pulse.
-
Reducing inter-subject variability and improving accuracy of Universal Pulses using standardized (universal) pulses
Caroline Le Ster1, Franck Mauconduit1, Aurélien Massire2, Vincent Gras1, and Nicolas Boulant1
1Paris-Saclay University, CEA, CNRS, BAOBAB, NeuroSpin, Gif-sur-Yvette, France, 2Siemens Healthcare SAS, Saint-Denis, France
The pulse design process can be made transparent to the user with calibration-free universal pulses (UP). Here a new method is proposed where UPs are adjusted to scanned subjects through a fast calibration step. Adjusted SUP improve excitation performance and reduce intersubject variability.
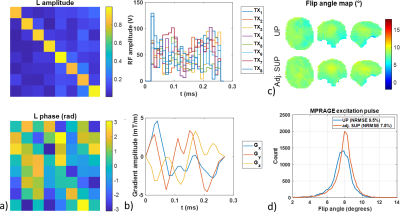
Figure 1: Pulse design methodology in the volunteer for the MPRAGE excitation 8° GRAPE pulse. a) A calibration matrix (L) is computed to adjust the standardized universal pulse (SUP) designed over the standardized pulse design database to the subject B1+ map. Its magnitude is close to the identity matrix while diagonal phase terms are close to 0 radian. b) RF and gradient amplitudes of the resulting adjusted SUP. c and d) Flip angle maps and histograms retrospectively simulated on the subject for the UP and adjusted SUP with the subject’s full B1+ map. NRMSEs are 9.5% and 7.5%, respectively.
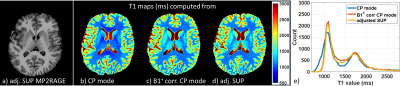
Figure 4: a) UNI contrast computed from the two inversion volumes of the MP2RAGE sequence acquired with the adjusted SUP. b to d) T1 map computed by injecting UNI signal intensities and sequence parameters in Bloch equation simulations for the MP2RAGE sequence acquired in the CP mode, CP mode with B1+ postprocessing correction and adjusted SUP, respectively. e) T1 distributions extracted from the brain for figures 4b to 4d, showing an improvement on the distributions.
-
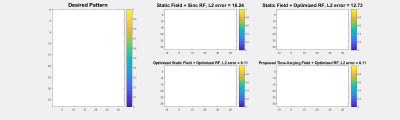
“Universal” non-selective pulse design at 7 Tesla using a birdcage coil and a B0 shim array: Evaluation of kT-points and fully optimized pulses
Bastien Guerin1, Eugene Milshteyn1, Yulin Chang2, Mads S Vinding3, Mathias Davids1, Wald L Lawrence1, and Jason Stockmann1
1Massachusetts General Hospital, Charlestown, MA, United States, 2Siemens Medical Solutions, Malvern, PA, United States, 3Center for functionally integrative neuroscience, Aarhus, Denmark
Universal kT-point
pulses yield a large improvement in flip-angle uniformity compared to the standard
RECT excitation, even without using pTx. Fully optimized RF + gradient pulses
further improve the pulse performance however adding the shim elements in the
optimization does not.
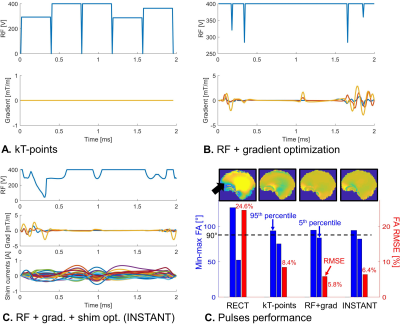
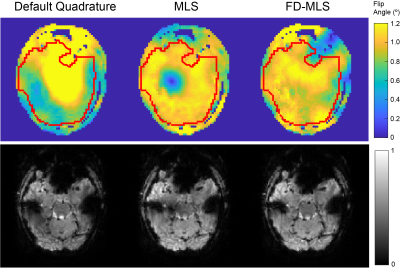
Fig. 2: 90°, 2ms “universal” excitation pulses and
their performance. For all pulses, the voltage is limited to a maximum of 400V.
A: “Universal” kT-point pulse. B: “Universal” RF + gradient
optimization pulse (no shim currents). C: “universal” RF + gradient +
shim currents pulse (INSTANT). D: RMSE performance of the different
pulse strategies and typical sagittal flip-angle map (first of the three
subjects included in the universal design). The black arrow points to typical
under-flip in the frontal lobe, which is largely corrected by the optimized pulses.
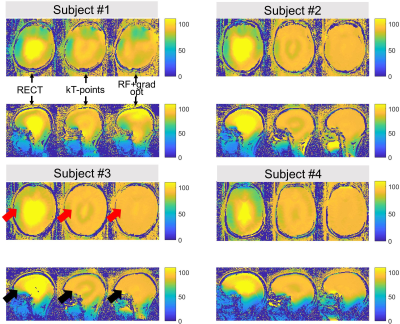
Fig. 3: Flip-angle maps acquired on the last four subjects of the
cohort using a standard rectangular pulse (RECT) and the “universal” kT-point
and RF + gradient optimized pulses shown in Fig. 2. The target flip-angle is a
uniform 90° distribution in the brain (skull has been stripped from the
optimization mask). The red and black arrows point to typical under-flip in the
temporal and frontal lobes, respectively.
-
Evaluating Universal and Fast Online Customized Pulses for parallel transmission using two different RF coils
Jürgen Herrler1, Sydney Nicole Williams2, Patrick Liebig3, Shajan Gunamony4,5, Christian Meixner6, Andreas Maier7, Arnd Dörfler1, David Porter2, and Armin Michael Nagel6
1Institue of Neuroradiology, University Hospital Erlangen, Erlangen, Germany, 2Imaging Centre of Excellence, University of Glasgow, Glasgow, Scotland, 3SIEMENS Healthineers, Erlangen, Germany, 4Institute of Neuroscience & Psychology, University of Glasgow, Glasgow, Scotland, 5MR CoilTech Limited, Glasgow, Scotland, 6Institue of Radiology, University Hospital Erlangen, Erlangen, Germany, 7Friedrich Alexander University Erlangen Nürnberg, Erlangen, Germany
Parrallel-transmit Universal Pulses (UPs) and Fast Online Customized (FOCUS) pulses were trained and evaluated on two different radiofrequency coils. UPs may fail when used on a different coil, whereas FOCUS pulses show a more reliable pulse performance and less dependency on the coil used.
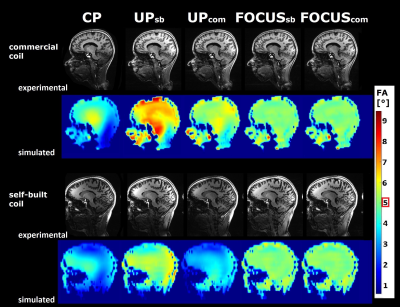
Figure 3 MPRAGE images for a fixed adiabatic inversion pulse and various excitation pulses. Experimental images and corresponding FA simulations are shown for coil-specific CP pulses and all generated pTx excitation pulses.
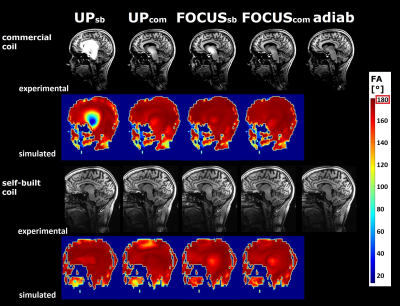
Figure 4 MPRAGE images using the UP of the respective coil for excitation and various inversion pulses. Experimental images and corresponding FA simulations are shown for coil-specific CP pulses and all generated pTx excitation pulses.
-
Motion Robust Parallel Transmission Excitation Pulse Design for Ultra-High Field MRI
Luke Watkins1, Alix Plumley2, Kevin Murphy1, and Emre Kopanoglu2
1Department of Physics and Astronomy, CUBRIC, Cardiff University, Cardiff, United Kingdom, 2Department of Psychology, CUBRIC, Cardiff University, Cardiff, United Kingdom
The
motion-robust pulse yielded superior performance in 97% of all magnitude and
phase error metrics for 46 other off-centre positions (similar performance in
remaining 3%). Similar magnitude nRMSE to the reference pulse was maintained at
the centre.
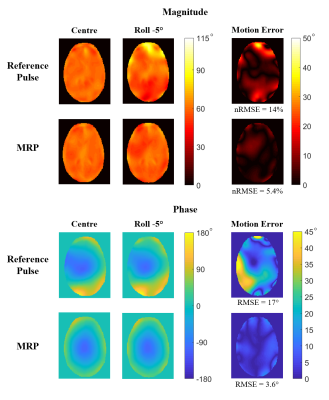
Figure 2. Magnitude and Phase profiles for a -5° roll rotation about the centre of
the head. Magnitude nRMSE was reduced from 14% (reference pulse) to 5.4% (MRP).
Maximum magnitude error was reduced from 64% to 20%. Phase RMSE was reduced
from 17° to 3.6°, and maximum phase error from 68° to 15°. The MRP was successful
at areas of high motion-induced error in magnitude and phase.
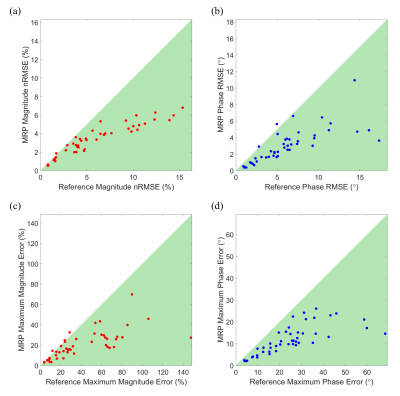
Figure 5. (a)
Magnitude nRMSE, (b) phase RMSE, (c) maximum magnitude error, (d) maximum phase
error of the MRP vs the reference pulse. The green shaded area represents where
the MRP outperformed the reference pulse. Cases where MRP performs worse than
the reference still report very similar errors.
-
Time optimal control based design of robust inversion pulses
Christina Graf1, Martin Soellradl1, Armin Rund2, Christoph Stefan Aigner3, and Rudolf Stollberger1
1Graz University of Technology, Institute of Medical Engineering, Graz, Austria, 2Institute of Mathematics and Scientific Computing, University of Graz, Graz, Austria, 3Physikalisch-Technische Bundesanstalt (PTB), Braunschweig and Berlin, Berlin, Germany
We optimize short and B0- and
B1-robust RF pulses by time-optimal control. The optimized pulse
shows a good efficiency over a broad set of B0- and B1-variations in
numerical experiments as well as extensive phantom measurements on a
3T MRI system.
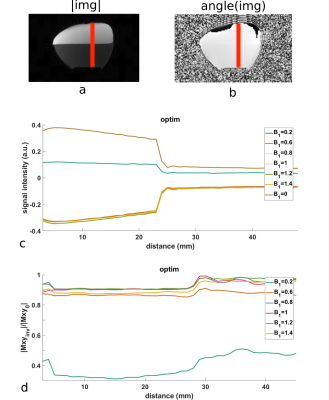
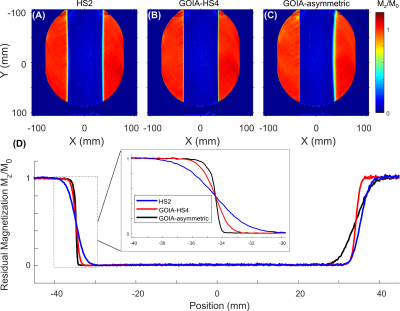
Absolute value and angle of the oil-water phantom image measured with a B1-scaling of 100% (a-b). The red line shows the position of the line plots depicted in (c) and (d). The signal intensity profile without and with inversion pulse $$$\textbf{optim}$$$ with different B1-scalings are shown in (c). In (d), the measured normalized signal intensity after application of the $$$\textbf{optim}$$$ inversion pulse by a measurement without inversion is plotted. Thus, the influence of the coil sensitivity distribution and the varying excitation flip angle is eliminated.
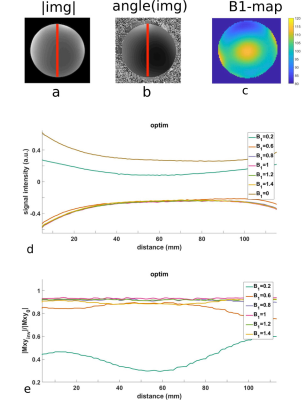
Absolute value and angle of the cylindrical MR phantom image measured with a B1-scaling of 100% (a-b) and the nominal B1-map (c). The red line shows the position of the line plots depicted in (d) and (e). The signal intensity profile without and with inversion pulse $$$\textbf{optim}$$$ with different B1-scalings are shown in (d). In (e), the measured normalized signal intensity after application of the inversion pulse by a measurement without inversion is plotted. Thus, the influence of the coil sensitivity distribution and the varying excitation flip angle is eliminated.
-
3D k-Space Domain Parallel Transmit Pulse Design
Jun Ma1,2, Bernhard Gruber3,4, Xinqiang Yan5, and William Grissom2
1Department of Radiology, Stanford University, Stanford, CA, United States, 2Department of Biomedical Engineering, Vanderbilt University, Nashville, TN, United States, 3A. A. Martinos Center for Biomedical Imaging, Massachusetts General Hospital, Harvard Medical School, Charlestown, MA, United States, 4Division MR Physics, Center for Medical Physics and Biomedical Engineering, Medical University Vienna, Vienna, Austria, 5Department of Radiology and Radiological Sciences, Vanderbilt University, Nashville, TN, United States
A k-space domain pTx pulse design algorithm is proposed,
which reduces the computation time of an example 3D pTx pulse design problem by
~80%, compared to a conventional spatial domain method.
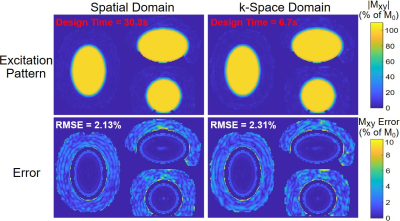
Fig 2: Normalized
excitation patterns (top row) and error maps (bottom row) in central slices for k-space domain (left) and spatial domain
designs (right). The calculated RMSEs were 2.13% (spatial) and 2.31%
(k-space), indicating uniform inner volume excitation
while maintaining the outer volume intact. The parallelized k-space domain
design required 6.7 s computation versus 30.3 s for the spatial
domain method, a 78% decrease. The size of the system matrix (W) of the
k-space domain design was 0.8 Gb, while the system matrix of the spatial domain
design had a size of 79 Gb, a 99% decrease.
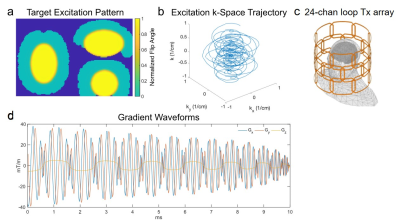
Fig 1: (a) Central slices of
the target excitation pattern used for all pulse designs, which comprised
an ellipse centered on the ventricles with AP/HF/LR semi-axes of 4.8/3.2/3.2
cm. (b) The SPINS trajectory used in the designs. (c)
The 24-channel loop Tx array that was simulated in a human head model to obtain B1+ maps. The array has diameter 32 cm, height 28 cm, and 16×11 cm rectangular loops in 3 rows of 8. (d) 10 ms
minimum time gradient waveforms that produce the SPINS trajectory, subject to
the scanner's gradient amplitude and slew rate constraints of 200 mT/m and 700
T/m/s, respectively.
-
Multidimensional RF Pulse Design with Known Spatial Encoding Imperfections
Ziwei Zhao1, Nam G. Lee2, and Krishna S. Nayak1,2
1Ming Hsieh Department of Electrical and Computer Engineering, Viterbi School of Engineering, University of Southern California, Los Angeles, CA, United States, 2Department of Biomedical Engineering, Viterbi School of Engineering, University of Southern California, Los Angeles, CA, United States
We describe a multidimensional small-tip RF pulse design procedure that incorporates concomitant field effects. The proposed method produces more accurate excitation patterns, especially for low field strengths, off-isocenter, and long pulse durations.
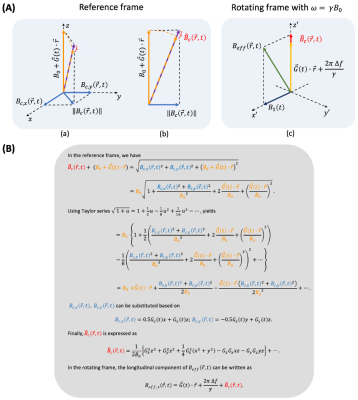
Figure 1. Concomitant field effects approximated as a Bloch-Siegert shift. (A) Reference frame visualization of (a,b) the concomitant $$$B_c(\vec{r},t)$$$, $$$B_0$$$, and gradient field $$$\vec{G}(t)\cdot\vec{r}$$$, and Rotating frame visualization (c) showing that the $$$\tilde{B_c}(\vec{r},t)$$$ approximation can be treated as additional off-resonance in the rotating frame. (B) Detailed derivations.
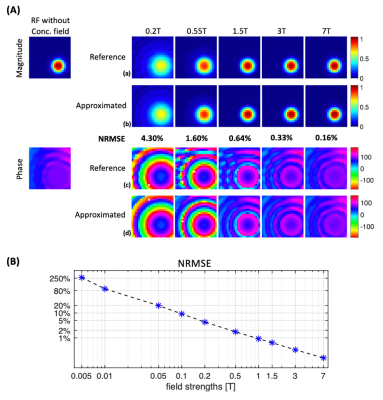
Figure 2. Concomitant field estimation accuracy. (A) (left) Original 2D RF pulse excitation profile (magnitude: top & phase: bottom). (right) Magnitude (row a, b) and phase (row c, d) of the reference profiles (a, c) and estimated profiles (b, d) using Bloch-Siegert approximation at 0.2T, 0.55T, 1.5T, 3T and 7T. NRMSE results are 4.30%, 1.60%, 0.64%, 0.33% and 0.16% from 0.2T to 7T, respectively. Reference method simulates the concomitant field in the reference frame. (B) NRMSE as a function of field strength. Note that NRMSE is < 5% for B0 ≥ 0.2 Tesla.
-
Joint optimisation of parallel transmission in 2D spin-echo based sequences
Belinda Ding1, Iulius Dragonu2, Patrick Liebig3, and Christopher T Rodgers1
1Wolfson Brain Imaging Centre, University of Cambridge, Cambridge, United Kingdom, 2Siemens Healthcare Limited, Firmley, United Kingdom, 3Siemens Healthineers, Erlangen, Germany
This abstract showed that pTx spokes pulses greatly improves
the spin-echo image quality at 7T when compared against traditional circularly
polarised pulses. Further improvement in image quality was observed with joint
optimisation algorithms.
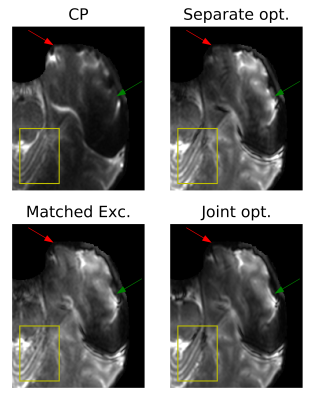
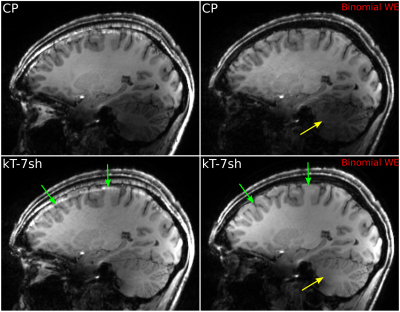
Figure 5: Zoomed in SE-EPI images acquired with
excitation FA of 60° and refocusing FA of 120°. Significant signal dropouts can
be observed in the case of CP pulses (green arrows). Excellent signal
homogeneity is observed when using any of the 3 pTx optimisation methods.
Signal losses at the edges (red arrows) are further recovered with matched
excitation and joint optimised pulses.
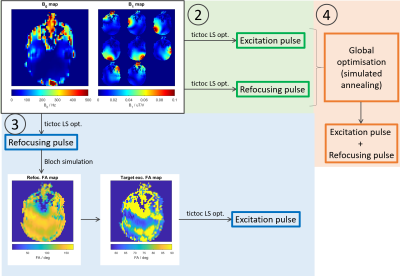
Figure 1: Pulse optimisation work flow for (2)
separately optimised pTx pulses, (3) matched excitation pTx pulses and (4)
jointly optimised pTx pulses.
-
Optimization of the Nominal Flip Angle in Actual Flip Angle Imaging Using Phase Difference Information
Tsuyoshi Matsuda1, Ikuko Uwano1, Yuji Iwadate2, and Makoto Sasaki1
1Division of Ultrahigh Field MRI, Institute for Biomedical Sciences, Iwate Medical University, Iwate, Japan, 2Global MR Applications and Workflow, GE Healthcare Japan, Hino, Japan
To optimize the nominal
flip angle (FA) value for actual FA imaging (AFI), we detected pixels
representing erroneous FAs by using phase differences between two AFI images. Nominal
FA values of ≥ 60° were observed to be unsuitable for the AFI at 7 T.
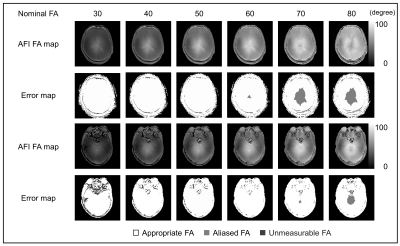
Figure 3. FA and error maps of the human head calculated by
the AFI method. Pixels with erroneous, aliased FAs were found in the nominal
FAs of ≥ 60°.
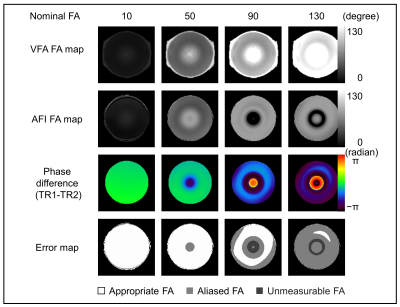
Figure 2. FA, phase difference,
and error maps of the phantom calculated by the AFI method. FA maps determined by
AFI are considerably different from those by the VFA method for nominal FAs of
90 and 130°, and the map is slightly different only at the central area in that
of 50°. Pixels with erroneous FA values due to the aliasing phenomenon are
readily detected by using the phase difference images by applying the threshold
of 1/6 rad.
-
DeepRF-Grad: Simultaneous design of RF pulse and slice selective gradient using self-learning machine
Jiye Kim1, Dongmyung Shin1, Juhyung Park1, Hwihun Jeong1, and Jongho Lee1
1Department of Electrical and Computer Engineering, Seoul National University, Seoul, Korea, Republic of
We
developed a new deep reinforcement learning method that simultaneously designs an
RF pulse and a slice-selective gradient waveform for slice selective inversion
with reduced SAR and improved robustness to off-resonance frequency.
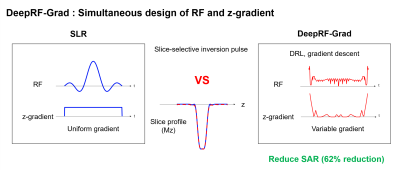
Figure 1. Summary
of DeepRF-Grad for a slice-selective inversion pulse. Compared to the SLR
results, the DeepRF-Grad designed RF pulse and z-gradient produced a
substantial reduction in SAR (62% reduction) while sustaining a similar slice
profile (SLR: blue line, DeepRF-Grad: red dashed line) and satisfying hardware
constraints (slew rate and maximum gradient). This idea of designing both RF
and gradient to reduce SAR is similar to VERSE and comparisons including
VERSE design continue in Figs 3 and 4.
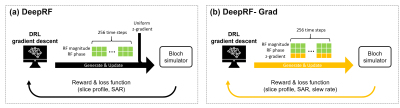
Figure 2. Comparison
of a) DeepRF and b) DeepRF-Grad. Both methods use deep reinforcement
learning (DRL) and gradient descent. a) DeepRF designs only RF magnitude and
phase, while z-gradient is fixed as uniform. The loss function of DeepRF
consists of the slice profile and SAR terms. b) In DeepRF-Grad, z-gradient is
also designed simultaneously with an RF pulse. A slew rate term is added to the
loss function.
-
Multi-scale Accelerated Auto-differentiable Bloch-simulation based joint design of excitation RF and gradient waveforms.
Tianrui Luo1, Douglas C. Noll1, Jeffrey A. Fessler1, and Jon-Fredrik Nielsen1
1University of Michigan, Ann Arbor, MI, United States
We accelerated an auto-differentiable Bloch-simulator based joint RF and gradient design algorithm with a two stage strategy: 1) fast coarse dwell time design; 2) fine dwell time tuning. It substantially shortens designs, enabling such approaches for online applications.
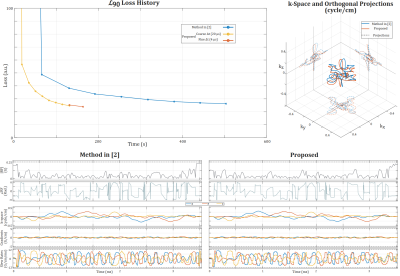
Comparison of designs on outer volume excitation objective (OV90). Our proposed method is much faster than the method in [2] (3 min vs 8.5 min). The optimized pulse waveforms and the k-space trajectory resemble that of method [2].
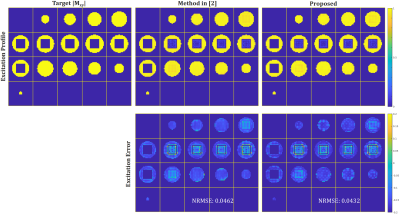
Comparison of simulated excitation profiles for the pulses in Fig. 2. The goal is to excite only the spins in the outer volume. In terms of NRMSE, our proposed method performance is slightly better than that of method [2].
-
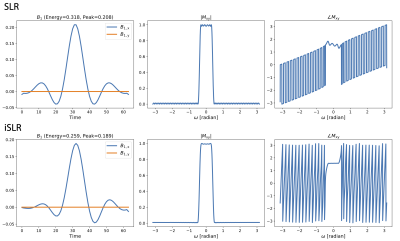
Consistency, ablation, and scalability studies of DeepRF
Dongmyung Shin1, Jiye Kim1, Juhyung Park1, and Jongho Lee1
1Electrical and Computer Engineering, Seoul National University, Seoul, Korea, Republic of
A neural net powered RF design, DeepRF, is investigated. The consistency of the method is confirmed by repeating the same design. The importance of the two modules, generation and refinement, is verified through the ablation. The scalability is validated by changing a design parameter.
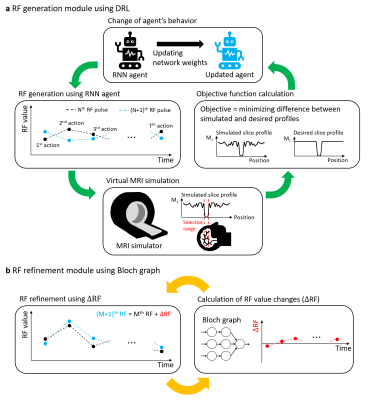
An overview of DeepRF. (a) In the RF generation module, a series of RF values (i.e., actions) are generated from the RNN agent to shape an RF envelope (Nth RF), and the virtual MRI simulates a slice profile. Then, a value of the objective function (e.g., a difference between simulated and desired profiles) is calculated from which the agent changes its behavior to generate a next RF pulse ((N+1)th RF). (b) In the RF refinement module, an RF pulse is refined (Mth RF to (M+1)th RF) with respect to the objective function using RF value changes (∆RF) calculated from the Bloch graph.
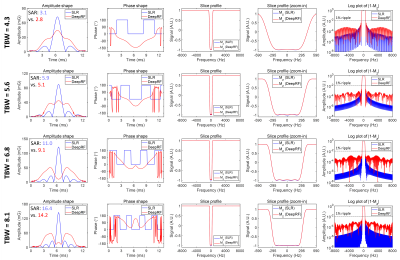
The results of the DeepRF and SLR pulse designs with different TBWs (4.3, 5.6, 6.8, and 8.1). For all the designs, the pulse shapes of the DeepRF pulses are clearly different from those of the SLR pulses (1st and 2nd columns). The slice profiles from the DeepRF and SLR pulses are almost identical (3rd and 4th columns). The SARs of the DeepRF pulses are smaller than those of the SLR pulses in all TBWs (1st column).
-
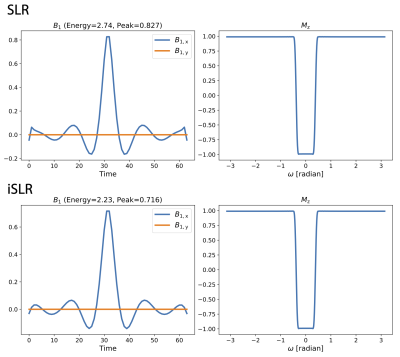
Exploring RF pulse design with deep reinforcement learning
Xiaodong Ma1, Kamil Uğurbil1, and Xiaoping Wu1
1Center for Magnetic Resonance Research, Radiology, Medical School, University of Minnesota, Minneapolis, MN, United States
We expand the application of a deep reinforcement learning (DRL) pulse design framework to designing basic RF pulses and multi-band pulses. The DRL framework can be used to effectively design all types of RF pulses, improving slice profiles with reduced ripple in comparison to SLR.
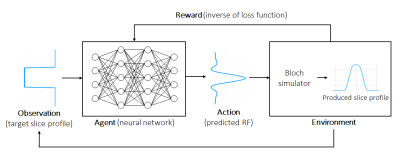
Fig.1. The deep reinforcement learning (DRL)
pulse design framework. In a forward pass, the neural network takes the input
target slice profile and outputs the predicted RF pulse. The Bloch simulator
embedded in the system gives the produced slice profile, which in turn is used
(along with the target slice profile) to evaluate the loss. In a backward pass,
the gradient of the loss with respect to the weights of the neural network are
calculated using backpropagation to update the neural network. The procedures
described above are iterated during the training.
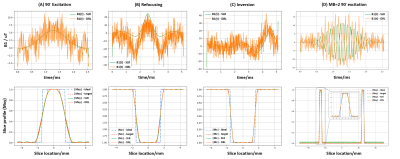
Fig.5. Comparison of the SLR algorithm vs our
DRL method when used to design (A) 90◦
excitation, (B) refocusing, (C) inversion and (D) 90◦ excitation multiband (MB=2, gap=50 mm)
pulses. For each scenario a separate neural network was trained. Note that
despite larger fluctuation observed in the predicted RF pulse, our DRL method
led to visually comparable slice profiles for refocusing and inversion, while
improving slice profiles for single band and multiband excitation pulses with
noticeable suppression of stopband ripples.
-
RF Pulse Designs for Velocity-Selective MRA at Low Field Strengths
Ziwei Zhao1, Nam G. Lee2, and Krishna S. Nayak1,2
1Ming Hsieh Department of Electrical and Computer Engineering, Viterbi School of Engineering, University of Southern California, Los Angeles, CA, United States, 2Department of Biomedical Engineering, Viterbi School of Engineering, University of Southern California, Los Angeles, CA, United States
Simulations indicate that velocity-selective RF pulses for intracranial MRA achieve comparable performance at 0.55T compared to 3T. We anticipate 50%-60% reduced signal loss and/or 22%-38% sharper velocity selection, potentially improving the detection of slow flow and distal vessels.
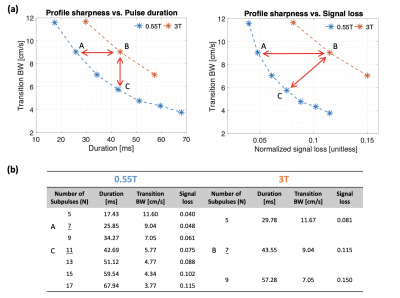
Figure 2. Pulse Performance Tradeoff. (a) Velocity profile sharpness vs. pulse duration (left) and signal loss (right) with (b) detailed parameters of plotted designs. T1 and T2 values were used as 1121ms, 263ms at 0.55T; and 1650ms, 150ms at 3T, respectively. Normalized signal loss is defined as (M0-Mz)/M0. Note that 0.55T system (blue) shows higher fidelities of tradeoffs. The RF and gradient waveforms of two representative designs (marked “A” and “B” asterisks) are plotted in Figure 1.
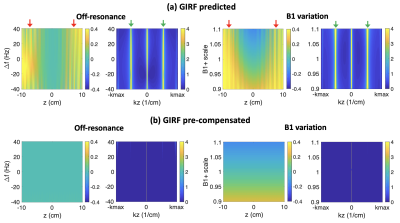
Figure 4. Impact of gradient distortions and pre-compensation. (a) GIRF predicted excitation profiles as a function of ∆f and B1+ scale. (b) GIRF pre-compensated profiles. Notice that stripe artifacts appear as spatial modulations (red arrows) and as sidelobe peaks (green arrows) in (a). These are completely resolved in (b) by using GIRF-based pre-compensation.
-
Improved B0 mapping with universal parallel transmit pulses at 7 tesla
Jürgen Herrler1, Patrick Liebig2, Rene Gumbrecht2, Sydney Nicole Williams3, Christian Meixner4, Andreas Maier5, Arnd Dörfler1, and Armin Michael Nagel4
1Institue of Neuroradiology, University Hospital Erlangen, Erlangen, Germany, 2SIEMENS Healthineers, Erlangen, Germany, 3Imaging Centre of Excellence, University of Glasgow, Glasgow, Scotland, 4Institue of Radiology, University Hospital Erlangen, Erlangen, Germany, 5Friedrich Alexander University Erlangen Nürnberg, Erlangen, Germany
A universal parallel transmit (pTx) pulse was used in a B0 mapping sequence. This lead to different values in the resulting B0 maps, mainly at tissue interfaces. When used for the design of a pTx inversion pulse, these differences lead to reduced B0 artifacts in the corresponding sequence.
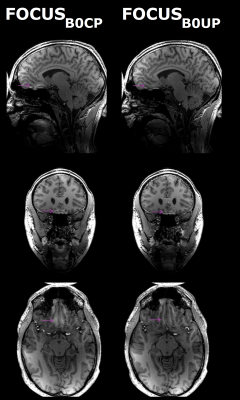
Figure 4 MPRAGE images using
FOCUS pTx pulses, based on B0 maps, which were acquired with either
a CP pulse or a UP. The purple arrows indicate B0 related artifacts,
which were weakened when using the UP-improved B0 mapping for designing the pTx inversion pulse. Different
behavior of the excitation pulses could not be observed.
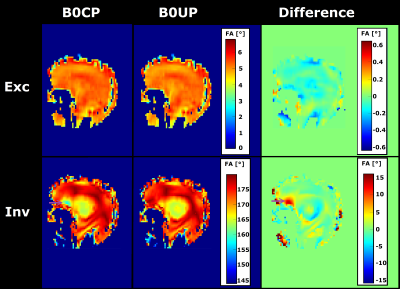
Figure 3 FA simulations of FOCUS
excitation (Exc) and inversion (Inv) pulses using either the B0 map
acquired with a CP pulse (B0CP) or a UP (B0UP), as well as the difference maps
(‘UP case – CP case’). All Bloch simulations were performed using the B0
map acquired with the UP. B0 maps acquired with CP pulses may lead
to a worse performance of the FOCUS inversion pulse, especially in the sinus region (purple
arrow).
-
Universal parallel transmit pulses for a 2-dimensional local excitation target pattern at 9.4T
Ole Geldschläger1, Dario Bosch1,2, and Anke Henning1,3
1High-field Magnetic Resonance, Max-Planck-Institute for biological Cybernetics, Tübingen, Germany, 2Biomedical Magnetic Resonance, University Hospital Tübingen, Tübingen, Germany, 3Advanced Imaging Research Center, University of Texas Southwestern Medical Center, Dallas, TX, United States
The ‘Universal pTx Pulse’ concept for local excitation
pulses was applied in vivo at 9.4T. Universal pulses for a 2D local excitation
target pattern were designed. In line with
previous findings for whole-brain excitation pulses they perform just
slightly worse compared to the tailored pulses.
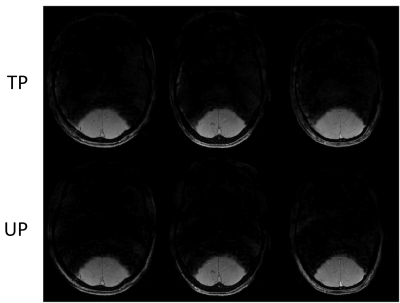
Figure 4: 9.4T T2*-weighted GRE acquisitions (voxel
size: 0.8x0.8x0.8 mm3, matrix size: 224x280, TR = 18 ms, TE = 8ms)
from the three non-database heads. Once, the respective TPs (FA7) were applied,
once the UP (FA7) was applied.
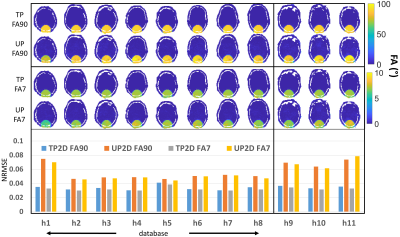
Figure 3: Bloch
simulated FA profiles of the TPs for FA90 (first line of profiles), UP2D for
FA90 (second line), the TPs for FA7 (third line) and UP2D for FA7 (fourth
line). The eight columns on the left present the database heads. The three
columns on the right present the non-database heads. The bar plot below the
profiles illustrates the NRMSEs for each pulse and head.
-
Spatial localisation for mapping regional oxygen extraction fraction using parallel transmission saturation pulses at 7 T
Yan Tong1, Peter Jezzard1, Caitlin O'Brien1,2, and William T Clarke1
1Wellcome Centre for Integrative Neuroimaging, FMRIB Division, NDCN, University of Oxford, Oxford, United Kingdom, 2Guy's and St Thomas' NHS Foundation Trust, London, United Kingdom
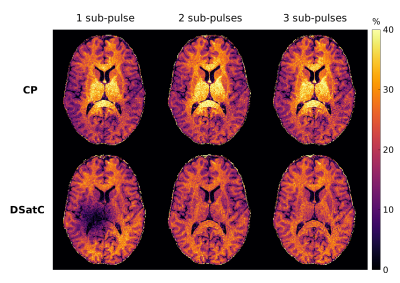
A parallel transmission RF pulse design is presented to measure regional oxygen extraction fraction at 7 T based on the TRUST method. Initial phantom results showed the feasibility of the method, but further in vivo studies are needed for the validation of this approach.
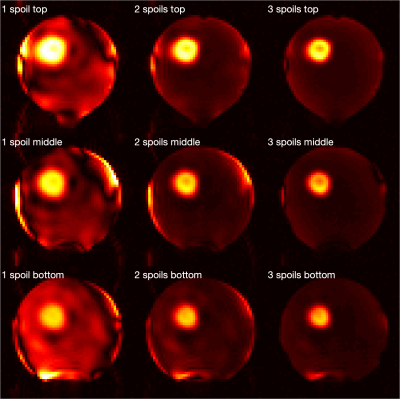
EPI images acquired on an oil phantom with a pulse voltage of 180V and different numbers of repetitions of the saturation module. The left, middle, and right columns show 1, 2, and 3 repetitions of the saturation module, respectively. The bottom, middle, top rows show images acquired at the bottom, in the middle, and at the top of the inversion slab, respectively.
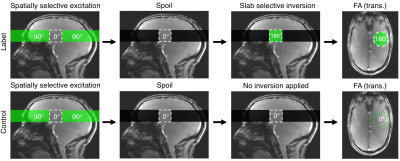
Schematic of the labelling strategies for the proposed method. A cylindrical ROI is chosen.