-
Characterization of placental contractions in healthy pregnancies
Neele S Dellschaft1, Rachel Allcock1, Jana Hutter2, Lopa Leach3, Nia Jones4, and Penny Gowland1
1Sir Peter Mansfield Imaging Centre, University of Nottingham, Nottingham, United Kingdom, 2Department of Perinatal Imaging and Health, King's College London, London, United Kingdom, 3Life Sciences, University of Nottingham, Nottingham, United Kingdom, 4Division of Child Health, Obstetrics and Gynaecology, University of Nottingham, Nottingham, United Kingdom
Observed on T2*-weighted scans, contractions with (placental pump) and
without (Braxton-Hicks) reduction in placental volume share many
characteristics. A reduction in intensity is preceded by a change in placental
shape, with thickening of the underlying uterine wall in half the cases.
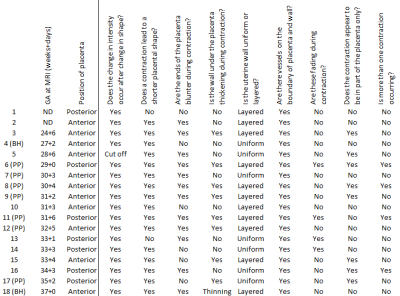
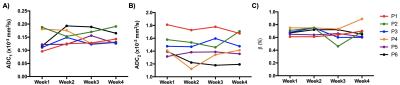
Fig
1:
Summary of findings in contractions, sorted by ascending gestational age
at scan (ND, no data for gestational age). In cases where placental volumes have
currently been measured, contractions were defined as placental pump, PP, if
contraction was accompanied by a reduction in placental volume, Braxton-Hicks,
BH, if there was no change. In subject 5, changes at the start of the
contraction could not be assessed because they had already occurred at the
start of the scan (‘cut off’).
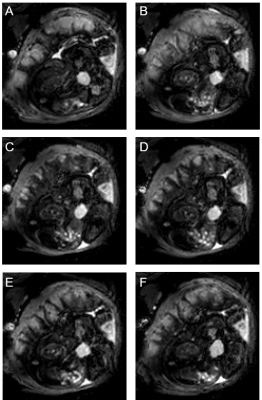
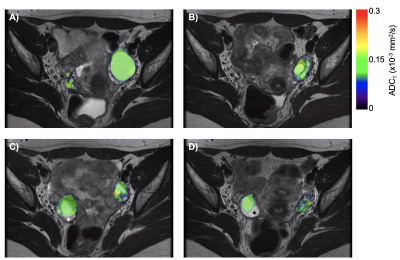
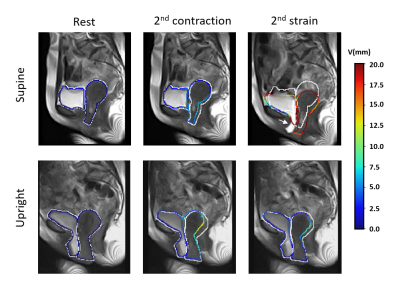
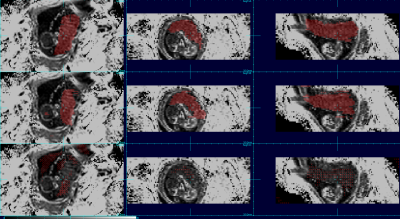
Fig 5: Typical
progression of hypointense signal during a contraction. A) before the
contraction, B) shape has started changing, thin dark lines across placenta (37
seconds after A), C) placenta is fully contracted, almost completely dark
besides some area near basal plate (72 s after A), D) dark pattern remains
longest on side of chorionic plate (82 s after A), E) pattern has faded except
for thin lines outlining cotyledons (118 s after A), F) returned to relaxed
state (179 s after A).
-
Volumetric fetal flow imaging with rapid multislice multidimensional radial phase contrast MRI
Datta Singh Goolaub1,2, Jiawei Xu3, Eric Schrauben4, Davide Marini5, Mike Seed5,6, and Christopher Macgowan1,2
1Medical Biophysics, University of Toronto, Toronto, ON, Canada, 2Translational Medicine, The Hospital for Sick Children, Toronto, ON, Canada, 3Labatt Family Heart Centre, The Hospital for Sick Children, Toronto, ON, Canada, 4Radiology & Nuclear Medicine, Amsterdam University Medical Centers, Amsterdam, Netherlands, 5Pediatric Cardiology, The Hospital for Sick Children, Toronto, ON, Canada, 6Department of Pediatrics, University of Toronto, Toronto, ON, Canada
4D flow of the fetal cardiac
vasculature using PCMRI is developed and shown to agree with conventional
imaging. Detailed visualization of complex fetal hemodynamics is presented.
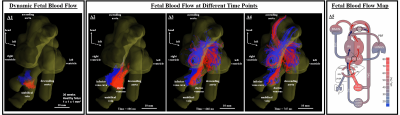
Tracking
inferior vena cava (IVC) and ductus venosus (DV) blood flow across the fetal
heart. (A1) Dynamic coronal view. (A2-A4) Particle traces,
released from the IVC (blue) and DV (red), at different phases of the cardiac
cycle. Parallel streams from the IVC and DV enter the right atrium (A2),
with oxygenated blood from the DV preferential shunted into the left ventricle
(A3) to supply the coronary and cerebral circulations (A4). (A5)
Corresponding flow map, colored by hypothetical oxygenation.
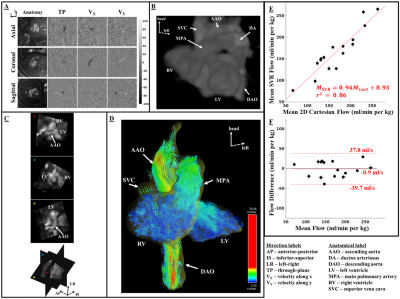
Fetal reconstructions and flow comparisons. (A)
Axial, coronal, and sagittal slices. (B) 3D rendering of slice-to-volume
reconstruction (SVR). (C) Oblique slices from reconstructed volume using
SVR. (D) Coronal view of systolic particle tracking from SVR flow.
Comparison between mean flow measurements from SVR and 2D Cartesian flow: (E)
Linear regression with red line depicting the best fit to the data and (F)
Bland-Altman plot comparing the mean flows.
-
Longitudinal Placental Blood Volume Measurements on Zika-Infected Rhesus Macaques Using Variable Flip Angle T1 Mapping
Ruiming Chen1, Sydney Nguyen2,3,4, Megan E. Murphy2,3,4, Kathleen M. Anthony2,3,4, Terry K. Morgan5, Philip Corrado1, Sean B. Fain1,6, Dinesh M. Shah7, Ronald R. Magness8, Thaddeus Golos2,3,4, Oliver Wieben1,6,9, and Kevin M. Johnson1,9
1Medical Physics, University of Wisconsin - Madison, Madison, WI, United States, 2Wisconsin National Primate Research Center, University of Wisconsin - Madison, Madison, WI, United States, 3Comparative Biosciences, University of Wisconsin - Madison, Madison, WI, United States, 4Obstetrics & Gynecology, University of Wisconsin - Madison, Madison, WI, United States, 5Pathology, Oregon Health & Science University, Portland, OR, United States, 6Biomedical Engineering, University of Wisconsin - Madison, Madison, WI, United States, 7Obstetrics and Gynecology, University of Wisconsin - Madison, Madison, WI, United States, 8Obstetrics and Gynecology, University of South Florida, Tampa, FL, United States, 9Radiology, University of Wisconsin - Madison, Madison, WI, United States
Results show regional heterogeneity in fractional blood volume and increase of maternal placental blood volume throughout gestation ages.
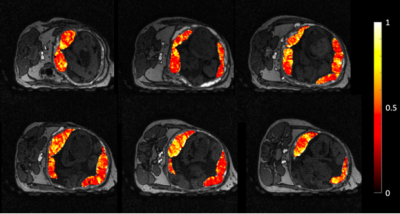
Figure 2. Representative FBV distribution for a control rhesus macaque. FBV ranges from 0 to 1, with 1 being 100% blood in certain placental regions. FBV exhibits regional heterogeneity, similar to heterogeneous perfusion [7].
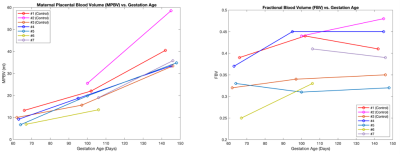
Figure 3. Measurements of maternal placental blood volume (MPBV) and fractional blood volume (FBV) as a function of gestational age. MPBV shows constant increase throughout pregnancy; FBV exhibits a more heterogeneous trend, with higher relative change from first to second gestational age time point.
-
Velocity-Selective Arterial Spin Labeling Perfusion Measurements in 2nd Trimester Human Placenta with Varying BMI
Daniel Seiter1, Ruiming Chen1, Kai Ludwig1, Ante Zhu2, Dinesh Shah3, Oliver Wieben1,4, and Kevin Johnson1,4,5
1Medical Physics, University of Wisconsin-Madison, Madison, WI, United States, 2GE Global Research, Niskayuna, NY, United States, 3Obstetrics and Gynecology, University of Wisconsin-Madison, Madison, WI, United States, 4Radiology, University of Wisconsin-Madison, Madison, WI, United States, 5Biomedical Engineering, University of Madison-Wisconsin, Madison, WI, United States
Using analysis of placental VS-ASL MRI, a
statistically significant increase in placental perfusion with BMI is shown in
human subjects (n=71). Novel longitudinal data of placental perfusion is presented.
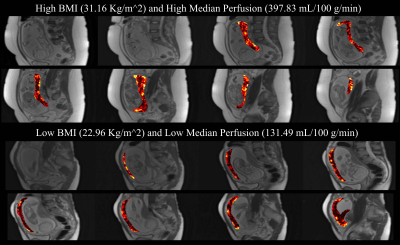
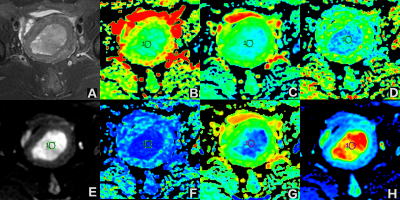
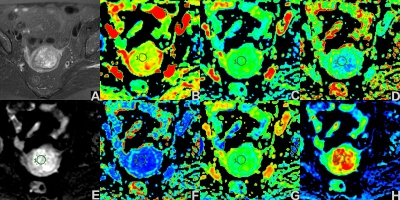
Figure 2. Placental perfusion maps overlaid onto
the reference M0 scans for two subjects, illustrating the difference between high perfusion with high BMI (top, 397.83 mL/100 mg/min, BMI = 31.16 kg/m2) and low
perfusion with low BMI (bottom, 131.49 mL/100 mg/min, BMI = 22.96 kg/m2).
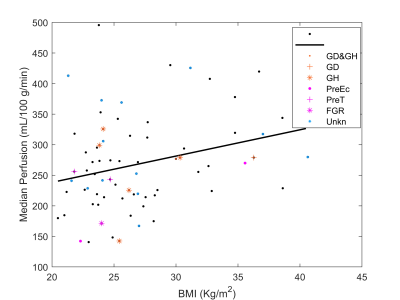
Figure 3. Regression analysis of perfusion and BMI,
demonstrating a statistically significant positive relationship. (R2
= 0.076, p = 0.020) Adverse maternal outcomes are marked: Gestational diabetes
(GD), gestational hypertension (GH), preeclampsia (PrE), preterm labor
(preterm), and fetal growth restriction (FGR). If outcome data was not
available for a case, the data point is plotted as unknown (Unkn). The relationship between
maternal outcomes and perfusion will be investigated in a later work.
-
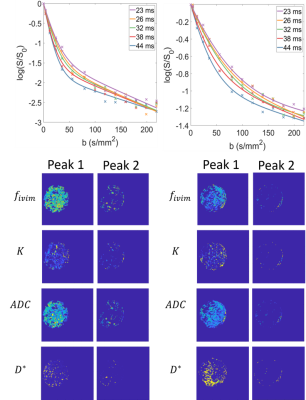
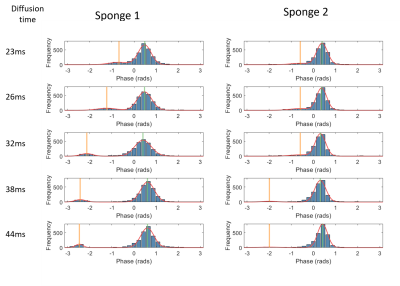
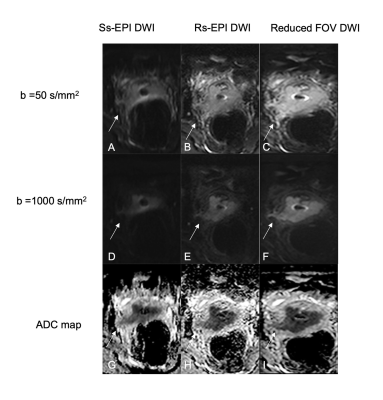
Detecting abnormal placental microvascular flow based on flow-compensated and non-compensated intravoxel incoherent motion imaging
Yuhao Liao1, Taotao Sun2,3, Ling Jiang2,3, Zhiyong Zhao1, Tingting Liu1, Zhaoxia Qian2,3, Yi Sun4, Yi Zhang1, and Dan Wu1
1Key Laboratory for Biomedical Engineering of Ministry of Education, Department of Biomedical Engineering, College of Biomedical Engineering & Instrument Science, Zhejiang University, Hangzhou, China, 2Department of Radiology, International Peace Maternity and Child Health Hospital, School of Medicine, Shanghai Jiao Tong University, Shanghai, China, 3Shanghai Key Laboratory of Embryo Original Diseases, Shanghai, China, 4MR Collaboration, Siemens Healthcare China, Shanghai, China
We proposed a joint analysis of flow-compensated
(FC) and non-compensated (NC) diffusion MRI to estimate the fraction
and velocity of ballistic microcirculatory flow, and evaluated the diagnostic
performance of the new IVIM markers in maternal and fetal disorders associated with placenta.
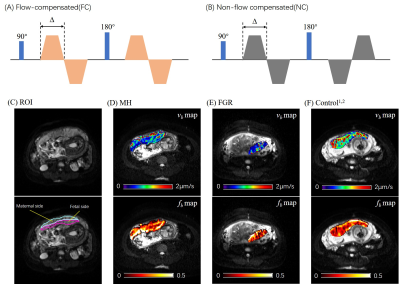
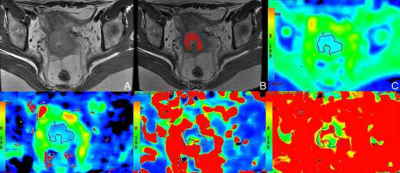
Figure 1. (A-B) Diagrams of the FC and
NC diffusion-encoding gradients with a diffusion duration of ∆. (C) Definition
of the maternal and fetal ROIs of the placenta overlaid on the b0 image. (D-F)
Representative fb and vb maps of the placenta from
a maternal hyperglycemia (MH) patient (D), a fetal growth restriction (FGR)
patient (E), and a normal control (F).
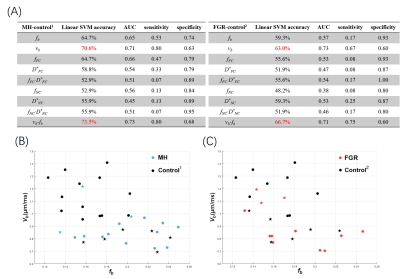
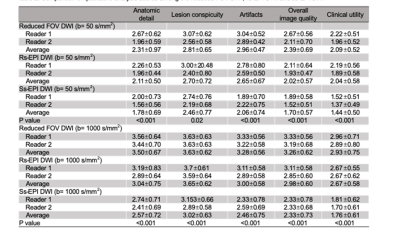
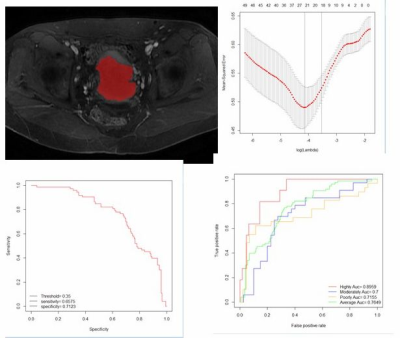
Figure 3. (A) The classification accuracy, AUC, sensitivity, and specificity of each
IVIM parameter and their combinations (as features in classification), based on
a linear SVM with five-fold cross validation. The combination of fb and vb from NC-FC model showed the best performance. (B-C) The
classification between MH and Control1 (B) and between FGR and
Control2 (C) in the two-dimensional feature space of vb-fb. The dots represent correctly identified cases, and
stars represented mis-classified cases by SVM.
-
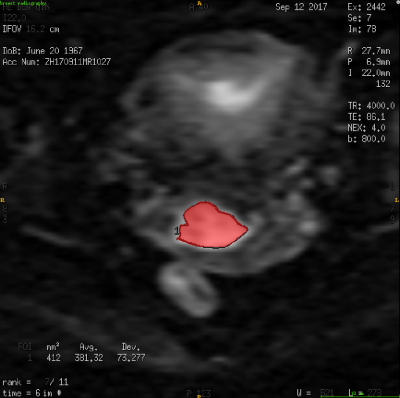
Comparison of Pure Deep Learning Approaches for Placental Extraction from Dynamic Functional MRI sequences between 19 and 37 Gestational Weeks.
Bryan Quah1, Anna Dong1, Neil Rao1, Patrick Hoang1, Michael Hirano1, Manjiri K. Dighe1, and Colin Studholme1
1University of Washington, Seattle, WA, United States
We investigate 4 data schemes: full 3D images, full 2D slices, 3D patches and 2D patches on our dataset of 68 3D R2* images and train a fully automated U-Net model for the task of placenta tissue segmentation to find out the effectiveness of such approaches.
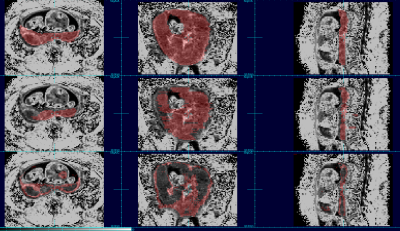
28 week old subject with labeled placenta tissue maps. (Top row: reference label map, Middle row: map generated by model trained on full 2D scheme, Bottom row: map generated by model trained on full 3D scheme.)
19 week old subject with labeled placenta tissue maps. (Top row: reference label map, Middle row: map generated by model trained on full 2D scheme, Bottom row: map generated by model trained on full 3D scheme.)
-
APPLAUSE: Automatic Prediction of PLAcental health via U-net Segmentation and statistical Evaluation
Maximilian Pietsch1, Alison Ho2, Alessia Bardanzellu1, Aya Zeydan1, Joseph V Hajnal3, Lucy Chappell2, Mary A Rutherford3, and Jana Hutter1,4
1Centre for Medical Engineering, King's College London, London, United Kingdom, 2Women's Health, King's College London, London, United Kingdom, 3King's College London, London, United Kingdom, 4Centre for the Developing Brain, King's College London, London, United Kingdom
Fully automatic artificial-intelligence population-based quantification of placental maturation and health from a rapid 30sec functional Magnetic Resonance scan is shown in >100 women to correlate with low birth weights, spontaneous premature birth and histopathological results.
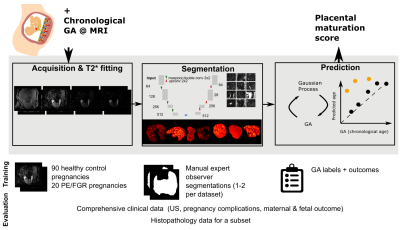
Figure 1: The proposed pipeline for the automatic placental maturation assessment is depicted consisting of the data acquisition, automatic segmentation used to calculate the placental mean T2* and the Gaussian Process regression fit or prediction, which is used to characterize placental health. All parts are discussed in the methods section.
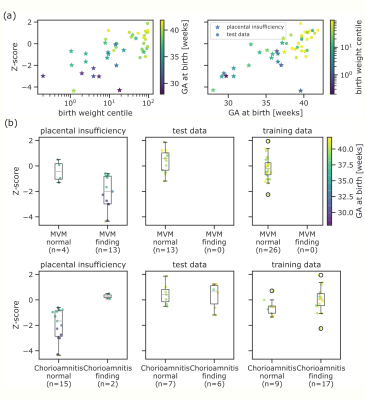
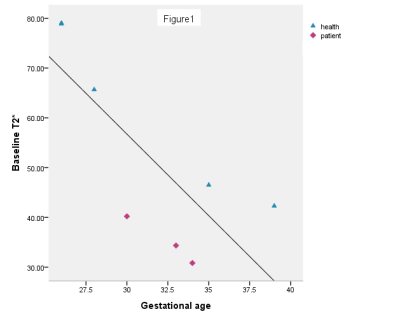
Figure 5: Top: The placental health Z-scores are strongly related with degree of prematurity measured as GA at birth (right) and extremely low birth weight centile (left). Bottom: Z-scores grouped by histopathological examination results color-coded by GA at birth. Participants with maternal vascular malperfusion (MVM) exhibit lower Z-scores and belong to the group delivered prematurely. Chorioamnionitis does not affect Z-scores in control cases but seems to correlate to normal Z-scores in high-risk participants.
-
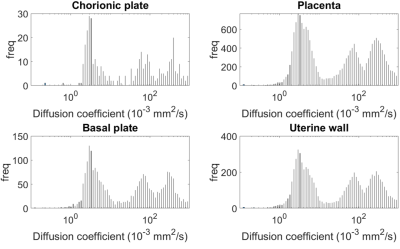
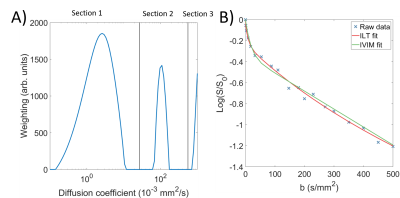
Quantifying Placental Structure and Function in Healthy and Compromised Pregnancies with Combined T2*-diffusion
Paddy J. Slator1, Jana Hutter2,3, Razvan V. Marinescu1, Marco Palombo1, Laurence Jackson2,3, Alison Ho4, Lucy C Chappell4, Mary Rutherford2, Joseph V Hajnal2,3, and Daniel Alexander1
1Centre for Medical Image Computing, Department of Computer Science, University College London, London, United Kingdom, 2Centre for the Developing Brain, School of Biomedical Engineering and Imaging Sciences, King's College London, London, United Kingdom, 3Biomedical Engineering Department, School of Biomedical Engineering and Imaging Sciences, King's College London, London, United Kingdom, 4Women’s Health Department, King's College London, London, United Kingdom
We apply a data-driven method for quantitative MRI analysis to combined T2*-diffusion placental MRI scans, showing that this approach can identify fine-grained placental
microenvironments
and quantify
placental dysfunction
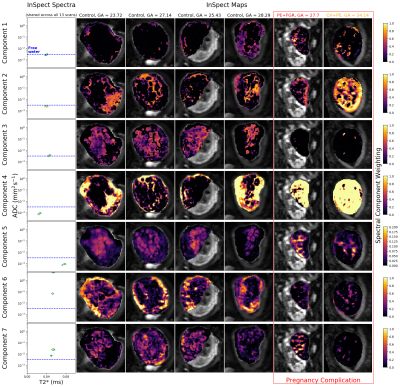
Figure 3: Seven-component InSpect run on 13 placenta diffusion-relaxometry scans. The leftmost boxes display the canonical spectral components, shared across all 13 participants. The remaining boxes show the corresponding component weighting maps for 6 of the 13 scans, with each column displaying a single participant’s maps (see Figure 4 for the remaining 7 maps). Two participants had been diagnosed with a pregnancy complication at scan time (red outline). Note that the final columns of this Figure and Figure 4 display maps for the same participant, scanned twice, four weeks apart.
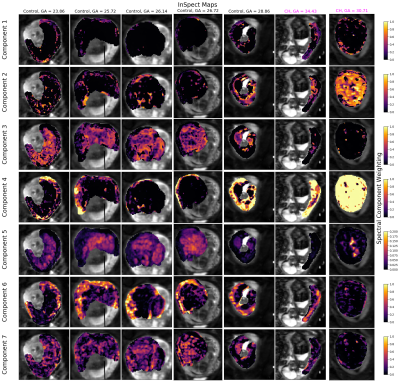
Figure 4: InSpect maps for the 7 participants not shown in figure 3 from the seven-component InSpect run on 13 placenta diffusion-relaxometry scans. Each row displays maps for a single canonical spectral component - see first column of Figure 3 for the corresponding spectra. Columns display the maps for a single scan. Note that the final column in Figures 3 and 4 displays maps for the same participant, scanned twice.
-
Continuous 4D atlas of normal fetal lung development and automated CNN-based lung volumetry for motion-corrected fetal body MRI
Alena Uus1, Irina Grigorescu1, Aditi Shetty1, Alexia Egloff Collado2, Joseph Davidson3,4, Milou van Poppel1,5, Johannes Steinweg2, Lisa Story2, Michael Aertsen6,7, Jan Deprest8, Jim Carmichael9, Joseph V Hajnal1,2, Mary Rutherford2, and Maria Deprez1
1Biomedical Engineering Department, School of Biomedical Engineering and Imaging Sciences, King's College London, London, United Kingdom, 2Centre for the Developing Brain, School of Biomedical Engineering and Imaging Sciences, King's College London, London, United Kingdom, 3Prenatal Cell and Gene Therapy, Elizabeth Garrett Anderson Institute of Women’s Health, University College London, London, United Kingdom, 4Stem Cells and Regenerative Medicine, GOS-UCL Institute of Child Health, London, United Kingdom, 5Department of Congenital Heart Disease, Evelina Children’s Hospital, London, United Kingdom, 6Department of Radiology, University Hospitals Leuven, Leuven, Belgium, 7Department of Imaging and Pathology, Biomedical Sciences, KU Leuven, Leuven, Belgium, 8Department of Obstetrics, University Hospitals KU Leuven, Leuven, Belgium, 9Paediatric Radiology, Evelina London Children’s Hospital, London, United Kingdom
This work presents a continuous 4D atlas of fetal lung development within 22-32 weeks gestational age (GA) generated from ~130 fetal MRI datasets. It also includes growth charts for fetal MRI lung indices and an automated method for fetal lung volumetry based on 3D CNN segmentation.
Generated continuous 4D atlas of the fetal thorax development during [22; 32] weeks GA range (0.5mm isotropic resolution).
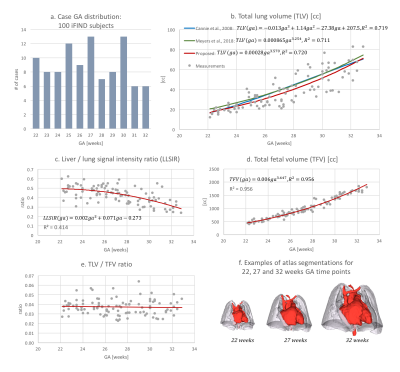
Lung growth charts for 100 fetuses without reported anomalies scanned during [22; 32] weeks GA period (a). The extracted indices include: (b) total lung volume (TLV) in comparison to the Cannie’s, 2008 [3] Meyers’s, 2018 [4] formulas; (c) liver to lung signal intensity ratio (LLSiR); (d) total fetal volume (TFV); (e) TLV/TFV ratio. There is a clear correlation between TLV, LSSiR and TFV, which the TLV/TFV values are independant. The 3D models of the fetal lungs and hearts segmented from the 4D atlas at 22, 27 and 32 weeks GA time points are shown in (f).
-
Automatic fetal ocular measurements in MRI
Netanell Avisdris1,2, Daphna Link-Sourani2, Liat Ben-Sira3,4,5, Leo Joskowicz1, Elka Miller6, and Dafna Ben-Bashat2,3,5
1School of computer science and engineering, Hebrew University of Jerusalem, Jerusalem, Israel, 2Sagol Brain Institute, Tel Aviv Sourasky Medical Center, Tel Aviv, Israel, 3Sagol School of Neuroscience, Tel Aviv University, Tel Aviv, Israel, 4Division of Pediatric Radiology, Tel Aviv Sourasky Medical Center, Tel Aviv, Israel, 5Sackler Faculty of Medicine, Tel Aviv University, Tel Aviv, Israel, 6Medical Imaging, Children's Hospital of Eastern Ontario, University of Ottawa, Ottawa, ON, Canada
A novel automatic method for in-vivo fetal ocular
measurements in MRI is described. Experimental results indicate that our method
matches within <1mm manual expert neuro-radiologist annotations.
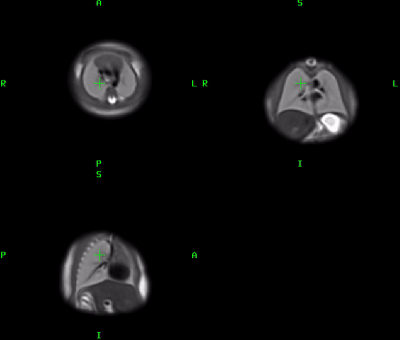
Figure 2: Illustration of the
method. The input is fetal T2 weighted volume. (1) Brain ROI
computation using 3D CNN; (2) Segmentation of the orbits for 2D
and 3D measurements using 2D U-Net; (3) Segmentation of lens and
globe for OD-LA (ocular diameter lens aligned) measurement using 2D U-Net; (4) Ocular measurements
using geometric algorithms.
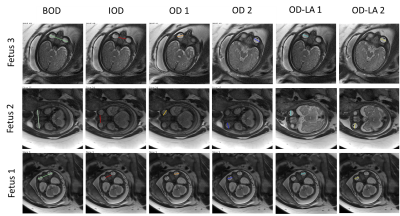
Figure 3: Representative examples of
automatic ocular fetal 2D measurements for three fetuses. OD measurements are
presented for both eyes (OD 1 and 2). Note that the algorithm may choose a different slice for each measurement (for example, IOD, OD1 and OD2 of fetus
3).