-
FAST 3D vs. Compressed Sensing vs. Parallel Imaging: Image Quality Improvement on MRCP with and without Deep Learning Reconstruction
Takahiro Matsuyama1, Yoshiharu Ohno1,2, Kaori Yamamoto3, Kazuhiro Murayama2, Masato Ikedo3, Masao Yui3, Akiyoshi Iwase4, Takashi Fukuba4, Satomu Hanamatsu1, Yuki Obama1, Takahiro Ueda1, Hirotaka Ikeda1, and Hiroshi Toyama1
1Radiology, Fujita Health University School of Medicine, Toyoake, Japan, 2Joint Research Laboratory of Advanced Medical Imaging, Fujita Health University School of Medicine, Toyoake, Japan, 3Canon Medical Systems Corporation, Otawara, Japan, 4Radiology, Fujita Health University Hospital, Toyoake, Japan
DLR method (AiCE) can significantly improve
image quality of MRCP at all protocols.
Image quality of FAST 3D is superior to that of Compressed SPEEDER and
considered as compatible with conventional SPEEDR on MRCP.
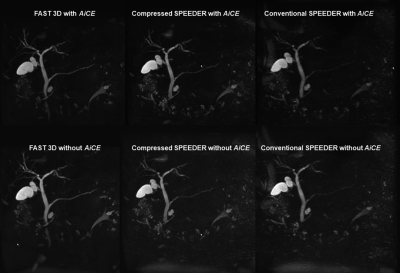
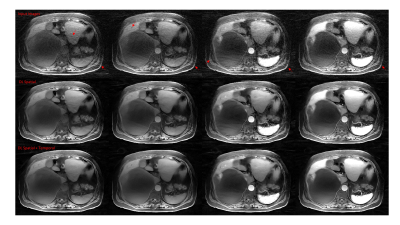
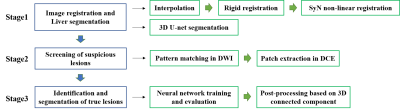
Figure 1. 71-year
old patient with intraductal papillary mucinous neoplasm.
(First
line from L to R: MRCPFAST 3D with AiCE, MRCPCompressed SPEEDER
with AiCE and MRCPconventional SPEEDER with AiCE; second
line from L to R: MRCPFAST 3D without AiCE, MRCPCompressed
SPEEDER without AiCE and MRCPconventional SPEEDER
without AiCE).
MRCPFAST
3D and MRCPconventional SPEEDER more clearly depict
intrahepatic bile duct as well as main pancreatic duct than MRCPCompressed
SPEEDER, when applied AiCE or not.
In addition, AiCE was able to improve image quality of MRCP obtained
by each technique.
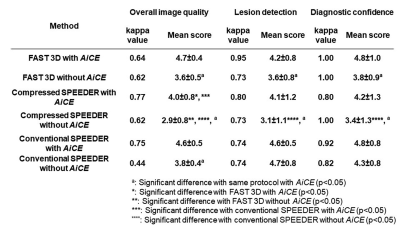
Figure 4. Compared results of interobserver
agreement and qualitative image qualities among all methods.
Interobserver agreement on each method was
ranged between 0.44 and 0.77. When
applied AiCE, each index on MRCP
obtained by each technique and reconstructed with AiCE were
significantly higher than those without AiCE (p<0.05). On each index, MRCPCompressed SPEEDER
with and without AiCE were significantly lower than MRCPFAST 3D
or MRCPconventional SPEEDER with and without AiCE
(p<0.05).
-
The value of radiomics-based model on contrast-enhanced MRI for predicting microvascular invasion in HCC before Partial Hepatectomy
Tao Lin1, Ailian Liu1, Lihua Chen1, Qingwei Song1, Renwang Pu1, Ying Zhao1, Xue Ren1, and yan guo2
1Department of Radiology, the First Affiliated Hospital of Dalian Medical University, Dalian, China, 2GE Healthcare, Beijing, China
Based on enhanced MRI images, we established an radiomics model to predict microvascular invasion of hepatocellular carcinoma, contributing to precise decisions regarding treatment.
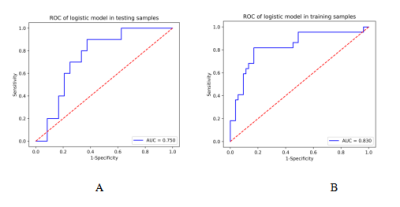
Figure1. Receiver operating characteristic curves (ROC) of the training (A) and validation (B) cohort. AUC, area under the receiver operating characteristic curve.
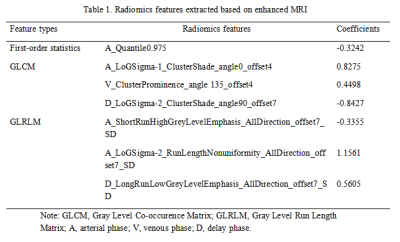
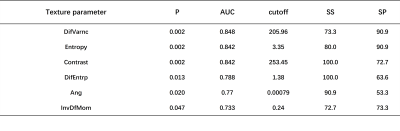
Table 1. Radiomics features extracted based on enhanced MRI
-
Deep learning-based detection of liver disease using MRI
Mark A Pinnock1,2, Yipeng Hu1,2, Alan Bainbridge3, David Atkinson4, Rajeshwar P Mookerjee5, Stuart A Taylor4, Dean C Barratt1,2, and Manil D Chouhan4
1Centre for Medical Image Computing, University College London, London, United Kingdom, 2Wellcome/EPSRC Centre for Interventional and Surgical Sciences, University College London, London, United Kingdom, 3Department of Medical Physics and Biomedical Engineering, University College London Hospitals NHS Foundation Trust, London, United Kingdom, 4Centre for Medical Imaging, Division of Medicine, University College London, London, United Kingdom, 5Institute for Liver and Digestive Health, Division of Medicine, University College London, London, United Kingdom
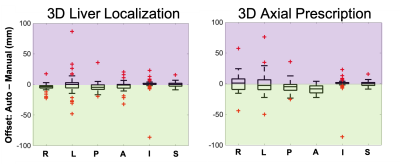
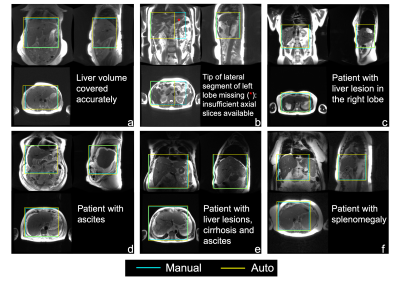
Deep learning-based detection of liver disease from
T2-weighted MRI sequences/relevant organ segmentation mask only is feasible.
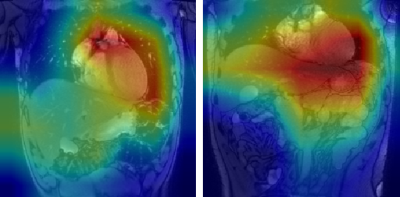
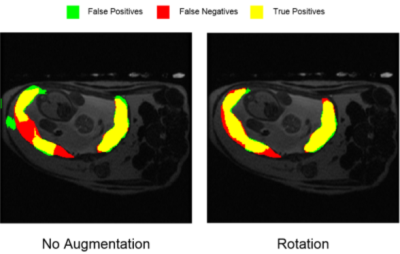
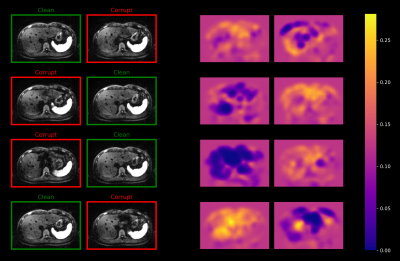
Figure 1: GradCAM visualisations for two false positive classifications
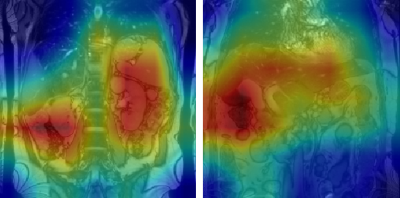
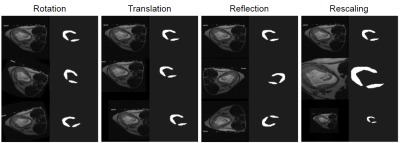
Figure 2: GradCAM visualisations for two true positive classifications
-
A Two-Stage Deep Learning Model for Accurate Vessel Segmentation and Reconstruction in the MRI of Live
Xu Luo1,2, Ailian Liu3, Yu Yao1,2, Ying Zhao3, Zhebin Chen1,2, Meng Dou1,2, and Han Wen1,2
1Chengdu Institute of Computer Application, Chinese Academy of Sciences, Chengdu, China, 2University of Chinese Academy of Sciences, Beijing, China, 3Department of Radiology, the First Affiliated Hospital of Dalian Medical University, Dalian, China
We use a two-stage segmentation method to complete the segmentation of intrahepatic portal vein, and complete the volume calculation and three-dimensional reconstruction of intrahepatic portal vein
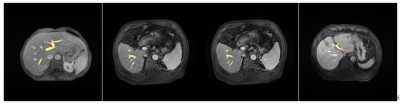
Figure 3:
Visualization of segmentation results
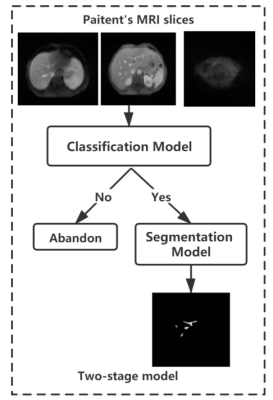
Figure 1:
Overall framework
-
Deep Learning 3D Convolutional Neural Network for Noninvasive Evaluation of Pathologic Grade of HCC Using Contrast-enhanced MRI
Ying Zhao1, Han Wen2,3, Ailian Liu1, Yu Yao2,3, Tao Lin1, Qingwei Song1, Xin Li4, Yan Guo4, and Tingfan Wu4
1The First Affiliated Hospital of Dalian Medical University, Dalian, China, 2Chengdu Institute of CoChinese Academy of Sciences, Chengdu, China, 3University of Chinese Academy of Sciences, Beijing, China, 4GE Healthcare (China), Shanghai, China
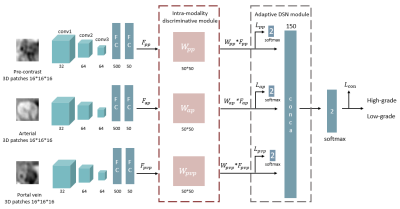
3D-CNN based on
CE-MR images was demonstrated to be capable to evaluate pathologic grade of HCC
treated with surgical resection, which will provide more prognostic information
and facilitate clinical management.
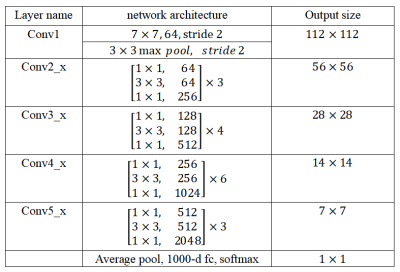
Table
1. The architecture of ResNet-50
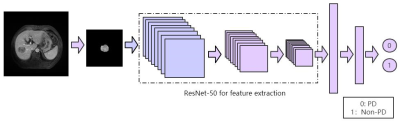
Figure 2. The feature extraction process of ResNet-50.
-
T2WI liver MRI with deep learning-based reconstruction: a clinical feasibility study in comparison to conventional T2WI liver MRI
Ruofan Sheng1, Liyun Zheng2, Shu Liao3, Yongming Dai2, and Mengsu Zeng1
1Department of Radiology, Zhongshan Hospital, Shanghai, China, 2United Imaging Healthcare, Shanghai, China, 3Shanghai United Imaging Intelligence, Shanghai, China
Compared with the conventional T2WI, the T2WI sequence with deep learning-based reconstruction showed promising performance as it provided significantly better image quality and
lesion detectability within a relatively shorter acquisition time.
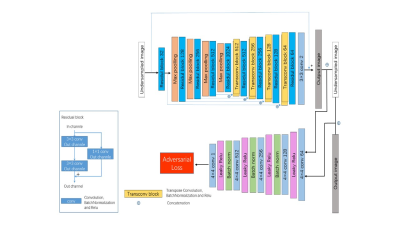
Figure 1. Network structure of
the deep learning-based fast MR reconstruction framework used in this study.
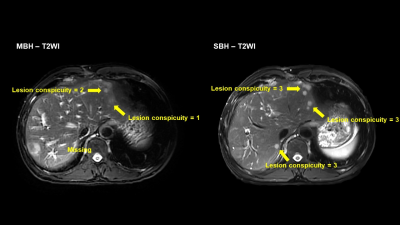
Figure
4. Example of lesion analysis.
-
Model-based Deep Learning Reconstruction using Folded Image Training Strategy (FITS-MoDL) for Liver MRI Reconstruction
Satoshi Funayama1,2, Utaroh Motosugi3, and Hiroshi Onishi1
1Department of Radiology, University of Yamanashi, Yamanashi, Japan, 2Graduate School of Medicine, University of Yamanashi, Yamanashi, Japan, 3Department of Radiology, Kofu-Kyoritsu Hospital, Yamanashi, Japan
Model-based Deep Learning Reconstruction using Folded Image Training Strategy (FITS-MoDL) improved image quality and memory consumption during network training in liver MRI.
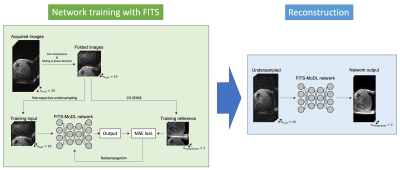
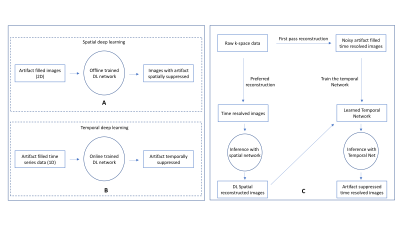
Flow diagram of network training with folded image training strategy (FITS) and image reconstruction. In training with FITS, images for training were folded by factor of 2 to reduce memory consumption.
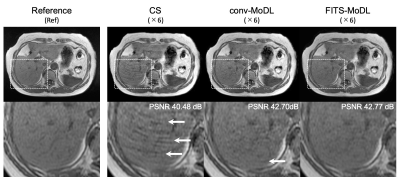
A representative case. (CS) total variation regularized compressed sensing showed some aliasing on liver parenchyma. A few aliasing is remained in the conventional model-based deep learning reconstruction (conv-MoDL), while it is removed in the model-based deep learning reconstruction using FITS (FITS-MoDL).
-
The value of Radiomics combined with Machine Learning in the staging of liver Fibrosis
Fengxian Fan1, Weiting Huang2, Yanli Jiang1, Wanjun Hu1, Jing Zhang1, and Jialiang Ren3
1LanZhou University Second Hospital, LanZhou, China, 2LanZhou University, LanZhou, China, 3GE Healthcare, Shanghai, China
In this study, 244 people had liver pathologic and MRI were divided into training and testing cohorts to developed and validated radiomics models for differentiation of low(0-2) from high(3-4) stage fibrosis. The results showed radiomics models of T1WI had a powerful ability to stage fibrosis.
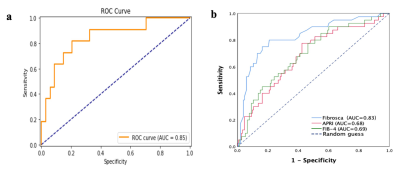
Figure 2. a. ROC curve analysis of radiomics models in the testing cohort (AUC=0.85). b. ROC curve analysis of Fibroscan(AUC=0.83), APRI(AUC=0.68), FIB-4(AUC=0.69).
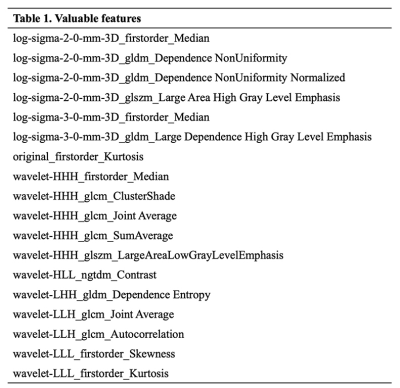
Table 1.The eighteen valuable features.
-
Few-shot deep learning for kidney segmentation
Junyu Guo1 and Ivan Pedrosa1
1Radiology, UT southwestern medical center, Dallas, TX, United States
In this study, we investigated the feasibility of kidney segmentation using deep learning models trained with MR images from only a few subjects. We tested the hypothesis that few-shot deep learning may achieve accurate kidney segmentation.
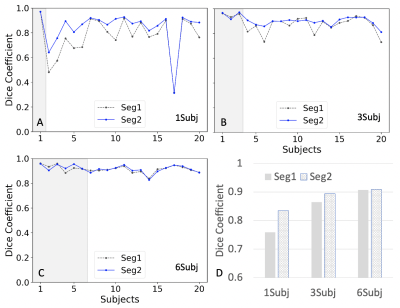
Figure 2. Comparison between two results (Seg1 vs. Seg2) of Dice coefficients using the different trained models. A.) Dice coefficient plots from a model trained using one subject (1Subj); B.) using three subjects (3Subj); C.) using the six subjects (6Subj). D.) the bar plots for the above three cases. Seg1 indicates the results predicted using the first network alone; Seg2 indicates the results by using the two networks in Fig. 1. Gray areas in A-C indicate the training data sets.
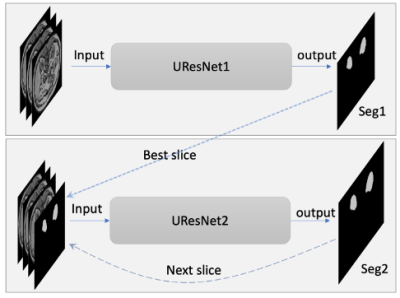
Figure 1. Diagram of two neural networks including UResNet1 and UResnet2. The inputs for UResNet1 are three consecutive slices; the inputs for UResNet2 are three consecutive slices and one predicted mask for the third slice. Seg1 indicates the output of the first network; Seg2 indicates the output of the whole networks. The dotted and dashed lines indicate the relationship in the prediction stage.
-
Deep learning based kidney segmentation for high temporal resolution tracking renal size changes during sequential gas challenges
Kaixuan Zhao1,2, Joao dos Santos Periquito3, Thomas Gladytz2, Kathleen Cantow3, Luis Hummel3, Jason Millward2, Sonia Waiczies2, Erdmann Seeliger3, Yanqiu Feng1, and Thoralf Niendorf2,4
1School of Biomedical Engineering, Southern Medical University, Guangzhou, China, 2Berlin Ultrahigh Field Facility (B.U.F.F.), Max Delbruck Center for Molecular Medicine in the Helmholtz Association, Berlin, Germany, 3Institute of Physiology, Charité - Universitätsmedizin Berlin, Berlin, Germany, 4Experimental and Clinical Research Center, a joint cooperation between the Charité Medical Faculty and the Max Delbrück Center for Molecular Medicine in the Helmholtz Association, Berlin, Germany
With
the progression of hypoxia, renal size decreased by ~10%. During the reoxygenation phase renal size rapidly
recovered to baseline. A comparison between renal size and renal T2* demonstrates that rapid
renal size recovery is paralleled by T2* recovery.
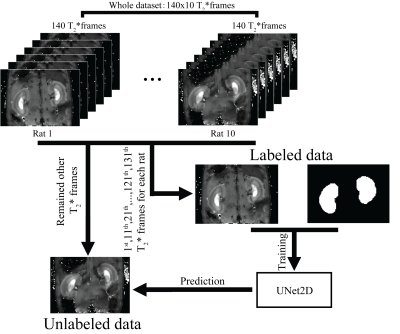
Figure 1. Flow chart of experiment design
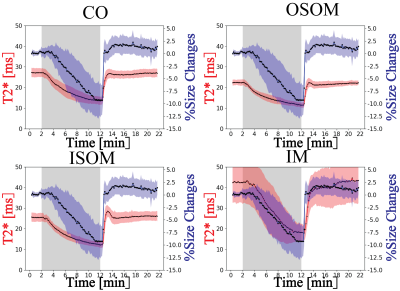
Figure 4. Comparison between renal layer’s
T2* and measured renal size changes.
-
Is it Feasible? IVIM-DWI and T2WI-based Texture Analysis Predicting Histological Types of Cervical Carcinoma Before Operation
Jiang-Ning Dong1 and Bin Shi1
1The First Affiliated Hospital of USTC, Anhui Provincial Cancer Hospital, Hefei, China
The combination of IVIM-DWI and T2WI-based texture features had good predictive performance to evaluate different histological types of cervical carcinoma, especially for cervical squamous cell carcinoma and adenocarcinoma.
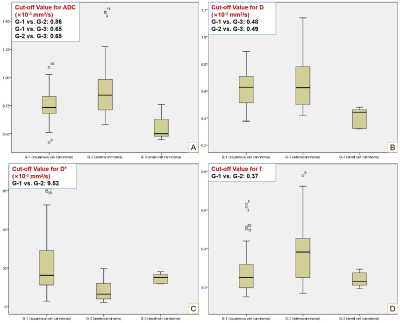
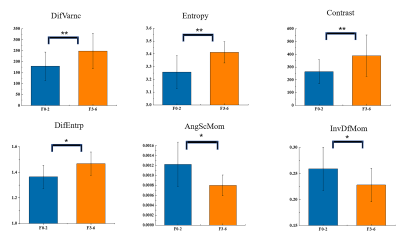
Fig. 2 Box-plots of IVIM-DWI Parameters.
Panels A-D represent ADC, D, D* and f values for G-1 (cervical squamous cell carcinoma), G-2 (cervical adenocarcinoma) and G-3 (cervical small cell carcinoma), respectively (p < 0.05).
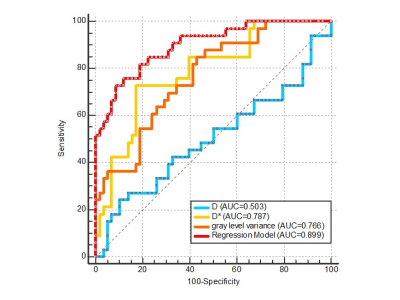
Fig. 3 ROC Curves of Regression Model for G-1 Compared to G-2, and Individual Independent factors (D, D* and Gray Level Variance).
-
Fully Automated Pelvic Bones Segmentation in Multiparameter MRI Using a 3D Convolutional Neural Network
xiang liu1, chao han1, and xiaoying wang1
1department of radiology, peking university first hospital, Beijing, China
The 3D U-Net CNN showed good quantitative and
qualitative performances in the segmentation of pelvic bones on mpMRI images, which may provide reliable skeletal geometric information for subsequent detection of pelvic tumor bone
metastases
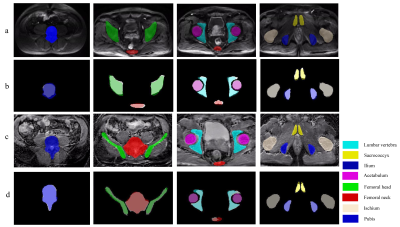
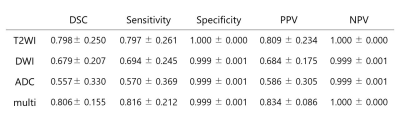
Figure
3. Examples of the comparison between
CNN-predicted and manual segmentation. (a) Section examples of eight
bones on DWI image; (b) The corresponding overlapping images between
manual segmentation (white background) and CNN-predicted segmentation; (c)
Section examples of eight bones on ADC image; (d) The corresponding
overlapping images between manual segmentation (white background) and
CNN-predicted segmentation .CNN: Convolution neural network.
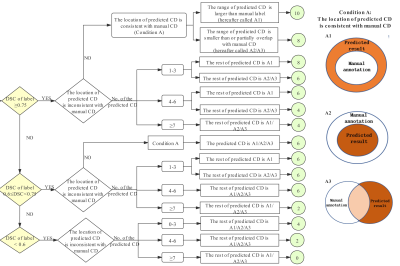
Figure
2.
The SCORE system and evaluation criteria on DWI and ADC images. Condition A
refers to that the location of the predicted CD is consistent with manual CD,
and the range of the predicted CD is larger than (A1) or less than (A2) the
manual CD, or partially overlaps with the manual CD (A3). CD: connected domain,
which is defined as the label with a continuous structure in 3D space. DSC:
Dice similarity coefficient.
-
Motion Robust High-Resolution Pelvic Imaging using PROPELLER and Deep Learning Reconstruction
Ali Pirasteh1, Lloyd Estkowski2, Daniel Litwiller3, Ersin Bayram4, and Xinzeng Wang5
1Department of Radiology, UW Madison, Madison, WI, United States, 2Global MR Applications & Workflow, GE Healthcare, Madison, WI, United States, 3Global MR Applications & Workflow, GE Healthcare, Denver, CO, United States, 4Global MR Applications & Workflow, GE Healthcare, Houston, TX, United States, 5GE Healthcare, Houston, TX, United States
PROPELLER T2-weighted images of pelvis with DL
reconstruction resulted in improved image quality, including improved SNR,
in-plane resolution and robustness to motion.
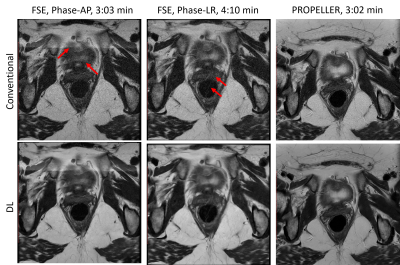
Figure 4: FSE and PROPELLER images reconstructed using deep-learning
based reconstruction methods. Deep-learning based reconstruction method improved
the SNR and in-plane resolution of FSE images, but the motion artifacts were
not removed. Due to the robustness to motion and deep-learning based
reconstruction method, the PROPELLER images showed better SNR, in-plane
resolution and less motion artifacts.
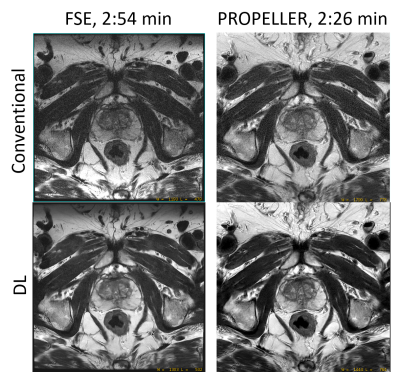
Figure 5: High resolution rectal FSE and PROPELLER images of
a patient. Deep learning reconstruction method improved the SNR and in-plane
resolution. Due to the robustness to motion, PROPELLER further improved the
image sharpness.
-
Deep Learning Reconstruction for DWI with b Values < 5000s/mm2: Improvement of Image Quality and Diagnostic Performance for Prostatic Cancer
Takahiro Ueda1, Yoshiharu Ohno1,2, Kaori Yamamoto3, Kazuhiro Murayama2, Masato Ikedo3, Masao Yui3, Akiyoshi Iwase4, Takashi Fukuba4, Satomu Hanamatsu1, Yuki Obama1, Hirotaka Ikeda1, and Hiroshi Toyama1
1Radiology, Fujita Health University School of Medicine, Toyoake, Japan, 2Joint Research Laboratory of Advanced Medical Imaging, Fujita Health University School of Medicine, Toyoake, Japan, 3Canon Medical Systems Corporation, Otawara, Japan, 4Radiology, Fujita Health University Hospital, Toyoake, Japan
DLR method is useful for improving image quality and
diagnostic performance of DWI without any adverse effect on ADC assessment
using a 3T MR system for patients with prostatic cancer.
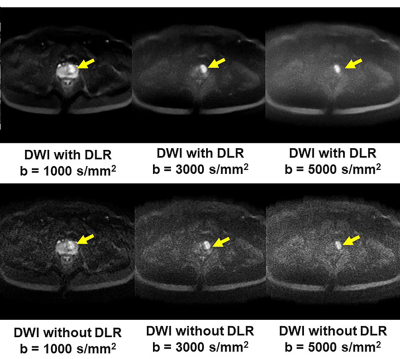
Figure 1. 51-year
old patient with prostatic cancer in the left transitional zone
b: DLR improves image quality of DWIs for
each b value. Each DWI shows the
prostatic cancer as high signal intensity in the left transitional zone
(arrow).
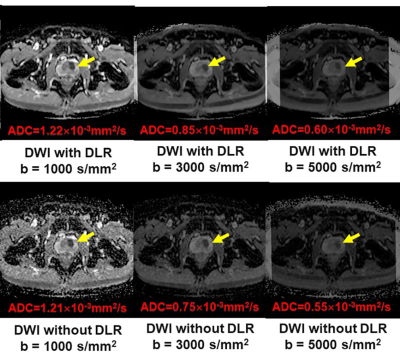
Figure 1. 51-year
old patient with prostatic cancer in the left transitional zone
c: All ADC maps show the
prostatic cancer as a hypointense signal in the left transitional zone
(arrow).
-
T2-weighted Pelvic MR Imaging Using PROPELLER with Deep Learning Reconstruction for Improved Motion Robustness
Mohammed Saleh1, Sanaz Javadi1, Manoj Mathew2, Jong Bum Son3, Jia Sun4, Ersin Bayram5, Xinzeng Wang5, Jingfei Ma3, Janio Szklaruk1, and Priya Bhosale1
1Radiology, MD Anderson Cancer Center, Houston, TX, United States, 2Radiology, Stanford University, Stanford, CA, United States, 3Imaging Physics, MD Anderson Cancer Center, Houston, TX, United States, 4Biostatistics, MD Anderson Cancer Center, Houston, TX, United States, 5Global MR Applications and Workflow, GE Healthcare, Houston, TX, United States
Compared to FSE, PROPELLER
showed reduced motion artifacts for T2-weighted imaging of pelvis. Deep Learning-based
image reconstruction (DL Recon) further improved image quality with better image
SNR, increased image sharpness and reduced artifacts.
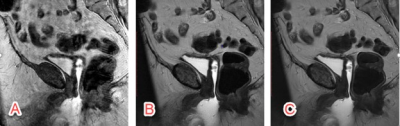
Figure 1. The conventional T2-weighted FSE images and PROPELLER images without and with
DL are shown. Because the phase encoding direction of AP was often chosen to avoid
aliasing and long scan time, conventional T2-weighted FSE is sensitive to
motion artifacts in sagittal imaging (A). PROPELLER is robust to motion and
minimized the motion artifacts (B), however, the SNR and in-plane resolution
were limited by the clinical scan time. DL reconstruction improved the SNR and
in-plane resolution without increasing scan time (C).
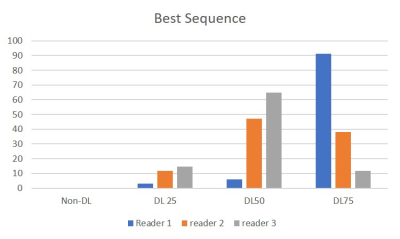
Figure 3. This graph shows the scoring of the best
sequence on the 4 images by three radiologists.
DL 50 and DL 75 were considered to be better than Non-DL and DL25.
-
Quantifying Efficiency and Variability of Clinical MRI Exams with Advanced Analytics Tools
Sheena Y Chu1, Scott B Reeder1,2,3,4,5, and John W Garrett1,3
1Department of Medical Physics, University of Wisconsin-Madison, Madison, WI, United States, 2Department of Medicine, University of Wisconsin-Madison, Madison, WI, United States, 3Department of Radiology, University of Wisconsin-Madison, Madison, WI, United States, 4Department of Biomedical Engineering, University of Wisconsin-Madison, Madison, WI, United States, 5Department of Emergency Medicine, University of Wisconsin-Madison, Madison, WI, United States
We developed an analytics tool to quantitatively assess the utilization of clinical MRI exams. By tracking overall exam efficiency and variability, we assessed sources of inefficiency and variability that contribute to lengthy exam slots.
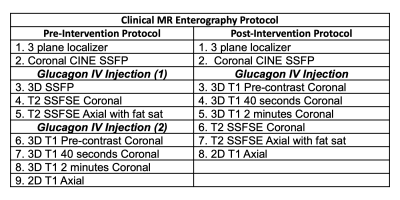
Table 1: MR enterography protocol before and after intervention
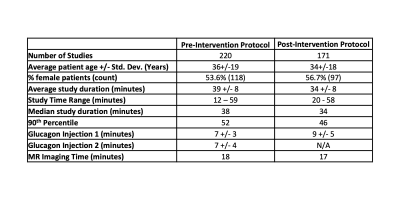
Table 2: The intervention led to an overall decrease in exam length and standard deviation, with a resulting increase in efficiency.
-
Application value of Radiomics Methods Based on DKI Sequence MK Map for Differentiating squamous Cell carcinoma from cervix Adenocarcinoma
Shifeng Tian1, Ailian Liu1, Yan Guo2, and Yuan Wei1
1Department of Radiology, The First Affiliated Hospital of Dalian Medical University, Dalian, China, China, 2GE Healthcare, Dalian City, China, China
A total of 386 imaging features were extracted, and 7 omics characteristics related to cervical cancer pathological classification were obtained by dimension reduction.
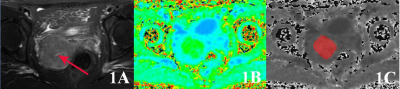
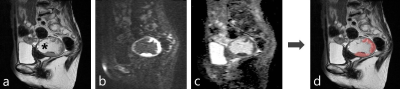
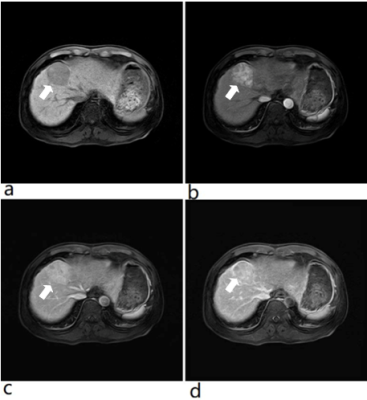
Figure 1:A 56 year old patient with cervical mucinous adenocarcinoma.1A shows T2WI image and the red arrow points to cervical cancer;1B shows the MK pseudo color map of DKI sequence of corresponding layer; 1C shows the ROI outline of corresponding layer, and the red area shows the coverage area of tumor parenchyma.
-
Radiomics Based on MR Imaging of Rectal Mucinous Adenocarcinoma: Assess Treatment Response to Neoadjuvant Chemoradiotherapy
Fu Shen1, Minglu Liu1, Zhihui Li1, Xiaolu Ma1, Jianping Lu1, and Yuwei Xia2
1Changhai Hospital, Shanghai, China, 2Huiying Medical Technology Co., Ltd., Beijing, China
We developed a radiomics model
with excellent performance for individualized, noninvasive prediction of
tumor regression in patients with rectal mucinous adenocarcinoma (RMAC).
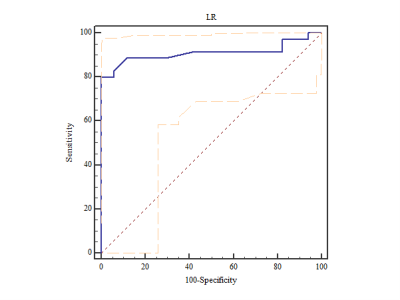
The ROC curve for LR
classifier
-
Breast MRI radiomic shape features for the prediction of neoadjuvant therapy response
Wen Li1, Rohan Nadkarni1, David C Newitt1, Bo La Yun1,2, Deep Hathi1, Alex Nguyen1, Natsuko Onishi1, Lisa J Wilmes1, Ella F Jones1, Jessica Gibbs1, Teffany Joy Bareng1, Bonnie N Joe1, Elissa Price1, Rita Mukhtar1, John Kornak1, Efstathios Gennatos1, I-SPY 2 Consortium3, Laura J Esserman1, and Nola M Hylton1
1University of California, San Francisco, San Francisco, CA, United States, 2Seoul National University Bundang Hospital, Seoul, Korea, Republic of, 3Quantum Leap Healthcare Collaborative, San Francisco, CA, United States
In the prediction of pathologic complete response of breast cancer in neoadjuvant setting, addition of radiomic shape features to FTV on MRI showed improvements in the performance over FTV alone, especially at the early treatment time point.
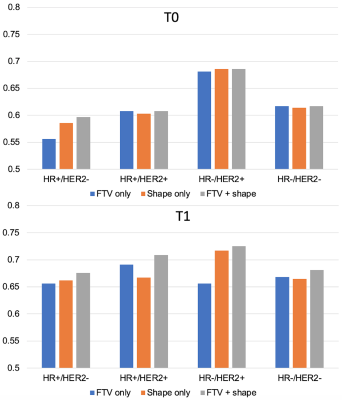
Fig. 4 AUCs for predicting pCR using logistic regression model at T0 (top) and T1 (bottom). The number of patients and pCR rate included in analysis at T0 were: 941 (35%), 368 (18%), 149 (39%), 81 (68%), 343 (43%) for full, HR+/HER2-, HR+/HER2+, HR-/HER2+, HR-/HER2- respectively. The numbers at T1 were: 904 (34%), 357 (18%), 142 (39%), 74 (66%), 331 (42%). FTV – functional tumor volume, HR – hormone receptor, HER2 – human epidermal growth factor receptor 2.
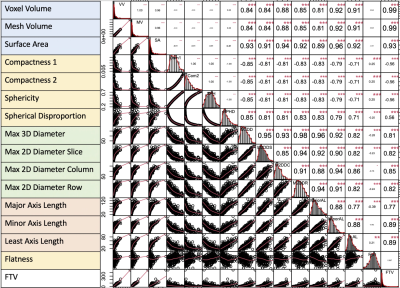
Fig. 3 Correlation map among FTV and shape features at T0.
-
The nomogram of MRI-based radiomics with complementary visual features by machine learning improves stratification of glioblastoma patients
ZHENYU SHU1, YUYUN XU1, and YONG ZHANG2
1Zhejiang Provincial People’s Hospital, Hangzhou, China, 2MR Research, GE healthcare (China), SHANG HAI, China
The nomogram had a survival prediction accuracy of 0.878 and 0.875, a
specificity of 0.875 and 0.583, and a sensitivity of 0.704 and 0.833,
respectively, in the training and test set
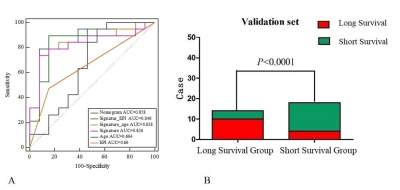
(A)ROC curves for
nomogram, radiomic signature, age and meninges predicting OS in validation set.
(B) The stratification performance of the nomogram in validation set.
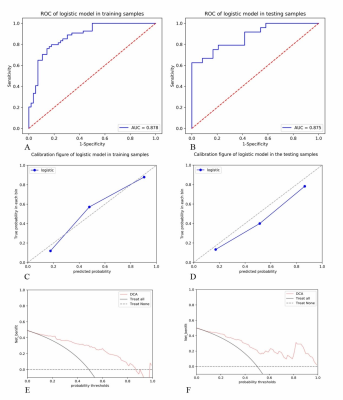
(A) and (B) show the ROC curves of the nomograms in the
training and test sets; (C) and (D) show the calibration curves of the
nomograms in the training and test sets; and (E) and (F) show the DCA curve of
the nomograms in the training and test sets.