-
Investigation of Gradient-Induced Heating of a Cryogen-Free Magnet
Diego Felipe Martinez1, Arjama Halder1,2, Will Bradfield Handler1, and Blaine Alexander Chronik1,2
1The xMR Labs, Physics and Astronomy, Western University, London, ON, Canada, 2Medical Biophysics, Western University, London, ON, Canada
Cryogen-free low-field MR systems were investigated for heating interactions between the main magnet and the gradient system, as this heating could cause stability issues. Gradient components were tested at various strengths, with heating due to interaction never exceeding 0.015 K.
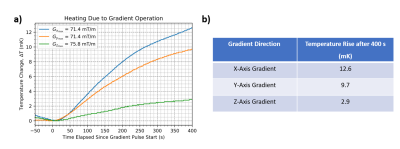
Figure and Table comparing the temperature increase of the main magnet caused by running a bipolar trapezoidal gradient. The pulse sequence contained 40 cycles of 0.9ms duration bipolar lobes and had a maximum field strength of 71.4 mT/m in the x- and y- axis gradients and a 75.75 mT/m in the z-axis gradient.
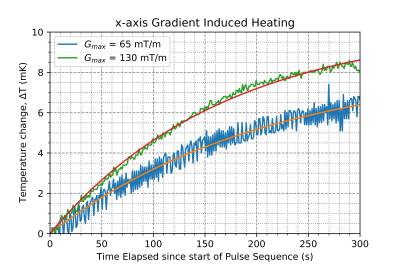
Comparison of heating at different gradient strengths. The parameters of the fit are shown in Figure 2. The pulse sequence used in these trials was a single lobe Trapezoidal pulse with a rise time of 0.1ms, total duration of 200ms, and TR of 2000ms.
-
Deep Learning based spine labeling with three-plane 2D localizers without vertebrae segmentation
Dattesh Dayanand Shanbhag1, Arathi Sreekumari1, Soumya Ghose2, Chitresh Bhushan2, and Uday Patil3
1GE Healthcare, Bangalore, India, 2GE Global Research, Niskayuna, NY, United States, 3General Electric Company, Bangalore, India
Vertebrae labeling on standard 2D tri-planar MR localizer
images is demonstrated without explicit vertebrae segmentation . For lumbar
spine MR exam, we report labeling accuracy of 92%, 98% and 96% for T12, L4 and
S1 vertebrae on localizer images.
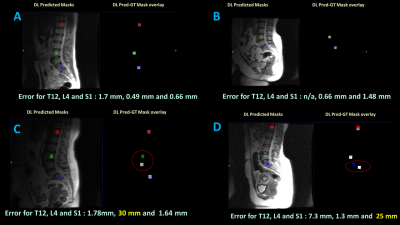
Figure 4. Sample
examples of Spine labeling on 2D localizers for four different test subjects. DL predictions are shown as Red square for T12, green square for L4 and blue square for S1 respectively. A and B : Examples of cases with error much less than acceptable criteria (
< 8 mm error). C: Example with large L4 error and D: Example
with large S1 error. Notice that error in one vertebra labelling in C and D
doesn’t not affect the accuracy of other labels.
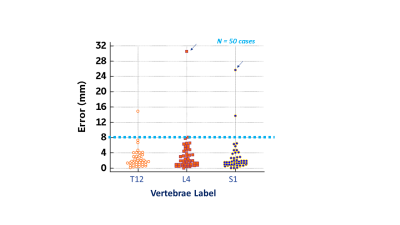
Figure 3. Centroid
error for 50 test cases for T12, L4 and S1 labeling. Cutoff for acceptable
performance ( 8 mm ) is shown in dotted lines. Most of the errors are within
the threshold limits. Overall, accuracy for T12, L4 and S1 is 92%, 98% and 96%
respectively. Arrows indicate cases C and D shown in Figure 4 for L4 and S1
error respectively.
-
Evaluating the role of T2-weighted-imaging in acute ischemic stroke to accelerate routine Stroke-MRI protocol
Sanjay Dhawan1,2, Ishrat Afshan1,2, Rupsa Bhattacharjee3, and Indrajit Saha3
1Clearmedi Healthcare Pvt. Ltd., Gurugram, India, 2Department of Radiology, Paras Hospitals, Gurugram, India, 3Philips Health Systems, Philips India Limited, Gurugram, India
Flair proves to
be better than T2, in depicting small/subtle signal changes in critical
time-window; in favour of the strong informed decision of omitting T2w from stroke-MRI
protocols, saves 14% scan time, makes the protocol faster at par with CT scan
time.
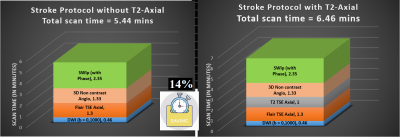
Figure-1: Summary of the stroke protocol under use
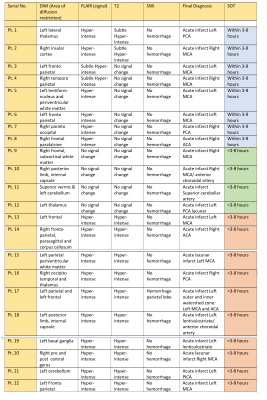
Figure-2: MRI
findings summarized
-
Seq2prospa: translating PyPulseq for low-field imaging
Keerthi Sravan Ravi1,2, Thomas O'Reilly3, John Thomas Vaughan Jr.2, Andrew Webb3, and Sairam Geethanath2
1Biomedical Engineering, Columbia University, New York, NY, United States, 2Columbia Magnetic Resonance Research Center, New York, NY, United States, 3Leiden University Medical Center, Leiden, Netherlands
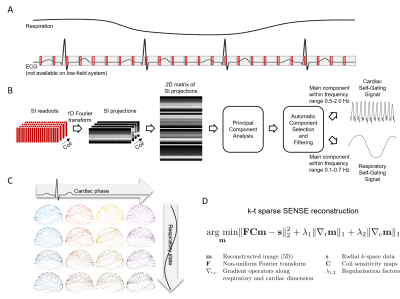
A 2D GRE sequence programmed in PyPulseq was programmatically converted to a Prospa-friendly format using seq2prospa. In-vitro and in-vivo acquisitions were performed. The SNR values measured from the in-vitro acquisitions using the two sequences were 32 dB and 34 dB respectively.
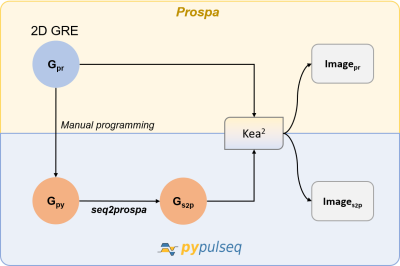
Figure 1. Workflow for converting a 2D Gradient Recalled Echo (GRE) sequence. A 2D GRE sequence designed in Prospa (Gpr) was first manually programmed in PyPulseq (Gpy). Next, this PyPulseq 2D GRE was converted to a Prospa-friendly format (Gs2p) using seq2prospa. Finally, the two 2D GRE sequences (Gpr, Gs2p) were executed on a Kea2 spectrometer to image a human hand and a structural phantom. The acquired images (Ipr, Is2p) were reconstructed and visualized.
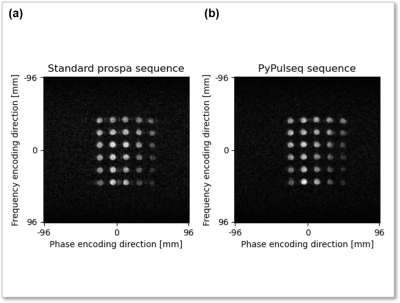
Figure 3. Image reconstructions of imaging the structural phantom using the standard Prospa and PyPulseq-converted sequences. The SNR values measured from the standard Prospa acquisition (a) and the PyPulseq-converted acquisition (b) were 32 dB and 34 dB respectively.
-
MRS metabolomics screening of human lung cancer with blood serum collected prior to disease diagnosis
L Cheng1, Tjada Schult1, Mara Lauer1, Yannick Berker2, Marcella Cardoso1, Lindsey Vandergrift1, Piet Habbel3, Johannes Nowak4, Martin Aryee1, Mari Mino-Kenudson1, and David Christiani5
1Mass General Hospital, Boston, MA, United States, 2German Cancer Research Center, Heidelberg, Germany, 3Charite Medical University, Berlin, Germany, 4Julius-Maximilians University, Wuerzburg, Germany, 5Harvard T.H. Chan School of Public Health, Boston, MA, United States
Blood sera from lung
cancer patients prior to their diagnosis were studied with MRS to establish
LuCa screening metabolomic profiles that can triage patients to CT tests to
discover cancer earlier and reduce death rates.
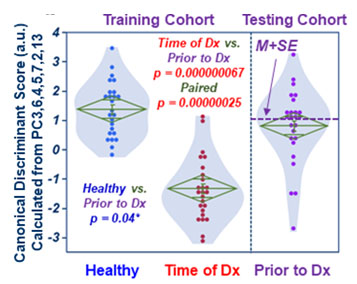
Fig 2. Canonical scores calculated
with training cohort place testing cohort (Prior-to-Dx) between Healthy and
Time-of-Dx.
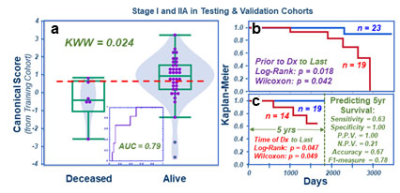
Fig 5. Testing and validation combination. a). Overall patient survival status with the M+SE
threshold (dashed line) calculated using all the Prior-to-Dx cases from both
cohorts. b). The Kaplan-Meier survival predictions for
all stage I and IIA cases. c).
Significant Kaplan-Meier
survival rates predicted using this threshold according to the date of patients
Time-of-Dx, with detailed statistical parameters listed.
-
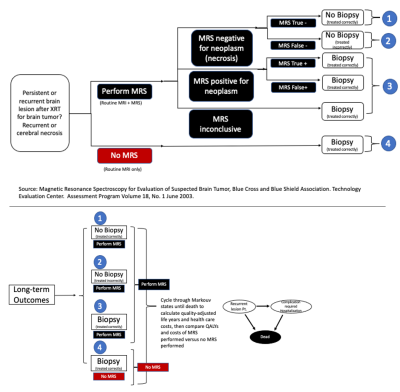
MRI is superior to CT for liver staging in colon cancer and should be investigated as the definitive liver staging modality in colon cancer
Alexandra W. Acher1, Emily Winslow2, and Scott B. Reeder1
1University of Wisconsin School of Medicine and Public Health, Madison, WI, United States, 2Georgetown University, Washington DC, MD, United States
MRI is superior to computed tomography for
hepatic staging and surveillance of colon cancer and the clinical impact of its
use in staging and surveying stage III and IV disease should be prospectively
assessed.
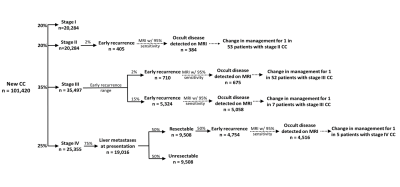
Outline of stage-dependent incidence of CC,
early recurrence, and potential MRI-based treatment changes. Assuming that
early recurrence represents disease that was occult on staging imaging, the incidence of
MRI-dependent treatment changes can be estimated. For example, Stage III
patients have a reported incidence of early recurrence between 2-15%. Assuming
an MRI sensitivity of 95%, MRI liver staging at diagnosis may have detected
occult disease in 1 in 52 patients (assuming 2% early recurrence) or 1 in 7
patients (assuming 15% early recurrence).
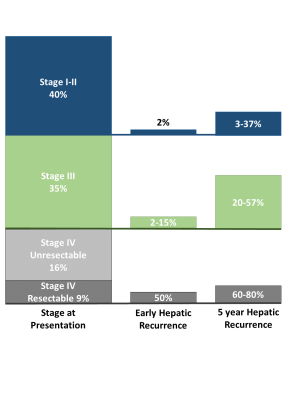
Incidence
of CC by Stage and Incidence of Early and Late Recurrence: First column: incidence of CC by stage. Second column: incidence of early recurrence (recurrence < 12 months from curative intent surgery), by stage. For example, 50% of patients with resectable stage IV disease at diagnosis will
have early recurrence. Third column: incidence of recurrence at 5 years. For example, 60-80% of patients with resectable stage IV disease at diagnosis will recur within 5 years.
-
Towards Automated Scanning: A Framework for Maintaining Constant SNR and T1-contrast for SPGR and MP-RAGE
Dahan Kim1, Dinghui Wang1, and James G Pipe1
1Department of Radiology, Mayo Clinic, Rochester, MN, United States
SPGR and MP-RAGE spiral scans with varying ADC time, TR, and FOV can produce constant SNR and T1 contrast by adjusting the flip angle and number of spiral arms. This framework can be potentially automated to reduce image variability and increase patient safety without technologist intervention.
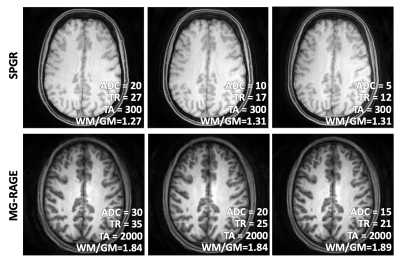
Figure 1. SPGR and MP-RAGE images acquired at three different spiral trajectory lengths (measured by ADC time) show equivalent T1 contrast and SNR, when the number of spiral arms adjusted to match SNR and the flip angle was adjusted to keep TA constant. The T1 contrast was measured as the ratio of WM and GM signals (WM/GM), shown within the figure. The gray and white matter SNR was quantitatively measured and shown in Figure 2.
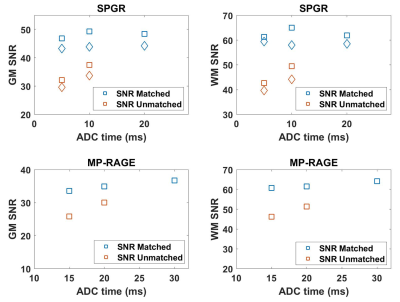
Figure 2. SPGR and MP-RAGE scans show equivalent gray matter and white matter SNR across scans having different ADC time when the number of spiral arms was adjusted to match the SNR. In comparison, the SNR drops in the SNR-unmatched reference scans, which were acquired without such adjustment. (Shown for the two subjects for SPGR and one subject for MP-RAGE)
-
Validating Open-Source MR Sequences for Reproducible Research
Gehua Tong1, Sairam Geethanath2, Enlin Qian1, and John Thomas Vaughan, Jr. 2
1Biomedical Engineering, Columbia University, New York, NY, United States, 2Columbia Magnetic Resonance Research Center, Columbia University, New York, NY, United States
A framework for testing, validating, and sharing open-source MR sequences was developed to improve their accessibility, repeatability, and safety. The framework was demonstrated for two common sequences, which were packaged and shared in an open-source repository.
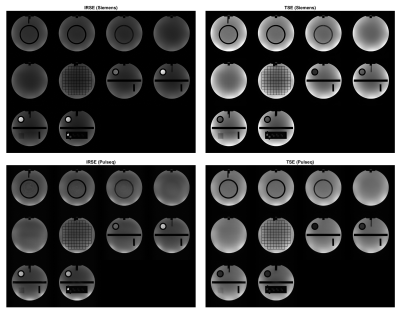
Figure 2: Open-source qualitative IRSE and TSE sequences are compared to vendor gold standards. Parameters are FOV = 250 mm, N = 256, slice thickness = 5 mm, and FA = 90 deg. IRSE has TR = 2000 ms, TE = 12 ms, TI = 100 ms (125 ms for Siemens); TSE has TR = 2741 ms, TE = 50 ms, turbo factor = 4
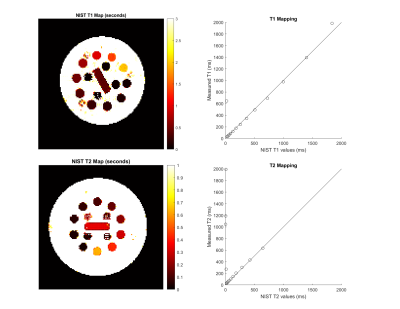
Figure 3: T1 and T2 maps obtained from IRSE and TSE sequences (N = 128, FOV = 250 mm, slice thickness = 6 mm, FA = 90, 180 deg). The Pearson coefficient of correlation is 0.9557 for T1 spheres (0.9983 for spheres 1-13) and -0.0849 for T2 spheres (0.9994 for spheres 1-10). Shorter TIs and TEs than applied are required to accurately map the highest-index spheres.
-
A National Clinical Research MRI Quality Assurance and Quality Control Survey by NCITA
Penny L Hubbard Cristinacce1,2, Damien J McHugh1,2, Matthew R Orton2,3, Arnold JV Benjamin2,4, Ross A Little1,2, James P. B. O'Connor1,2,3, and Maite Jauregui-Osoro2,5
1The University of Manchester, Manchester, United Kingdom, 2National Cancer Imaging Translational Accelerator (NCITA), CRUK, United Kingdom, 3Institute of Cancer Research, Sutton, United Kingdom, 4University of Cambridge, Cambridge, United Kingdom, 5Imperial College London, London, United Kingdom
National Cancer Imaging Translational Accelerator (NCITA) is developing an MRI Core Lab to facilitate the validation and standardisation of quality assured imaging biomarkers. See the results of a QA/QC survey of clinical research MR conducted at research institutions across the UK.
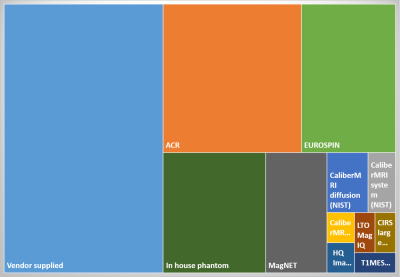
Figure 1. What MRI phantoms/test objects does your institution/centre have available?
-
The Open Source Initiative for Perfusion Imaging (OSIPI)
Laura C. Bell1, Henk Mutsaerts2, Andrey Fedorov3, Zaki Ahmed4, Patricia Clement5, Simon Levy6, Frank G Zollner7, Jan Petr8, Sudipto Dolui9, Kathleen Schmainda10, Melissa Prah10, Matthias Schabel11, Ananth Madhuranthakam12, Li Zhao13, Michael Thrippleton14, Petra van Houdt15, James Holmes16, C. Chad Quarles1, Greg Cron17, David L Thomas18, Yuriko Suzuki19, Ina Kompan20, David L Buckley21, Paula Croal22, Udunna Anazodo23, Anahita Fathi Kazerooni9, Hamidreza Saligheh Rad24, Charlotte Debus25, and Steven P Sourbron26
1Barrow Neurological Institute, Phoenix, AZ, United States, 2Amsterdam University Medical Cente, Amsterdam, Netherlands, 3Brigham and Women’s Hospita, Boston, MA, United States, 4Mayo Clinic, Rochester, MN, United States, 5Ghent University, Ghent, Belgium, 6Aix-Marseille Univ, Marseille, France, 7Heidelberg University, Mannheim, Germany, 8Helmholtz-Zentrum Dresden-Rossendorf, Dresden, Germany, 9University of Pennsylvania, Philadelphia, PA, United States, 10Medical College of Wisconsin, Milwaukee, WI, United States, 11Oregon Health and Science University, Portland, OR, United States, 12UT Southwestern Medical Center, Dallas, TX, United States, 13Children’s National Medical Center, Washington DC, DC, United States, 14University of Edinburgh, Edinburgh, United Kingdom, 15the Netherlands Cancer Institute, Amsterdam, Netherlands, 16University of Wisconsin - Madison, Madison, WI, United States, 17Ottawa Hospital Research Institute, Ottawa, ON, Canada, 18University College London, London, United Kingdom, 19University of Oxford, Oxford, United Kingdom, 20German Cancer Research Center, Heidelberg, Germany, 21University of Leeds, Leeds, United Kingdom, 22University of Nottingham, Nottingham, United Kingdom, 23Western University, London, ON, Canada, 24Tehran University of Medical Sciences, Tehran, Iran (Islamic Republic of), 25Karlsruhe Institute of Technology, Karlsruhe, Germany, 26University of Sheffield, Sheffield, United Kingdom
The Open Source Initiative for Perfusion Imaging (OSIPI) was founded by the ISMRM Perfusion Study Group to support reproducible science and the reusability of data and methods.
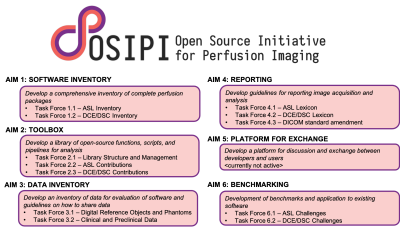
Figure 3: OSIPI’s mission to support open perfusion science is done through the 6 aims as outlined here each with the associated task forces.
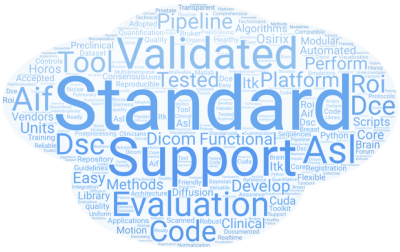
Figure 1: A word cloud of the comments (produced by wordart.com). Words such as “standard”, “evaluation”, “tested”, “validated” indicate a consensus that instead of another software platform, the community really needs perfusion to be benchmarked and standardized.
-
High-Performance Low-Field MRI of the Lumbar Spine: Comparison of 0.55T MRI With Two Gradient Systems To 1.5T MRI in Humans
Mohammad Samim1, Mahesh Bharath Keerthivasan2, Iman Khodarahmi1, Marisa Ilag1, Mary Bruno1, Hersh Chandrana1, Inge Brinkmann2, and Jan Fritz1
1Department of Radiology, NYU Langone Medical Center, New York, NY, United States, 2Siemens Medical Solutions USA Inc, Malvern, PA, United States
High-performance, low-field-strength 0.55-T MRI of the lumbar
spine can produce similarly high SNR and CNR, image quality, and visualization
of anatomical structures compared to 1.5T MRI, regardless of 25mT/m or 45mT/m
gradient system performance.
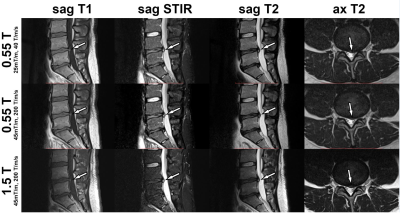
Figure
1. MRI studies of the lumbar spine obtained at 0.55T with a maximum gradient
strength of 25 mT/m and slew rate of 40 T/m/s2, 0.55T with a maximum
gradient strength of 45 mT/m and slew rate of 200 T/m/s2, and 1.5T
with a maximum gradient strength of 45 mT/m and slew rate of 200 T/m/s2.
MR images demonstrate an L4-L5 disc protrusion (arrows), causing thecal sac
deformity and left lateral recess narrowing
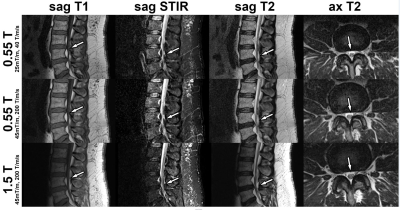
Figure 2. MRI studies of the lumbar spine obtained at 0.55T
with a maximum gradient strength of 25 mT/m and slew rate of 40 T/m/s2,
0.55T with a maximum gradient strength of 45 mT/m and slew rate of 200 T/m/s2,
and 1.5T with a maximum gradient strength of 45 mT/m and slew rate of 200 T/m/s2.
MR images demonstrate congenital lumbar spinal stenosis with epidural
lipomatosis causing thecal sac narrowing (arrows) to various degrees.
-
Point-of-Care Brain MRI: Clinical Application in a Stroke Rehabilitation Center
Samantha By1, E. Brian Welch1, Houchun Harry Hu1, Rafael O'Halloran1, Laura Sacolick1, Carole Lazarus1, Hadrien Dyvorne1, Jonathan Rothberg1, Khan Siddiqui1, and Lorraine Cullen2
1Hyperfine, Guilford, CT, United States, 2Gaylord Specialty Healthcare, Wallingford, CT, United States
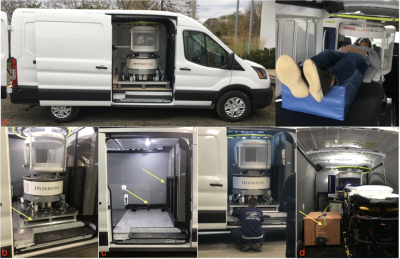
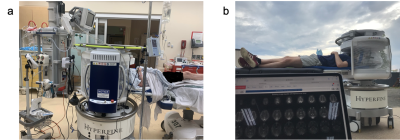
Portable, point-of-care MRI offers many new opportunities, such as scanning at the bedside or serial monitoring of a patient (i.e. daily or weekly). Six recovering stroke patients in a rehabilitation center received such exams.
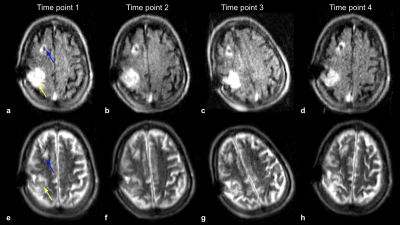
Figure 4: FLAIR (a-d) and T2-W (e-h) imaging of a recovering patient with a right MCA syndrome with multiple infarcts. Four time points were imaged over the course of 19 days, where the far left column is time point 1, and the far right column shows time point 4. Stable T2-W/FLAIR hyperintensities (yellow arrow), indicating mild encephalomalacia, were observed at all time points. Right ventricular shunt catheter is present (blue arrow).
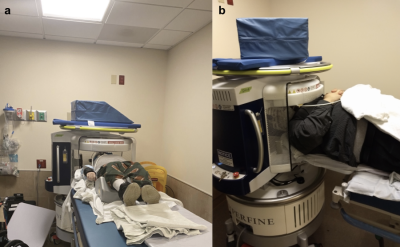
Figure 1: Portable, point-of-care MRI deployed in a rehabilitation center, as demonstrated through (a) a photograph of the device docked behind the patient’s bed and (b) a zoomed-in photograph of the device.
-
Advanced image processing outside the academia: The integration of ExploreASL into the workflow of an outpatient imaging center
Nandor K Pinter1,2, Sandeep Ganji3, Jan Petr4, Bela Ajtai 5, Harry Friel3, Joseph Fritz5, Laszlo Mechtler5, Alexander Fischer6, Frederik Barkhof7,8, and Henri Mutsaerts7,9
1Dent Neurologic Institute, Buffalo, NY, United States, 2Neurosurgery, University at Buffalo, Buffalo, NY, United States, 3Philips Healthcare, Gainesville, FL, United States, 4Helmholtz-Zentrum Dresden-Rossendorf, Dresden, Germany, 5Dent Neurologic Institute, Amherst, NY, United States, 6Philips Research Europe, Aachen, Germany, 7Dept of Radiology and Nuclear Medicine, Amsterdam University Medical Center, Amsterdam, Netherlands, 8Institute of Neurology, University College London, London, United Kingdom, 9Ghent Institute for Functional and Metabolic Imaging, Ghent, Belgium
We created a semi-automated workflow for ASL analysis that can be utilized by clinical radiologists without special knowledge in image processing. We show that the ASL quantification results with this solution are comparable to academic image processing.
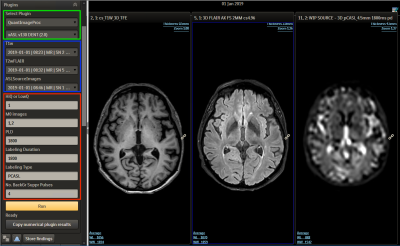
Figure 2. ISD workflow: Using the left panel the ExploreASL plugin (green frame) can be selected, which then prompts the user to select the T1, FLAIR and ASL series from the patient’s image list (blue frame). In the bottom part of the panel the analysis quality is defined and key ASL acquisition parameters are set (red frame), allowing the ASL processing to match the used scan parameters.
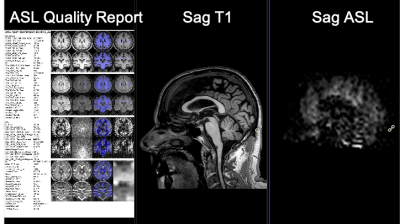
Figure 3. Visual output from the ISD plugin. The quantified CBF map (right) is co-registered with 3D T1 (middle), allowing for correct localization and visualization of T1-based Region Of Interest (ROI) on the CBF map. The left panel shows the quality report for the processing pipeline that allows for quick visual check of segmentation and provides CBF values for GM and WM.
-
A low-cost battery-powered tri-axial current-controlled gradient power supply for sustainable and portable MRI
Thomas O'Reilly1, Danny de Gans2, Lars Leenheer2, and Andrew Webb1
1C.J. Gorter Center for High Field MRI, Leiden University Medical Center, Leiden, Netherlands, 2DEMO, Delft University of Technology, Delft, Netherlands
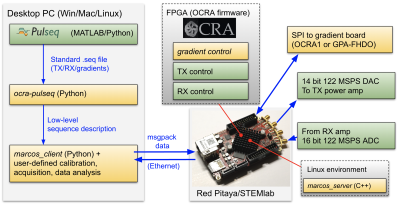
Low field MRI systems are becoming increasingly popular as a way of providing MRI in remote regions. The electronics that are used for such a system should be low power, portable and easy to repair. In this work we present a three axis, battery powered gradient amplifier for low field MRI.
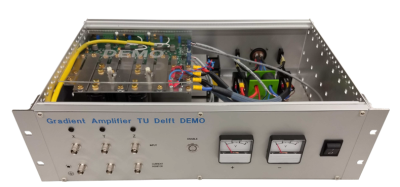
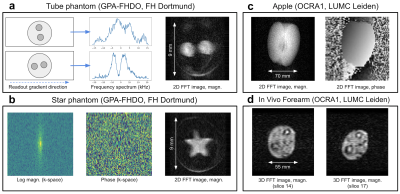
Figure 1: Photograph of the completed amplifier, including current monitors
and power supply voltage readouts on the front panel.
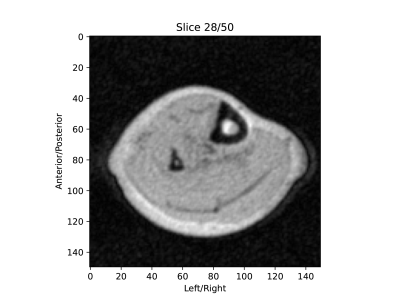
Figure 5: In-vivo image of the lower leg acquired on a 50 mT MRI scanner using
the described gradient amplifier to drive the gradient coils. The image is
reconstructed from a 3D TSE acquisition and has a resolution of 1x1x4mm.
-
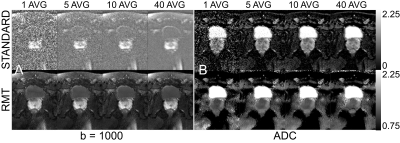
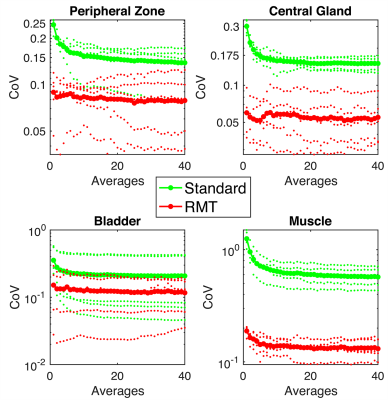
Repeatability of DWI and DCE-MRI of Prostate in an Active Surveillance Population
Jack C. Williams1, Matthew Gibbons1, Janet E. Cowan2, Peter R. Carroll2, and Susan M. Noworolski1
1Radiology and Biomedical Imaging, University of California San Francisco, San Francisco, CA, United States, 2Urology, University of California San Francisco, San Francisco, CA, United States
The best repeatability in stable individuals was found on ADC, DCE-MRI peak enhancement, T2 images, and pharmacokinetically modeled ve and Ktrans. This result warrants further exploration to establish %RC in a population of known progressing patients.
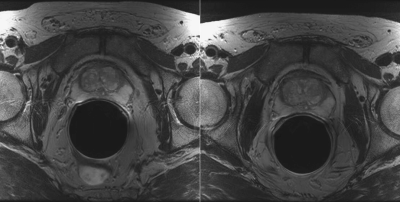
Figure 1. Example of two T2-weighted images of same prostate taken ten months apart
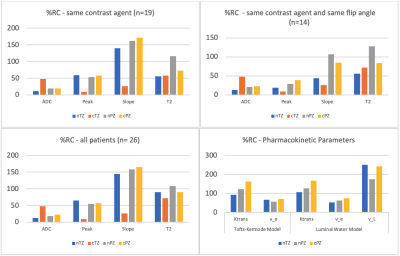
Figure 4. DCE-MRI, DWI, and PK %RC values
-
Low-to-High Field MR Image Quality Transfer
Hongxiang Lin1, Matteo Figini1, Felice D'Arco2, Godwin Ogbole3, David W Carmichael4,5, Ikeoluwa Lagunju6, Helen Cross4,7, Delmiro Fernandez-Reyes6,8, and Daniel C Alexander1
1Centre for Medical Image Computing, Department of Computer Science, University College London, London, United Kingdom, 2Department of Radiology, Great Ormond Street Hospital, London, United Kingdom, 3Department of Radiology, College of Medicine, University of Ibadan, Ibadan, Nigeria, 4Great Ormond Street Institute of Child Health, University College London, London, United Kingdom, 5Department of Biomedical Engineering, King’s College London, London, United Kingdom, 6Department of Paediatrics, College of Medicine, University of Ibadan, Ibadan, Nigeria, 7Great Ormond Street Hospital for Children, London, United Kingdom, 8Department of Computer Science, University College London, London, United Kingdom
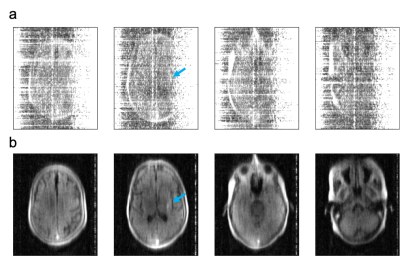
Machine-learning based image quality transfer estimates convincing 1.5T or 3T T1w, T2w, and FLAIR images from 0.36T images revealing fine detail and lesion conspicuity.
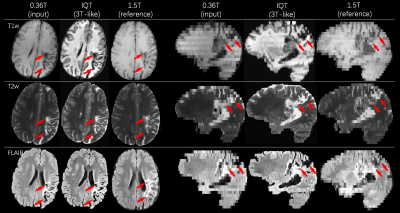
Figure 5: An example of IQT enhancement on real LMIC patient data for T1w, T2w and FLAIR images. Middle cerebral artery ischemia was detected involving the perirolanding regions. The lesion area highlighted by the red arrows shows hyperintense signal in T2w and FLAIR, and hypointense signal in T1w.
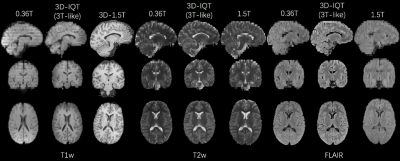
Figure 4: An example of IQT enhancement on real LMIC T1w, T2w and FLAIR images from a normal brain subject. The 1.5T reference has a different orientation with 0.36T input and IQT enhancement. The demonstrated three sequences were enhanced to 3T-like image quality with isotropic voxels. Low-field images show cross-talk and field inhomogeneity artifacts, but they were corrected during IQT Pre-processing.
-
A Paradigm shift in MR physics with Deep Learning Reconstruction: higher image quality and spatial resolution in shorter scan time
Mo Kadbi1, Dawn Berkeley1, Brian Tymkiw1, Hung Do1, and Erin Kelly1
1Canon Medical System USA, Tustin, CA, United States
deep learning
reconstruction allowed increased spatial resolution with maintained image
quality and SNR. Higher resolution images with high image quality and SNR
were obtained in significantly shorter time in various anatomical regions using
Deep Learning Reconstruction.
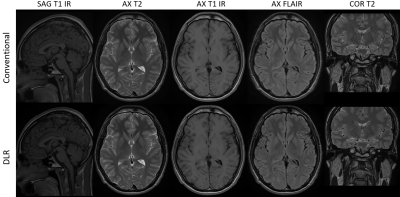
Figure 1: Routine clinical
brain protocol using conventional reconstruction method and resolution (top
row) and DLR method with higher resolution (bottom row). The contrast changed between the DLR and CR
was minimal, indicating that the DLR is a reliable technique to achieve higher
image quality in shorter scan while maintaining the clinical image contrast.
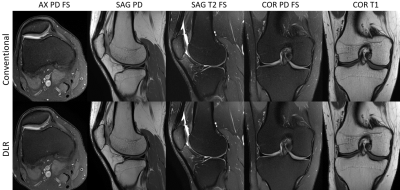
Figure 2: Routine clinical knee protocol using conventional
reconstruction method and resolution (top row) and DLR method with higher
resolution (bottom row).
-
Accelerating Neuroradiology Protocols with Deep Learning MR Image Reconstruction. Which Methods Result in the Highest Perceived Image Quality?
Gregory Avey1, Laura Eisenmenger1, Nathan Kim1, Alexey Samsonov1, James Holmes1, Lloyd Estkowski2, and Tabassum Kennedy1
1University of Wisconsin School of Medicine and Public Health, Madison, WI, United States, 2GE Healthcare, Madison, WI, United States
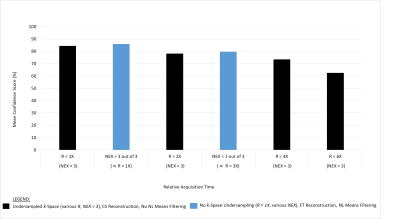
Using Deep Learning (DL) reconstruction to accelerate MRI exam acquisition. DL allows for up to 78% reduction in scan time while matching overall baseline subjective image quality. However, not all acceleration methods are equally favorable to DL acceleration.
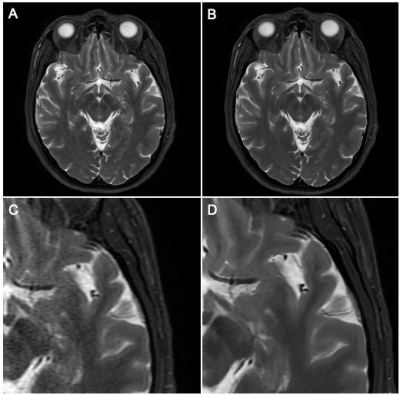
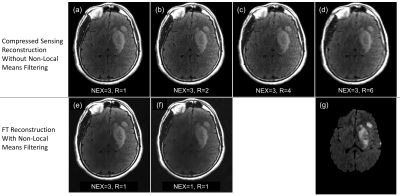
Figure 1. Demonstration of Deep Learning Reconstruction Technique
A. Parallel imaging acceleration factor of 4, conventional Fourier transform reconstruction, 78% reduction in acquisition time from the baseline sequence with increased noise.
B. Same acquisition as in figure A, deep learning reconstruction demonstrating reduction of apparent noise to less than baseline exam with DL reconstruction technique
C. Magnified detail view of A.
D. Magnified detail view of B.
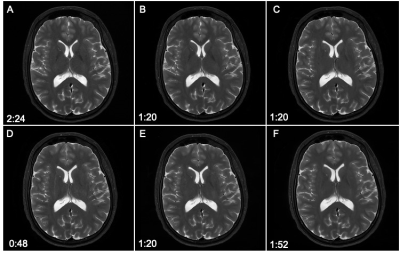
Figure 2.
T2 Weighted Comparisons
A. Baseline T2w FSE – time to acquire 2:24
B. R=2 T2w FSE – time to acquire 1:20
C. R=3 T2w FSE – time to acquire 1:20
D. R=4 T2w FSE – time to acquire 0:48
E. NEX=1 T2w FSE – time to acquire 1:20
F:
Reduced Matrix
T2w FSE – time to acquire 1:52
-
Value of Adopting Fast Brain MRI Techniques for Outpatient Brain MRI: Proof of Principle and Operational Impact During the COVID-19 Pandemic
Min Lang1, Samuel CD Cartmell1, Azadeh Tabari1, Daniel Briggs1, Oleg Pianykh1, John E Kirsch1, Stephen F Cauley1, Wei-Ching Lo2, Seretha J Risacher1, Augusto Lio Goncalves Filho1, Marc D Succi1,3, Otto Rapalino1, Pamela Schaefer1, John Conklin1, and Susie Y Huang1
1Department of Radiology, Massachusetts General Hospital, Boston, MA, United States, 2Siemens Medical Solutions, Boston, MA, United States, 3Medically Engineered Solutions in Healthcare Incubator, Massachusetts General Hospital, Boston, MA, United States
Implementation of fast brain MRI sequences significantly
reduced the gradient times for brain MRI protocols. The projected benefits
include increased imaging volume throughput, improved patient access, and
improved patient and healthcare worker safety during the COVID-19 pandemic.
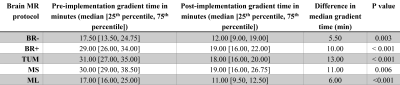
Figure 3. Comparison of gradient times during the pre-implementation period versus
post- implementation period.
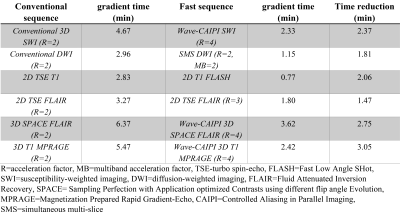
Figure 1. Gradient times of conventional versus fast brain MRI sequences.
-
Abdominal MR imaging on a prototype low-field 0.55T scanner in comparison to a conventional 1.5T scanner
Hersh Chandarana1, Barun Bagga1, Chenchan Huang1, Bari Dane1, Robert Petrocelli1, Mary Bruno1, Mahesh Keerthivasan2, Himanshu Bhat2, Kai Tobias Block1,3, David Stoffel1, and Daniel K Sodickson1
1Radiology, Center for Advanced Imaging Innovation and Research, NYU Grossman School of Medicine, New York, NY, United States, 2Siemens Medical Solutions USA Inc, Malvern, PA, United States, 3Siemens Healthcare GmbH, Erlangen, Germany
Our study shows that diagnostic non-contrast abdominal
imaging with T2W, DWI, and T1WI contrast can be performed within an acquisition
time of 10 minutes or less on low-field scanner with higher and lower strength gradients.

Figure 2: Comparison
of overall image quality for T2WI, DWI, and T1WI on low-field regular gradients,
low-field lower adjusted gradients, and 1.5T scanner.
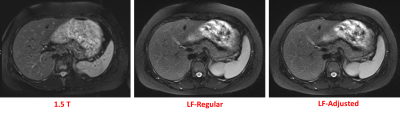
Figure 3: Representative
single axial T2WI in the same volunteer imaged on 1.5T, LF-regular, and LF-lower
adjusted gradients.