-
Using deep neural networks to predict RF heating of implanted conductive leads exclusively from implant trajectory and RF coil features
Jasmine Vu1,2, Bach T Nguyen2, Bhumi Bhusal2, Justin Baraboo1,2, Joshua Rosenow3, Ulas Bagci 2, Molly G Bright1,4, and Laleh Golestanirad1,2
1Biomedical Engineering, McCormick School of Engineering, Northwestern University, Evanston, IL, United States, 2Radiology, Feinberg School of Medicine, Northwestern University, Chicago, IL, United States, 3Neurosurgery, Feinberg School of Medicine, Northwestern University, Chicago, IL, United States, 4Physical Therapy and Human Movement Sciences, Feinberg School of Medicine, Northwestern University, Chicago, IL, United States
The presented deep learning-based framework was
capable of predicting maximum SAR at the tips of implanted conductive leads with
only knowledge of the lead trajectory and the RF coil’s background field in
hand.
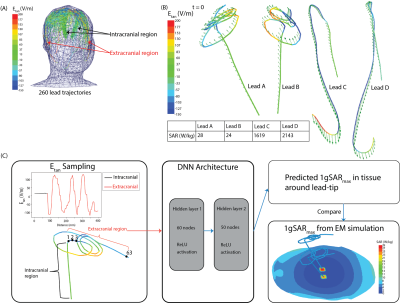
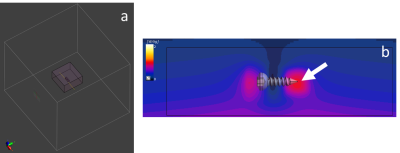
Figure 2: (A) Superposition of Etan
distributions along different lead trajectories. Similar Etan values
were observed along the intracranial regions across lead trajectories. (B)
Distribution of Etan (color field) and the incident electric field
(arrows) for lead trajectories that demonstrate low and high 1gSARmax values.
(C) A DNN was created to predict 1gSARmax using the extracranial Etan
values as inputs into the algorithm due to similarities in Etan values
in the intracranial regions.
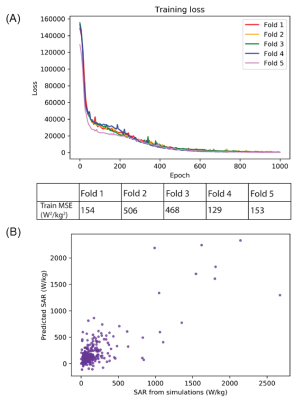
Figure 4: (A) Performance of network training, as
indicated by the mean squared error, for all folds of five-fold
cross-validation. (B)
Predicted 1gSARmax values from testing
of the DNN plotted against the ground-truth 1gSARmax values from
EM simulations.
-
RF-Induced Heating of Medical Devices in an Open Bore MRI
Seoggwan Kim1, Amy Kester1, Alan R. Leewood1, and David C. Gross1
1MED Institute Inc., West Lafayette, IN, United States
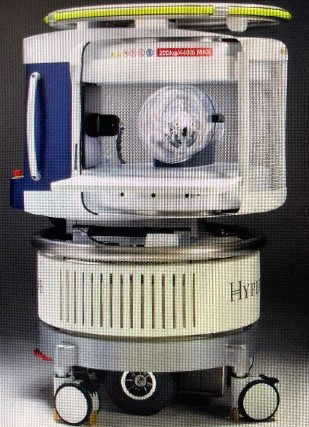
Development and validation of an open bore computational
model were demonstrated in this study. Future experiments and simulations
will be used to quantify RF-induced heating in open bore MRI for the purpose of
MRI labeling of medical devices according to ASTM F2503 [3].
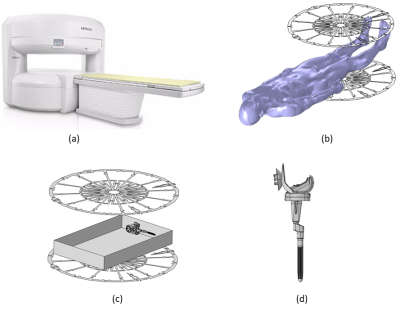
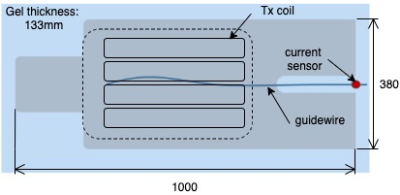
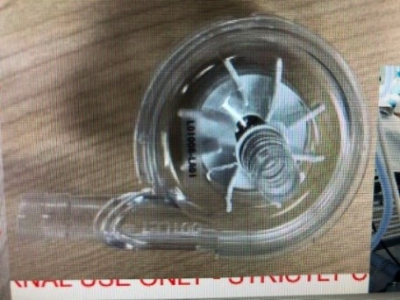
Figure 1: A representative
image of (a) 1.2T Hitachi Oasis open bore MRI system, (b) RF body coil of a 1.2T Hitachi Oasis open
bore MRI system with the Duke human model, (c) RF body coil of 1.2T Hitachi
Oasis open bore MRI system with a knee implant in an ASTM gel phantom (65cm x
42cm x 9cm), and (d) detailed CAD model of a knee implant.
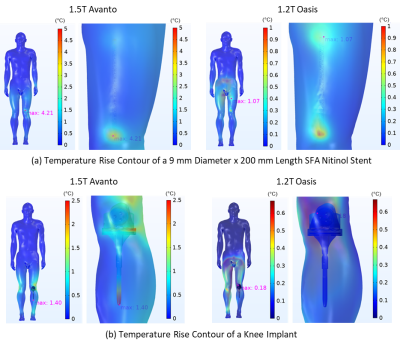
Figure 4: Temperature rise contour of a nitinol SFA stent and
a knee implant within Duke in 1.5T Siemens Avanto closed bore and 1.2T Hitachi
Oasis open bore MRI systems at a scan time of 900 sec.
-
RF Impedance of MR-Conditional Pacemaker Leads when Connected to Implantable Pulse Generators from Different MR-Conditional Systems
David Prutchi1, Jason Meyers1, and Ramez Shehada2
1Impulse Dynamics (USA) Inc., Marlton, NJ, United States, 2Medical Technology Laboratories, La Mirada, CA, United States
The IPG’s contribution to the limitation of RF currents is relatively
small (1.03 to 8.04%, mean 2.72%). A
maximum difference of 4.85% was found for a hybrid system, which is probably
negligible when considering lead impedance variability.
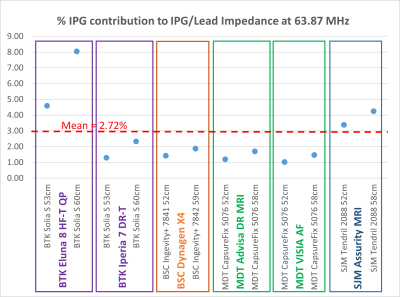
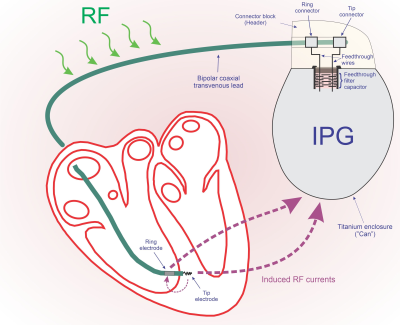
Figure 1: Contribution of IPG input
impedance against the total lead/IPG impedance to 63.87 MHz RF currents at the
lead’s Tip electrode. Lead/IPG pairs are
MR-conditional labeled for whole-body MRI at 1.5T.
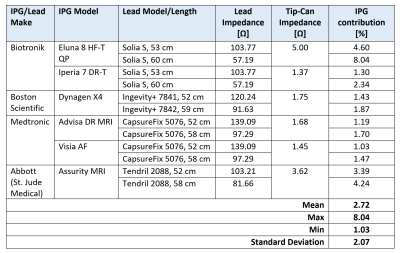
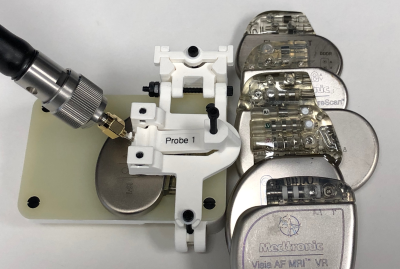
Table 1: Contribution of
IPG input impedance against the total lead/IPG impedance to 63.87 MHz RF
currents at the lead’s Tip electrode.
Lead impedance incorporates the effect of the implantable device’s
enclosure in gel slurry. Lead/IPG pairs are MR-conditional labeled for
whole-body MRI at 1.5T.
-
Importance of Pacemaker Lead Preconditioning for MR Safety In-Vitro Studies
David Prutchi1, Jason Meyers1, and Ramez Shehada2
1Impulse Dynamics (USA) Inc., Marlton, NJ, United States, 2Medical Technology Laboratories, La Mirada, CA, United States
Body fluids change the peak impedance of implanted leads at
MR frequencies, making it critical to precondition leads by soaking in isotonic
saline is critical prior to conducting MR safety testing in-vitro.
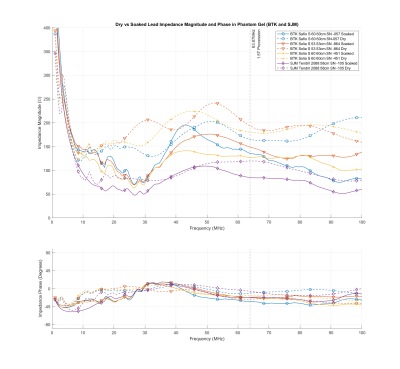
Figure 1: Magnitude and phase of
the Biotronik and Abbott leads before and after soaking for over 10 days in
isotonic saline solution
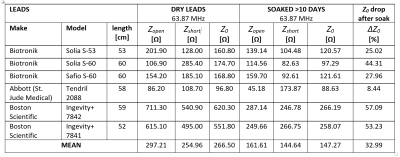
Table 1: Characteristic Impedance at
63.87 MHz of pacemaker leads before and after being soaked for over 10 days in
saline solution
-
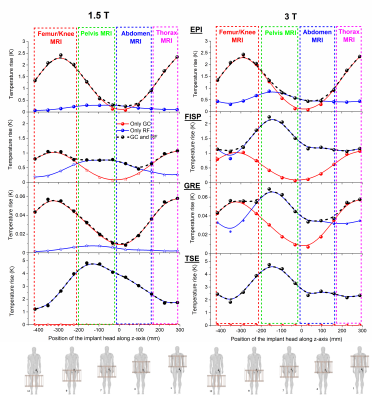
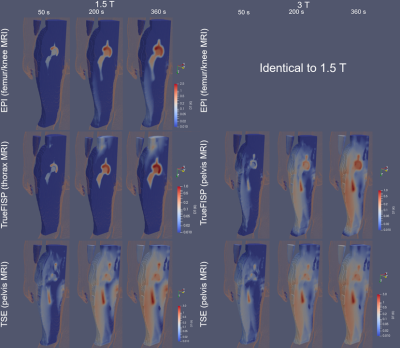
Radio-Frequency Induced Heating of Hip and Knee Implants in the Cylindrical and Planar Systems
Kyoko Fujimoto1, Tayeb A Zaidi1, Dave Lampman2, Josha W Guag1, Shawn Etheridge2, Hideta Habara3, and Sunder S Rajan1
1Center for Devices and Radiological Health, US Food and Drug Administration, Silver Spring, MD, United States, 2Hitachi Healthcare Americas, Twinsburg, OH, United States, 3Healthcare Business Unit, Hitachi, Ltd., Tokyo, Japan
The validated
computational modeling offers a viable approach to compare the potential RF-induced heating risk. The 1.2T planar system showed lower risk of heating of hip and knee implants compared to the
1.5T system. Having different coil designs may improve patient access to MRI
scans.
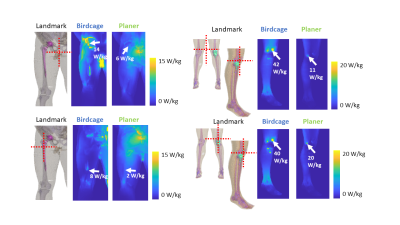
Figure 5: Maximum
intensity projection SAR1g results are shown near the implantable
devices. All the SAR maps were normalized with the B1+ method.
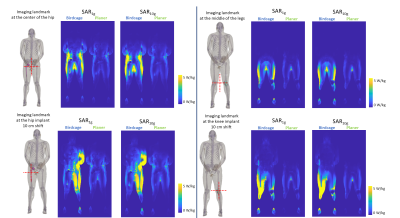
Figure 4:
The slice SAR maps with implants are shown in four different imaging landmarks
for SAR1g and SAR10g. All the SAR maps were
normalized with the B1+ method.
-
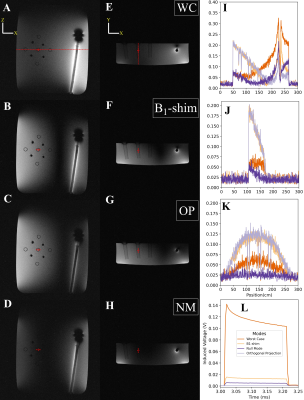
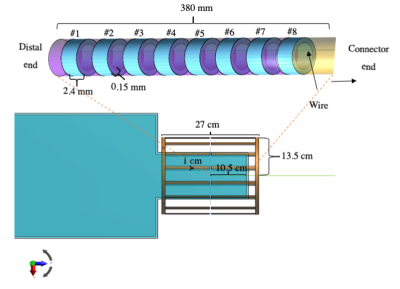
Validation of a new 64MHz RF exposure system for testing medical implants for RF-induced heating according to ASTM-F2182 and ISO/TS 10974
Finya Ketelsen1,2, Kevin Kröninger2, and Gregor Schaefers1,3
1MRI-STaR - Magnetic Resonance Institute for Safety, Technology and Research GmbH, Gelsenkirchen, Germany, 2TU Dortmund University, Dortmund, Germany, 3MR:comp GmbH, Testing Services for MR Safety & Compatibility, Gelsenkirchen, Germany
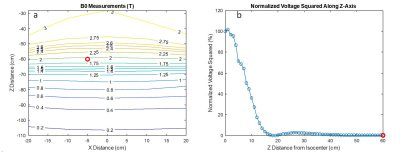
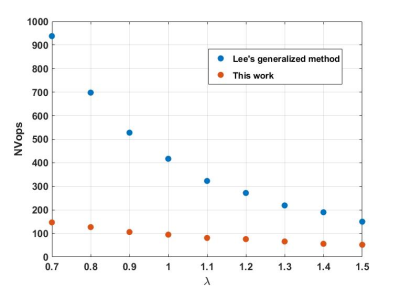
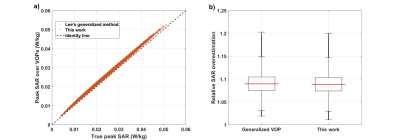
This
study introduced the validation of a new RF field source for testing implants
for RF-induced heating according to ASTM F2182 and ISO/TS 10974. Its ability to
produce different homogeneous fields over a large area qualifies it for testing
all kinds of active and passive implants.
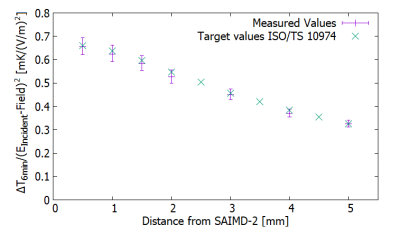
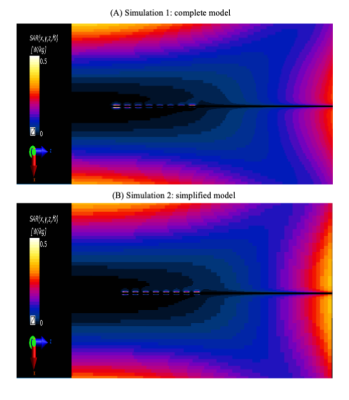
Fig. 5: This figure shows the measured temperature rise
values after six minutes divided by the square of the incident E-field at each
position and the target values from Annex I1.
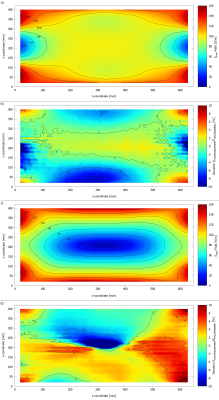
Fig. 4: This figure shows the measured Erms-field
distributions, a) Erms-field at 0° phase, c) Erms-field
at 180° phase and the deviation between measurement and simulation in
b) 0°phase and d) 180° phase.
-
MRI in patients with a cerebral aneurysm clip; Guideline in the Netherlands
Mark BM Hofman1, Cristina Lavini2, Albert van der Zwan3, Carola van Pul4, Sara H Muller5, Mette K Stam6, Marinette van der Graaf7, Carla Kloeze8, Bastiaan J van Nierop9, Wouter Teeuwisse10, Peter Kappert11, Evie EM Kolsteren12, Kristie Venhorst12, and Joost PA Kuijer13
1Radiology and Nuclear Medicine, Amsterdam UMC, Vrije Universiteit, Amsterdam, Netherlands, 2Radiology and Nuclear Medicine, Amsterdam UMC location AMC, Amsterdam, Netherlands, 3, Neurology and Neurosurgery, UMC Utrecht Brain Center, Utrecht, Netherlands, 4Maxima Medical Centre, Eindhoven, Netherlands, 5Antoni van Leeuwenhoek Hospital, Amsterdam, Netherlands, 6Radiology, LUMC, Leiden, Netherlands, 7Imaging, Radboud UMC, Nijmegen, Netherlands, 8Catharina Hospital, Eindhoven, Netherlands, 9Radiology and Nuclear Medicine, University Medical Centre Utrecht, Utrecht, Netherlands, 10CJ Gorter Center for High Field MRI, LUMC, Leiden, Netherlands, 11Radiology, UMCG, Groningen, Netherlands, 12Knowledge Institute Medical Specialists, Utrecht, Netherlands, 13Radiology and Nuclear Medicine, Amsterdam UMC, Vrije Universiteit Amsterdam, Amsterdam, Netherlands
Can a patient with an aneurysm clip undergo an MRI exam? The Dutch Association of Medical
Specialists wrote a guideline that includes a decision flow diagram and the
risk estimates whether an unknown clip type might be ferromagnetic.

Figure
1: Flowchart with decision tree for MRI examination in
patient with a cerebral aneurysm clip, with references to Tables numbers in
this ISMRM abstract (which differ in numbering from the full guideline). Zoom in your browser to read. While considering all evidence and considerations it
was recognized that withholding an MR exam for large patients groups in which
it is likely but not entirely certain that the aneurysm clip is
non-ferromagnetic, will impact patient’s diagnostics.
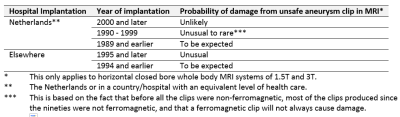
Table 4: Probability that an unknown type of cerebral aneurysm clip is not safe
for MRI; as estimated by the working group.
-
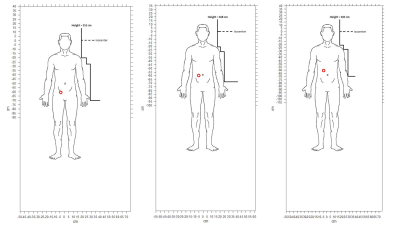
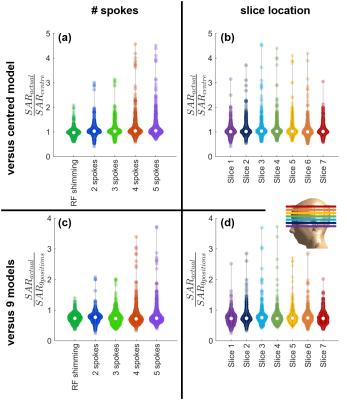
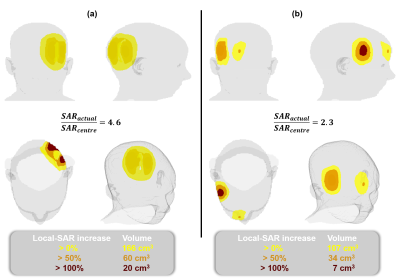
Pediatric Patient Positioning Can Reduce Local-SAR at the Pacemaker Lead-tip During MRI Exams
Jessica A. Martinez1 and Daniel B. Ennis1,2,3
1Department of Radiology, Stanford University, Stanford, CA, United States, 2Cardiovascular Institute, Stanford University, Stanford, CA, United States, 3Maternal & Child Health Research Institute, Stanford University, Stanford, CA, United States
Lead-tip local-SAR for thoracic pediatric with CIEDs MRI exams can be substantially reduced using a supine, feet-first orientation. If the exam must be performed in a supine head-first, a leftward transversal displacement, lateral rotation, or Fowler position may mitigate local-SAR.
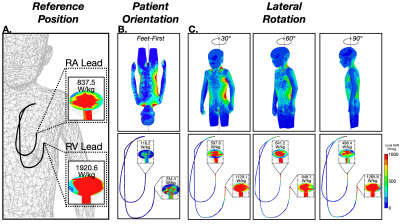
Figure 2. (A) SAR maps and 1-gram local-SAR values for RA and RV leads for the reference position (supine and head-first). (B) SAR maps and 1-gram local-SAR values for a feet-first patient orientation is substantially reduced. (C) Right-left lateral rotations also substantially reduce the 1-gram local-SAR.
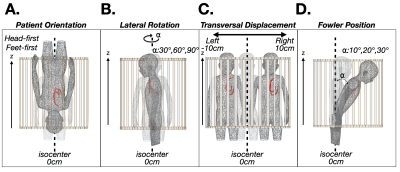
Figure 1. Patient position and orientation variations: (A) head-first vs. feet-first; (B) lateral rotation; (C) transverse left-right displacement; and (D) Fowler position. Each was compared to the local-SAR value with respect to a reference position (shaded, supine and head-first) for a thoracic exam.
-
RF safety simulation of 128-channel EEG net on a 29-month-old whole-body model at 3T
Hongbae Jeong1,2 and Giorgio Bonmassar1,2
1Athinoula A. Martinos Center for Biomedical Imaging, Massachusetts General Hospital, Charlestown, MA, United States, 2Department of Radiology, Massachusetts General Hospital/Harvard Medical School, Boston, MA, United States
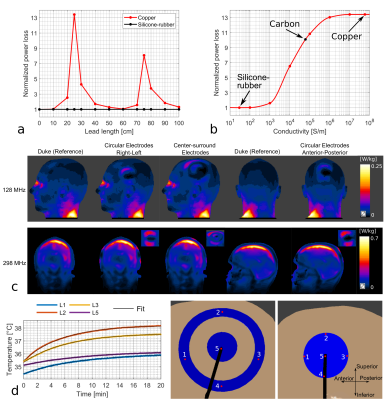
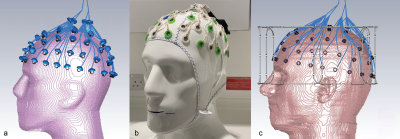
The SAR of a 29-month-old child with a 128-channel EEG net at 3T was presented. The EEG net designed for MR-compatible use could generate additional heating near the position of the electrode on the skin, but the amount of SAR was estimated within the safety limit with the thin film based EEG trace.
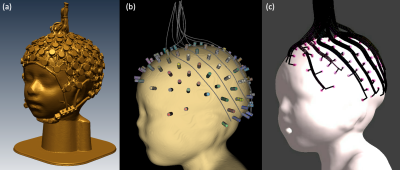
Figure 2.:The simulation set-up for the EEG traces and sponges. (a) shows the 3D scanned EEG net put on the 29-month-old head mock-up, (b) shows the position of the sponges which is chosen from (a) and used as the reference points for the EEG trace allocation, (c) shows the final drawing of 128 channel EEG traces connected on sponges on the head of the 29-month-old boy voxel model.
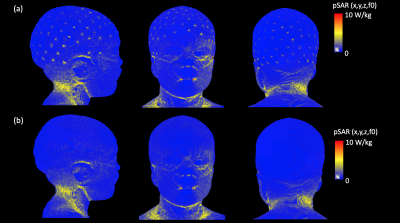
Figure 5: EM simulation results. (a) pSAR results displayed in the surface of the 29-month-old voxel model with a 128-channel EEG net, (b) pSAR results in the surface of the 29-month-old without an EEG net (In both cases, the simulation results are normalized to 2µT at the coil center)
-
Experimental validation of simulated implant heating induced by switched gradient fields
Rüdiger Brühl1, Thomas Schwenteck1, Bernd Ittermann1, Fabio Baruffaldi2, Alessandro Arduino3, Umberto Zanovello3, Luca Zilberti3, Mario Chiampi3, and Oriano Bottauscio3
1Physikalisch-Technische Bundesanstalt (PTB), Berlin, Germany, 2IRCCS Istituto Ortopedico Rizzoli, Bologna, Italy, 3Istituto Nazionale di Ricerca Metrologica (INRIM), Torino, Italy
The heating of bulky metallic implants due to switching MR gradients can be simulated. Numerical simulations are compared with experiments and show a difference of about 8 % in temperature rise.
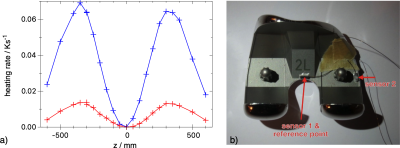
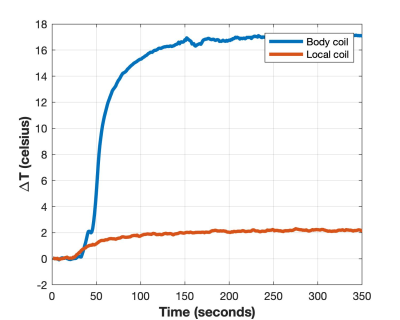
Fig 2a: Experimental heating rate of a knee implant #3 at $$$t=0, x=0, y=0$$$ and various $$$z$$$ positions in a clinically relevant orientation. The signal of the central sensor 1 is shown in blue, the lateral in red.
Fig 2b: An axial view of the knee implant with two NTC sensors mounted in sockets that are glued on the implant.
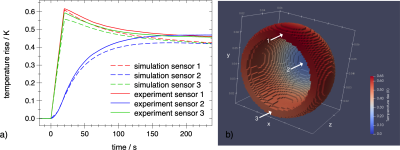
Fig 1a: Comparison of experimental (solid) and simulated (dashed) eddy-current heating of hip implant #1 at scanner coordinates $$$z=-300 \text{ mm}, y=-50 \text{ mm}, x=-145 \text{ mm}$$$. Central sensor in blue, sensors located on the rim in red and green. The EPI sequence was applied from $$$t=0 \text{ to } 20 \text{ s}$$$. The main eddy current circulates along the rim with its large cross section to the vector field $$$dB/dt$$$ of the read gradient z.
Fig 1b: Simulated temperature rise distribution at $$$t=20 \text{ s}$$$. The arrows indicate the sensor positions.
-
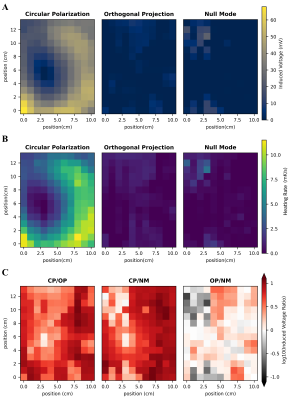
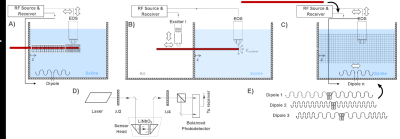
Numerical Simulation study on the effects of intentionally inhomogeneous E-field distributions on RF-induced heating of implants
Vincent Hammersen1, Finya Ketelsen1, Andreas Rennings2, and Gregor Schaefers1,3
1MRI-STaR Magnetic Resonance Institute for Safety Technology and Research GmbH, Gelsenkirchen, Germany, 2General and Theoretical Electrical Engineering (ATE), University of Duisburg-Essen, Duisburg, Germany, 3MR:comp GmbH, Gelsenkirchen, Germany
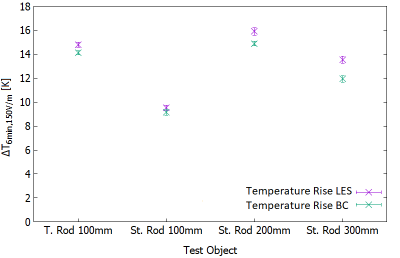
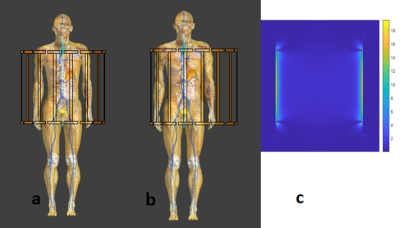
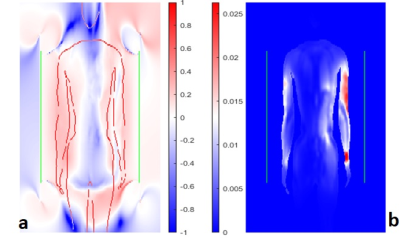
This study indicates that inhomogeneous E-field excitement
of test objects even within the ±1dB and ±20° phase shift limits can have a
major impact on the RF-induced heating of implants. Local
field Magnitude und directions should not be disregarded.
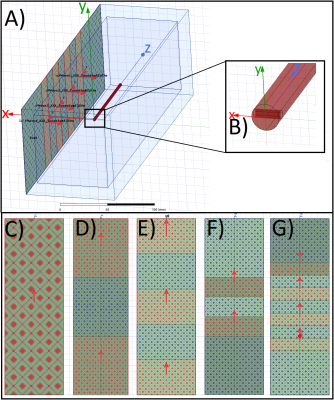
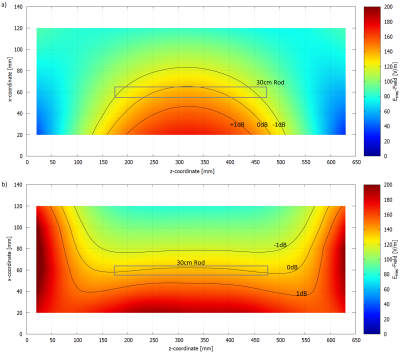
A)
HFSS setup with a central test object and in-phase Plane
Wave excitation (red dotted), separated by radiation boundaries (blue dotted). Remaining
surfaces are terminated by
PML boundaries. Outer Box is the overall
Simulation Box; Inner Box is the VLD export box. B) close up of the titanium
rod tip C) single PW source, D) dual outer PW sources (also used for phase
variations), E) three PW sources, F) two inner PW sources and G) four inner PW
sources. The 300mm central line is identical with the z-axis.
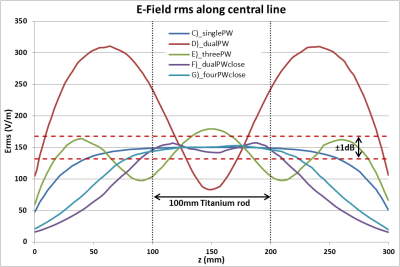
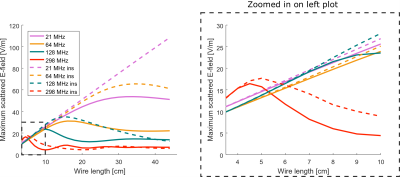
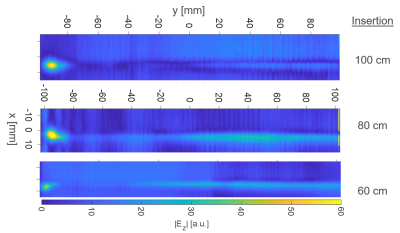
Root
Mean Square of the tuned (150V/m) E-Field Magnitude for the five different
excitation setups along a 300mm central line in the centre of the simulation
volume. The 100mm tuning line, resp. the test object, is situated between 100mm
and 200mm. The dotted red lines indicate the ±1dB (12%)
limitation.
-
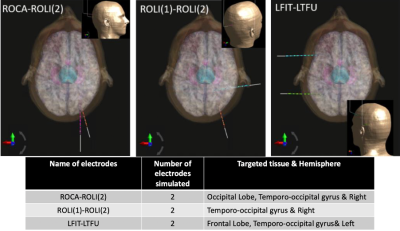
Lead electromagnetic models for RF-induced heating in multi-electrode cortical implants
Mubashir Hussain1 and Gregor Schaefers1,2
1Magnetic Resonance Institute for Safety, Technology and Research GmbH, Gelsenkirchen, Germany, 2MR:comp GmbH, Testing Services for MR Safety & Compatibility, Gelsenkirchen, Germany
Lead electromagnetic models based on transfer functions of multi-electrode leads of cortical implant are developed
to estimate the net deposited power at the electrode array for an arbitrary
lead pathway.
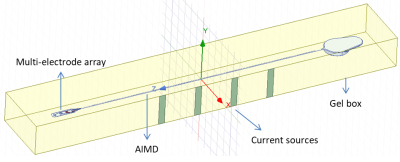
Figure 2. Setup
for generating artificial tangential electric fields along the lead.
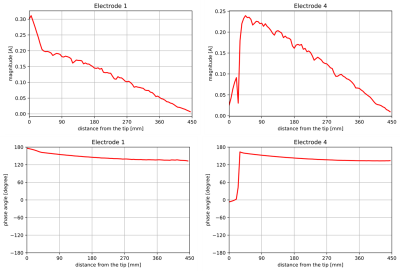
Figure 3. Transfer
function of wires with electrode 1 and electrode 4.
-
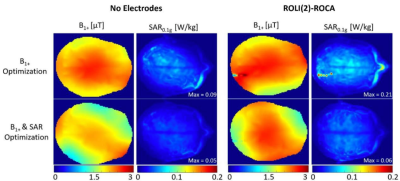
Numerical Modelling of a Close-fitting 8-channel Transceiver Head Coil and EEG Electrodes for Safety Validation at 7T
Paul Mcelhinney1, Sarah Allwood-Spiers2, Gavin Paterson1, Marios Philiastides1, and Shajan Gunamony1
1University of Glasgow, Glasgow, United Kingdom, 2NHS Greater Glasgow and Clyde, Glasgow, United Kingdom
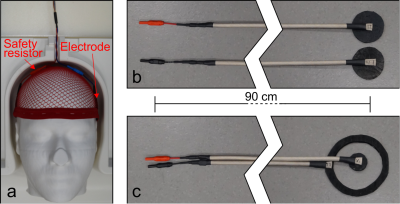
Simulations show that the overall
distribution of SAR within the human body models used is altered with the
addition of the EEG cap, however the magnitude is either reduced, or only
marginally altered.
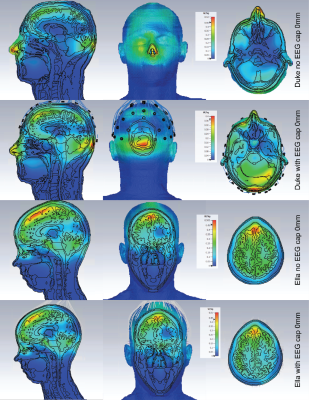
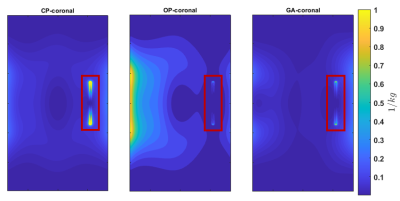
SAR maps of the maximum axial, coronal and
sagittal slices are shown for Duke and Ella at 0mm, with and without the
presence of the EEG cap.
EEG
cap and electrodes, shown on the sucrose/saline phantom (Fig.2a). View of the
electrodes and the connecting wires on the sucrose phantom in CST. The lumped
elements representing 5kΩ resistors are shown. Care was taken to
distribute the wires in the same positions as the physical cap (Fig.2b). A
similar model from CST showing the EEG electrodes in place on the Ella model.
The lumped elements are hidden in this view (Fig.2c).
-
MRI in patients with a prosthetic heart valve, annuloplasty ring or mitra clip; Guideline in the Netherlands
Mark BM Hofman1, Carla Kloeze2, Bastiaan J van Nierop3, Sara H Muller4, Joost PA Kuijer1, Kristie Venhorst5, Cristina Lavini6, Mette K Stam7, Carola van Pul8, Wouter Teeuwisse9, Marco JW Gotte10, Peter Kappert11, Evie EM Kolsteren5, and Marinette van der Graaf12
1Radiology and Nuclear Medicine, Amsterdam UMC, Vrije Universiteit Amsterdam, Amsterdam, Netherlands, 2Catharina Hospital, Eindhoven, Netherlands, 3Radiology and Nuclear Medicine, University Medical Centre Utrecht, Utrecht, Netherlands, 4Antoni van Leeuwenhoek Hospital, Amsterdam, Netherlands, 5Knowledge Institute Medical Specialists, Utrecht, Netherlands, 6Radiology and Nuclear Medicine, Amsterdam UMC location AMC, Amsterdam, Netherlands, 7Radiology, LUMC, Leiden, Netherlands, 8Maxima Medical Centre, Eindhoven, Netherlands, 9CJ Gorter Center for High Field MRI, LUMC, Leiden, Netherlands, 10Cardiology, Amsterdam UMC, Vrije Universiteit Amsterdam, Amsterdam, Netherlands, 11Radiology, UMCG, Groningen, Netherlands, 12Imaging, Radboud UMC, Nijmegen, Netherlands
Can a patient with a prosthetic
heart valve undergo MRI? The Dutch Association of Medical Specialists (FMS)
wrote a guideline. The recommendation: scan the patient with an 1.5T or 3T
whole body MRI system with a horizontal closed bore superconducting magnet without
further restrictions.
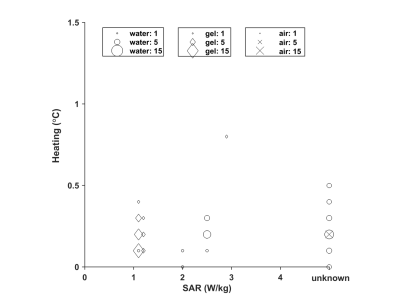
Figure 3: Measured temperature
increase compared to reference of an implant in a phantom of gel (Δ), water (o), or air (X) in the literature (unknown
SAR value on the right). The symbol size is proportional to the number of values
reported.
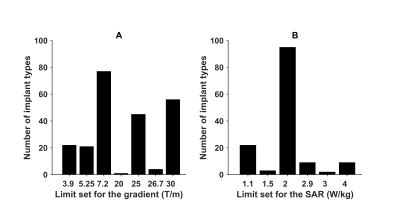
Figure
1: Number of implant types for which a certain gradient limit is set by the
manufacturer (A) and number a certain SAR limit is set by the manufacturer (B),
from MagResoure.
-
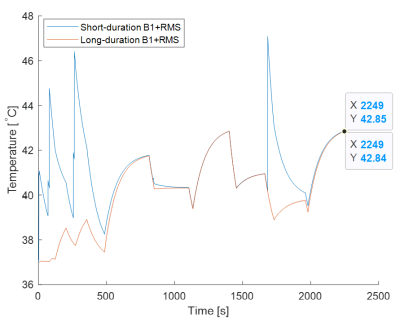
Comparing RF Heating Based on SAR vs. B1+RMS MRI Conditional Labeling
Negin Behzadian1 and Shiloh Sison2
1Research and Development, Abbott, Sylmar, CA, United States, 2Research and Development, Abbott, Sunnyvale, CA, United States
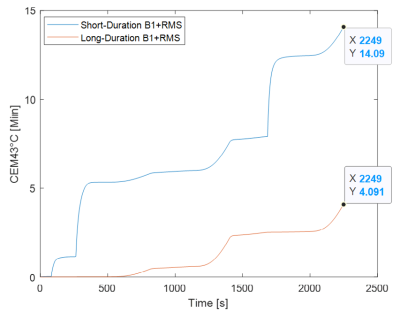
Typical 3T B1+RMS MRI conditional labeling
such as 2.8uT is found to potentially limit scan protocols with SAR levels
above 1.5W/kg under Normal Operating Mode and above 1.7W/kg under First Level
Controlled Operating Mode.
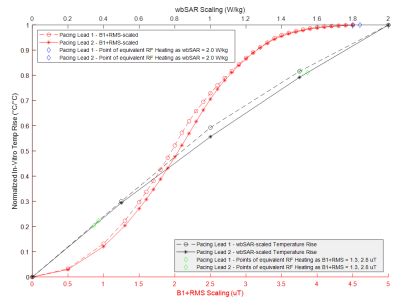
Figure
1: Normalized 3T MRI RF-Induced In-Vitro Temperature Rise at Different Fixed
wbSAR and B1+RMS Levels under Normal Operating Mode for Two
Different Cardiac Pacing Leads
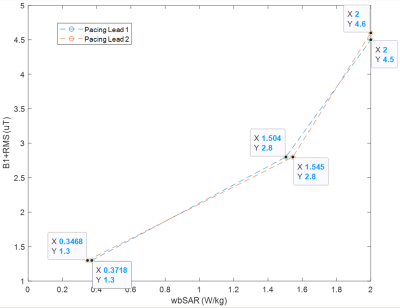
Figure 3: Points of Equivalent 3T MRI RF-induced Heating for B1+RMS
vs. wbSAR Scaling under Normal Operating Mode for Two Different Cardiac Pacing
Leads
-
Quantification of safety and image quality in low field MRI in the presence of medical implants.
Camille D.E. Van Speybroeck1, Wouter M. Teeuwisse1, Tom O'Reilly1, Paul M. Arnold2, and Andrew G. Webb1
1G.J. Gorter Center for High Field MRI, Leiden University Medical Center, Leiden, Netherlands, 2Neurosurgery, Carle Foundation Hospital, Urbana, IL, United States
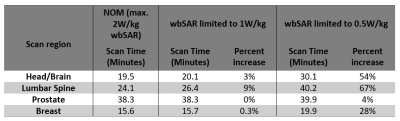
On very low
field MRI systems image artifacts are significantly reduced compared to 3T
despite much weaker gradients, SAR limits can potentially be reached using
short RF pulses and inter-echo TSE times, and some medical implants are MR
unsafe.
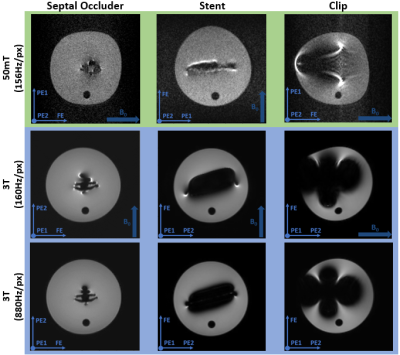
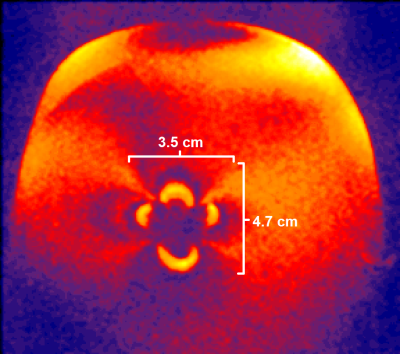
Figure 2 Susceptibility artifacts from the
septal occluder, the stent and the endoscopic clip. A bandwidth of 156Hz/pixel
is used on the 50 mT system (top row), which is matched by the first 3 T scan
(middle row), whilst the bottom row shows the 3 T images acquired with 880Hz/pixel.
In the images the direction of the main magnetic field (B0) and the
frequency- and the two phase-encoding directions are indicated.
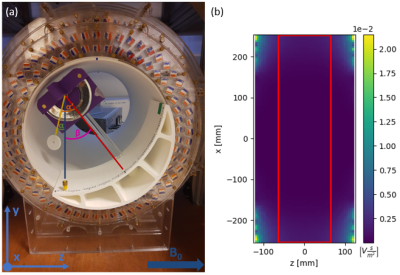
Figure 1 (a)
The setup for the magnetically induced displacement force measurement inside
the 50 mT system with the angle of deflection α’, angle of rotation β and absolute angle of deflection α indicated. It is based on the F2052-15 ASTM
protocol4 with the additional capability of rotating the device to enable
measurement of the variation along the z-axis. (b) The central xz-plane of the
simulation data for the scalar gradient of the magnetic field, with the measurable
area (red) indicated.
-
A Single Setup Approach for the MRI-based Measurement and Validation of the Transfer Function of Elongated Medical Implants
Peter Stijnman1,2, Arcan Erturk3, Cornelis van den Berg1, and Alexander Raaijmakers1,2
1Computational Imaging, UMC Utrecht, Utrecht, Netherlands, 2Biomedical Engineering, Eindhoven University of Technology, Eindhoven, Netherlands, 3Medtronic, Minneapolis, MN, United States
We performed a TF measurement and validation study using a new validation method. Simulated incident electric fields of local transmit coils and the measured TF were used to predict tip heating, verified by temperature probe measurements showing excellent agreement ($$$R^2\geq0.977$$$).
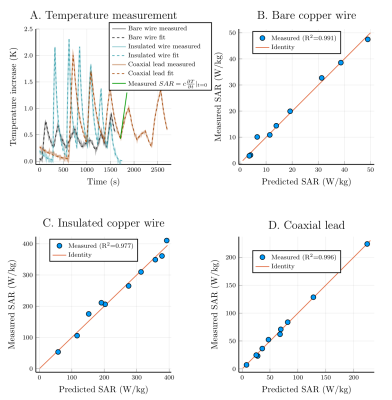
A.) shows the measured temperature at the tip of the lead. Only the measurements done with the smaller loop coil are shown, a similar set of measurements were done with a larger loop coil. The slope of the temperature increase at the start of each separate heating test is used to obtain the (measured) SAR at the temperature probe for that specific heating test. The (predicted) SAR that is calculated using the transfer function and the known exposure condition is correlated with the measured SAR showing good agreement for all three leads.
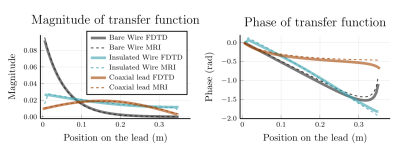
A comparison between the transfer functions obtained with FDTD simulations and the transfer function obtained with MRI measurements are shown. The left plot shows the normalized magnitude of the TF and the right plot shows the phase of the TF.
-
Analysis on 1.5T MR clinical scan time of patients from multiple imaging centers
Yuqing Wan1, Nathan Ooms2, Paul Nguyen1, and Guangqiang (Jay) Jiang1
1Axonics Modulation Technologies, Irvine, CA, United States, 2Purdue University, West Lafayette, IN, United States
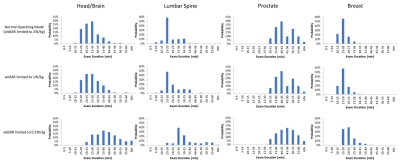
Exam durations of 974 patients from two imaging sites are reported for various scan regions. Disparities were found between sites. This information is also useful for implant device manufacturers to
define practical MRI conditions that
improve the patients’ overall MR experience.
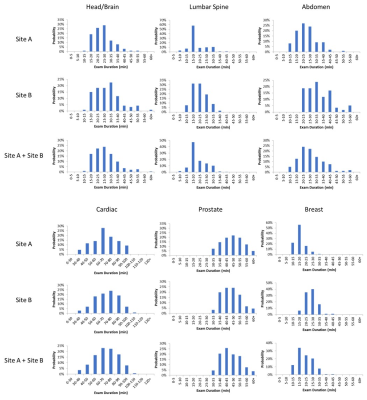
Figure 1 Distributions of the examination duration for scan
regions for Site A, Site B and Site A and B combined.
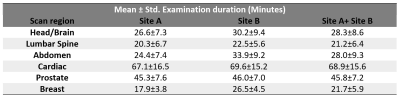
Table
2 Mean and standard deviation of the examination
duration for each scan region across the imaging sites
-
An anthropomorphic phantom for deep brain stimulation MRI safety investigations
Benson Yang1,2, Fred Tam1, Benjamin Davidson3, Clement Hamani3,4, Nir Lipsman1,3,4, Chih-hung Chen2, and Simon J Graham1,5
1Physical Sciences, Sunnybrook Research Institute, Toronto, ON, Canada, 2Electrical and Computer Engineering, McMaster University, Hamilton, ON, Canada, 3Division of Neurosurgery, Sunnybrook Health Sciences Centre, Toronto, ON, Canada, 4Harquail Centre for Neuromodulation, Sunnybrook Research Institute, Toronto, ON, Canada, 5Department of Medical Biophysics, University of Toronto, Toronto, ON, Canada
The radiofrequency heating results showed temperature elevation differences when the deep brain stimulation device was power on and off in the heterogeneous phantom setup and when compared to a homogeneous phantom setup.
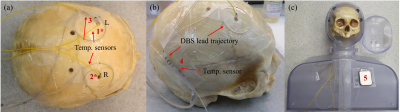
Figure 2: Gelatin-filled human skull with implanted deep brain stimulation (DBS) leads
and fiber-optic temperature sensors, and the assembled phantom: (a) location of
the temperature sensors: sensors 1* and 2* implanted inside the skull and
sensor 3 at the spiral trajectory; (b) right DBS lead trajectory and temperature
sensor 4 and (c) assembled phantom prior to the final fill and temperature
sensor 5 [7].
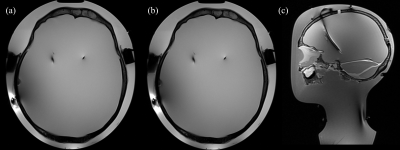
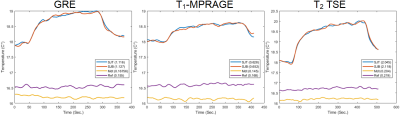
Figure 4: Turbo
spin-echo images of the phantom: (a) reconstructed transverse view for
implantable pulse generator (IPG) off using transmit/receive birdcage coil; (b)
reconstructed transverse view for IPG on using transmit/receive birdcage coil;
and (c) a reconstructed sagittal view for phantom illustration purposes using
20 channel receive-only head and neck array coil and body coil for transmission
[7].