-
Development and evaluation of a numerical simulation approach to predict metal artifacts from passive implants in MRI
Tobias Spronk1,2,3, Oliver Kraff1, Gregor Schaefers3,4, and Harald H Quick1,2
1Erwin L. Hahn Institute for MR Imaging, University of Duisburg-Essen, Essen, Germany, 2High-Field and Hybrid MR Imaging, University Hospital Essen, Essen, Germany, 3MRI-STaR Magnetic Resonance Institute for Safety, Technology and Research GmbH, Gelsenkirchen, Germany, 4MR:comp GmbH, Testing Services for MR Safety & Compatibility, Gelsenkirchen, Germany
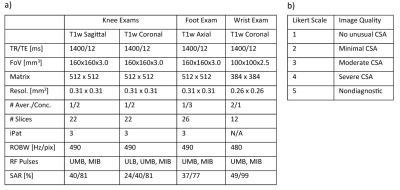
This study presents a
numerical simulation approach that predicts the MR image artifact size of
passive medical implants with a high accuracy.
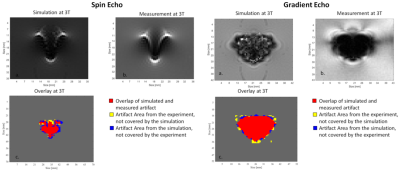
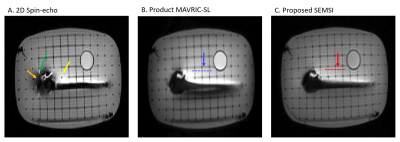
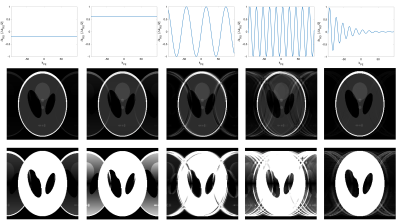
(A) Simulated spin echo and gradient echo images of a
titanium rod acquired on a 3 T MRI
system. (B) Measured spin echo and
gradient echo image of the titanium rod. (C) Overlay
of the artifacts from image (A) and
(B). Red color: both artifacts are congruent; yellow: measured artifact
only; blue: simulated artifact only.
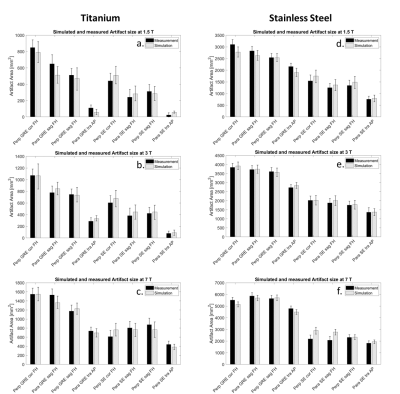
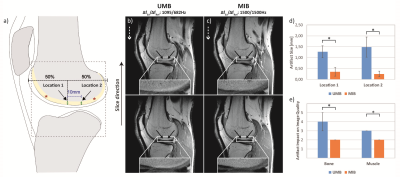
This figure compares the artifact size of the titanium
(A-C) and stainless steel (D-F) rod of the simulations (light grey) and the
measurements (black) in mm2 separated by the different field
strengths, (A,D) 1.5 T, (B,E) 3 T, (C,F) 7 T. Artifact sizes are shown for
different implant orientations in regard to B0 (para: parallel and
perp: perpendicular), sequences (GRE and SE), slice orientations in regard to
implant orientation (cor, sag, tra), and phase-encoding direction (FH, AP).
-
Realistic Simulation of MRI Metal Artifact and Field Strength Dependence
Kübra Keskin1, Brian Hargreaves2,3,4, and Krishna S. Nayak1,5
1Electrical and Computer Engineering, University of Southern California, Los Angeles, CA, United States, 2Radiology, Stanford University, Stanford, CA, United States, 3Electrical Engineering, Stanford University, Stanford, CA, United States, 4Bioengineering, Stanford University, Stanford, CA, United States, 5Biomedical Engineering, University of Southern California, Los Angeles, CA, United States
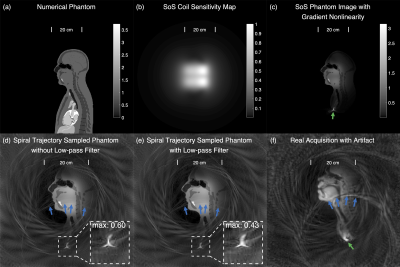
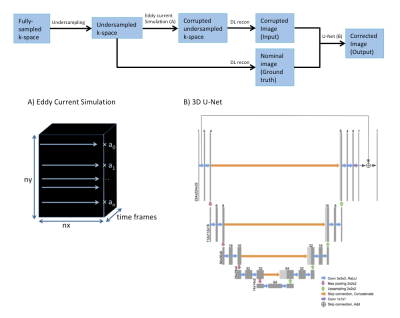
We demonstrate a pipeline for realistic simulation of
in-vivo MRI around metal. We use this
simulator to predict the performance of multi-spectral imaging on emerging
low-field systems (e.g. 0.55 Tesla) and predict optimal imaging parameters.
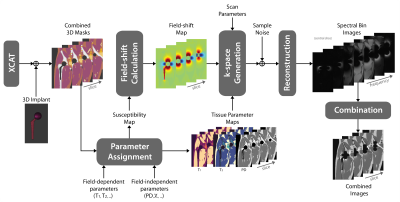
Figure 1: Simulation
Pipeline. 3D XCAT body and implant masks are utilized to create tissue
parameter maps. The susceptibility map is used to calculate the field shift. K-space
is simulated using the field shift, proton density (PD) and MSI sequence
parameters with phase encoding in both left-right and anterior-posterior
directions. Complex Gaussian noise is added in k-space. Spectral bin images are
reconstructed and combined with quadrature summation.
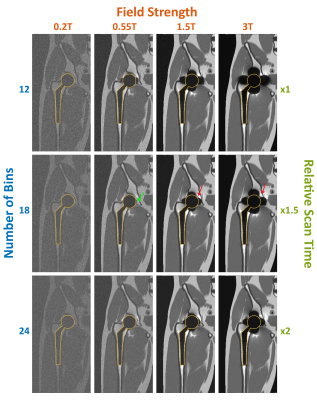
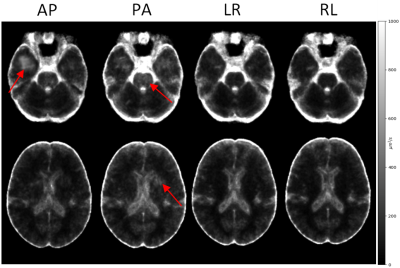
Figure 2: MAVRIC-SL simulation of total hip arthroplasty. Central coronal slices from 3D volumes are shown for B0 = 0.2T,
0.55T, 1.5T, 3T, and Nbins = 12, 18, 24. Other parameters: BW/pixel = 625Hz;
RF bandwidth = 2.25kHz and bin spacing 1kHz. Implant contours are shown with yellow
outlines. Artifacts around the implant are indicated with red arrows. A small artifact
adjacent to implant surface at 0.55T is shown with green arrow. Total scan times
are 3:53, 5:49, and 7:45 for Nbins of 12, 18, and 24, respectively.
-
Joint estimation of image content and field inhomogeneity for artifact correction near metallic implants
Alexander R Toews1,2, Daehyun Yoon1, and Brian A Hargreaves1,2,3
1Radiology, Stanford University, Stanford, CA, United States, 2Electrical Engineering, Stanford University, Stanford, CA, United States, 3Bioengineering, Stanford University, Stanford, CA, United States
Conventional multispectral imaging mitigates geometric distortion near metal at the expense of readout blur and residual intensity artifacts. Phantom and simulation results demonstrate the proposed method reduces readout blur and in some cases eliminates residual intensity artifacts.
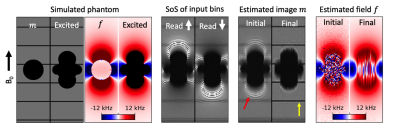
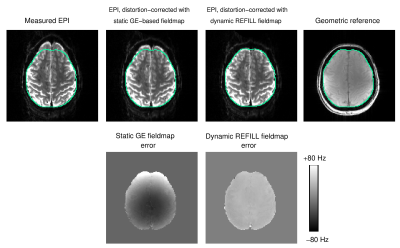
Figure 3: Simulated phantom study of a ball with magnetic susceptibility 900 ppm at 3T. Input images exhibit readout blur and ripple artifact due to VAT. Ripple artifacts are reduced in the initial image (red arrow) and eliminated in the final estimation of $$$m$$$. Grid lines are sharper in the final image (yellow arrow), indicating mitigation of the VAT blur effect. Final $$$f$$$ agrees well with the true field within the region of excited spins.
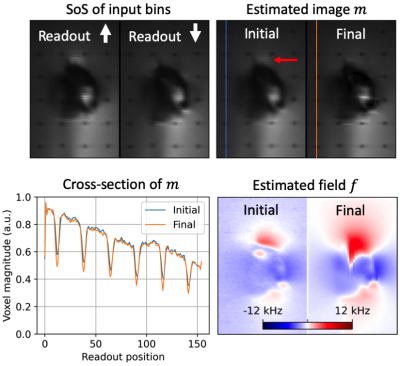
Figure 5: Results in shoulder phantom shown for an off-center coronal slice. Ripple-like intensity artifacts are apparent in the input and initial images (red arrow), but significantly reduced in the final image. Differences in readout resolution are less apparent than in Figure 4 due to the absence of grid lines.
-
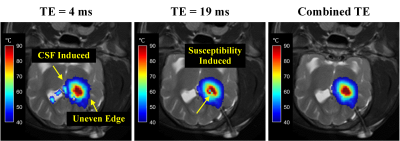
Accurate mUlti-echo phase image wiTh uneven echO spacing and Ultra-High Dynamic Range (AUTO-HDR)
Yuheng Huang1,2, Xinheng Zhang1,2, Serry Fradad1, Lu Meng1, Ghazal Yoosefian1, Linda Azab1, Xinqi Li3, Alan Kwan4, Rohan Dharmakumar1, Hui Han1, and Hsin-Jung Yang1
1Biomedical Imaging Research Institute, Cedars Sinai Medical Center, Los Angeles, CA, United States, 2Bioengineering, UCLA, Los Angeles, CA, United States, 3Columbia University, New York, NY, United States, 4Cardiology, Cedars Sinai Medical Center, Los Angeles, CA, United States
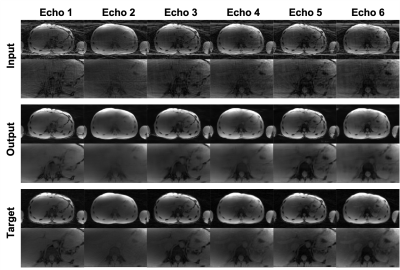
An accurate and reliable
phase mapping algorithm with Ultra-High dynamic range was developed using a multi-echo
GRE sequence with uneven echo spacing and iterative reconstruction.
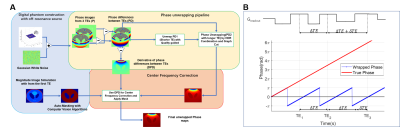
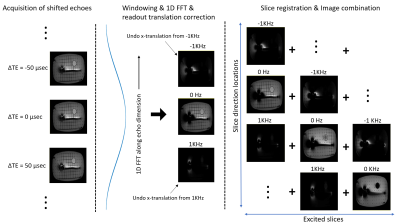
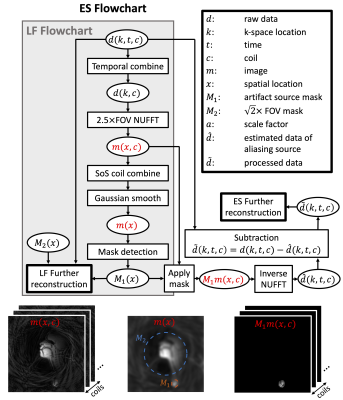
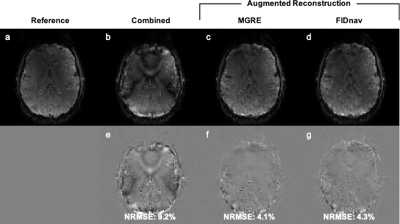
Figure 1. Image processing flow chart and the
uneven echo spacing. The image processing pipeline is presented in panel A. Phase
images were first combined with a graph-cut algorithm to conduct high SNR phase
maps. The central frequency and unwrapping artifact were further calibrated
from the derivative of the phase difference maps between the uneven DTEs. The phase accumulation from the uneven
echo spacing is presented in panel B.
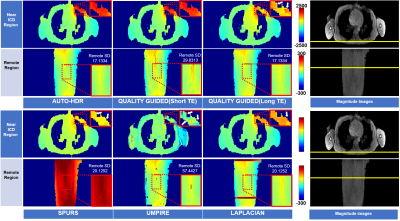
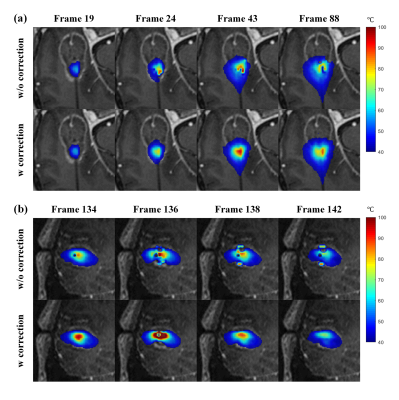
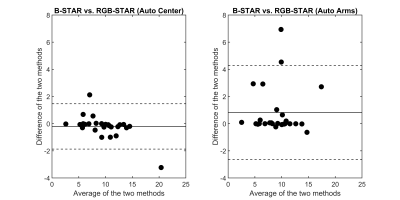
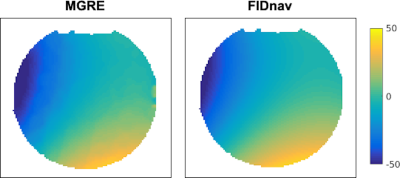
Figure 5. In-vivo images from a healthy human volunteer with an ICD on the chest. In the presents of ICD, the compromised image SNR and strong phase accumulation
from the off-resonance source lead to obvious phase unwrapping artifacts and
central frequency shifts in the peer algorithms (arrows). The proposed AUTO-HDR
shows a much smoother field map around the ICD and higher SNR at a region
further away from the ICD. The improved field map demonstrates the capability
of AUTO-HDR in resolving fast varying phase change while preserving high SNR in
human subjects with metallic implants.
-
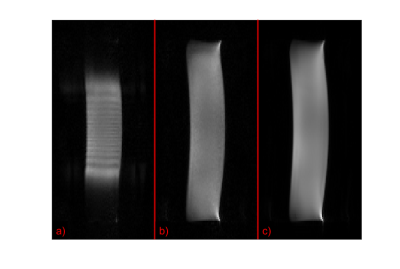
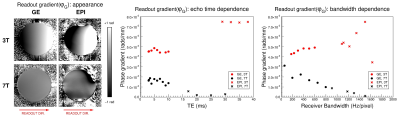
Directional effect of frequency-encoding gradient on T2WI-STIR imaging: a phantom study to evaluate the metal artifact
Xu Lulu1, Shen Yong2, Dou Weiqiang3, and Qi Liang1
1Radiology, Jiangsu Province Hospital, Nanjing, China, 2GE Healthcare, MR Enhanced Application China, Beijing, China, 3GE Healthcare, MR Research China, Beijing, China
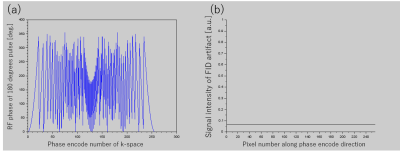
The directional effect of
the frequency-encoding gradient on T2WI-STIR was different from the performance
on the T1WI.
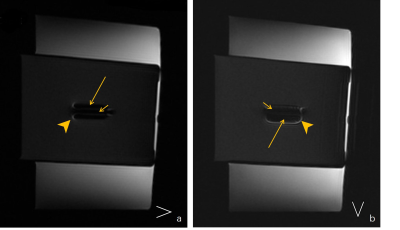
Fig.1 (a-b) Under the default window width and window level, the images show the artifacts, including the low (long arrow) and high (arrowhead) signal intensities. The screw without protons displays a low signal intensity (short arrow).
Fig.1 (a-b) Under the default window width and window level, the images show the artifacts, including the low (long arrow) and high (arrowhead) signal intensities. The screw without protons displays a low signal intensity (short arrow).
-
Image blending method to produce consistent SNR in images denoised using a convolutional neural network
Anuj Sharma1 and Andrew J Wheaton1
1Magnetic Resonance, Canon Medical Research USA, Inc., Mayfield Village, OH, United States
We
propose an image blending method that uses target SNR as a quantitative metric
to produce natural-looking, denoised images. The proposed method is shown to
produce denoised images with consistent SNR values in head, spine and knee
applications.
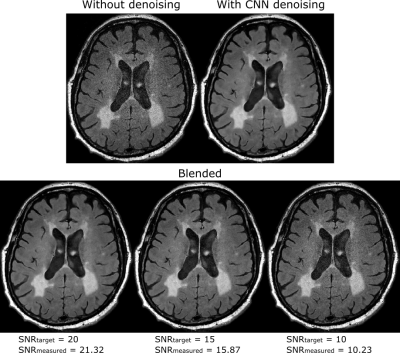
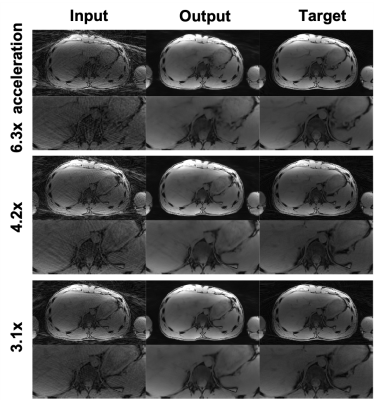
Figure
2: Results from the head axial FLAIR experiments.
The denoising CNN reduced image noise at the cost of significant smoothing. Blended
images demonstrate the use of proposed method to generate images at different
target SNR values. The target and measured SNR values closely match each other
in all the blended images.
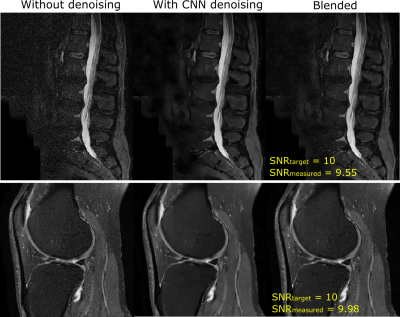
Figure
3: Results from the lumbar spine sagittal STIR
and knee sagittal IW experiments. Images processed by the denoising CNN appear
artificially smooth. Images blended using the proposed method have a natural
appearance. The target and measured SNR values closely match each other.
-
Denoising MR 2D COSY spectra using a joint sparse parametric Matching Pursuit (jSPaMP)
Boris Mailhe1, Zahra Hosseini2, Bing Ji3, Hui Mao3, and Mariappan S. Nadar1
1Digital Technology and Innovation, Siemens Healthineers, Princeton, NJ, United States, 2MR R&D Collaboration, Siemens Medical Solutions USA Inc., Atlanta, GA, United States, 3Department of Radiology and Imaging Sciences, Emory University, Atlanta, GA, United States
2D COSY
data can be denoised using a combination of parametric fitting in time and
nonparametric joint sparsity in the j-coupling direction.
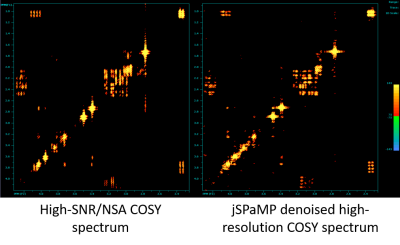
Figure 5: Comparison
of the high SNR spectrum obtained with NSA of 96 (left) and a jSPaMP
denoised spectrum with NSA of 16 (right).
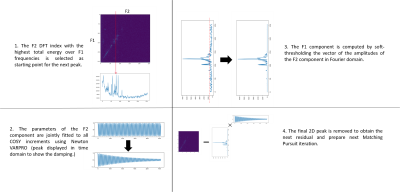
Figure 2: Description
of the proposed jSPaMP
algorithm.
-
Characterising the variance and reproducibility of low rank denoising methods for spectroscopic data
William T Clarke1 and Mark Chiew1
1Wellcome Centre for Integrative Neuroimaging, NDCN, University of Oxford, Oxford, United Kingdom
Despite visually denoising MRS data it is not clear whether low rank denoising decreases uncertainty in metabolite concentrations. We use simulation and in vivo reproducibility to show that denoising is beneficial, but much less than is apparent.
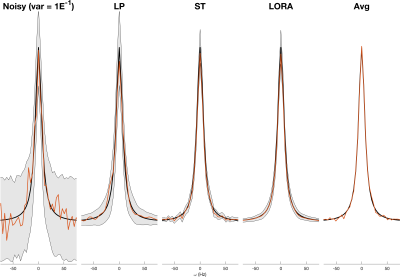
Figure 1. Denoising of a single identical Lorentzian peak with independent noise. The black line shows the noiseless signal, the red line shows a single voxel’s data after denoising (no denoising applied in “Noisy”, all spectra mean shown in “Avg”). The Shaded grey region shows ± two standard deviations of all 128 spectra. All denoising approaches show high apparent noise level reduction, but LP denoising does not show a reduction in peak amplitude variance.
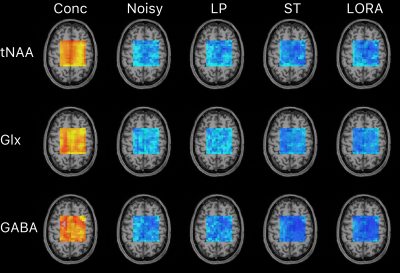
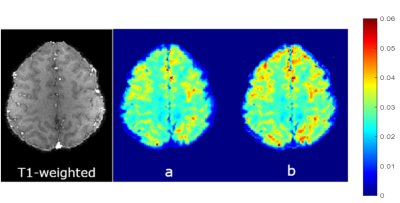
Figure 5. Voxel-wise maps of mean metabolite concentration (left, red/yellow) and standard deviation of metabolite concentration (blue) across the ten repeated acquisitions for each denoising case. Data is shown for three metabolites and is overlaid on a T1w structural image. Colour scales are fixed for each metabolite.
-
A Survey of Faraday Cage Attenuation Measurements of Clinical MRI Systems
Francesco Padormo1, Joe Martin1, Jane Ansell1, Elizabeth Gabriel1, Laurence H. Jackson1, Caitlin O'Brien1, Simon Shah1, David Price1, and Geoff Charles-Edwards1
1Guy's & St Thomas' NHS Foundation Trust, London, United Kingdom
We present faraday cage attenuation measurements on eleven MRI systems, to assess the need to replace the cage when replacing/upgrading an MRI system.
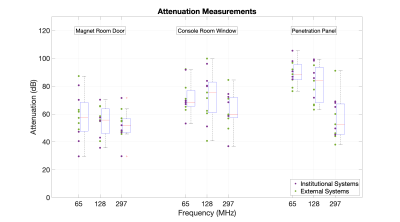
Figure 1 - Faraday cage attenuation measurements of eleven clinical MRI systems: measurements were acquired at 65MHz, 128MHz and 297MHz at the magnet room door, console room window and penetration panel. Box and whisker plots adjacent to the data show the median in red, interquartile range within the box, whilst the whiskers show the range of data excluding outliers, which are indicated with a red cross.
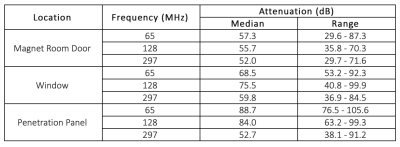
Figure 2 - Summary of RF attenuation measurements in eleven clinical MRI systems
-
Usefulness of Deep Learning Based Denoising Method for Compressed Sensing in Pituitary MRI
Takeshi Nakaura1, Hiroyuki Uetani1, Kousuke Morita1, Kentaro Haraoka2, Akira Sasao1, Masahiro Hatemura1, and Toshinori Hirai1
1Diagnostic Radiology, Kumamoto University, Kumamoto, Japan, 2Cannon Medical Systems Japan, Tochigi, Japan
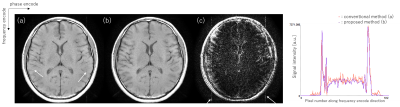
The
DLR based denoising method can improve the image quality of T2WI of pituitary
with CS as compared with the
conventional wavelet based denoising method, and
the difference became more noticeable at higher denoising levels.
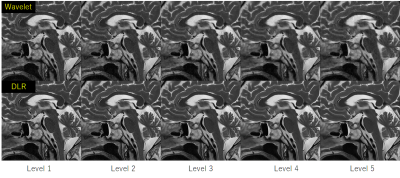
Representative case. (upper row) Conventional wavelet based denoising
method, (lower row) DLR based denoising
method. The DLR based denoising method offered decrease in image noise,
artifact, and clear depiction of pituitary grand and small objects as compared
with the conventional wavelet based denoising method.
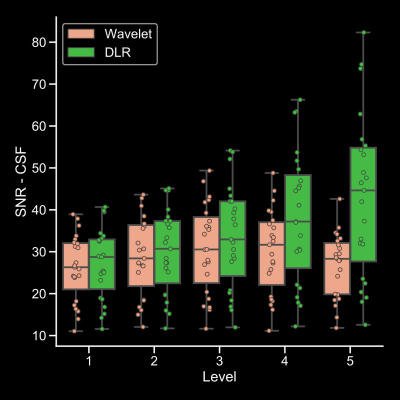
A box plot shows the SNR of CSF. There was a progressive increase in SNR of CSF with DLR
based denoising method with increase of the
denoising level in any location. On the other hand, the SNR of conventional
wavelet-based method was not increased at high denoising levels (4-5).
-
Evaluation of noise reduction performance using deep learning reconstruction: A phantom study
Hitoshi Kubo1, Yuya Abe2, Tomoya Yokokawa2, Seira Yokoyama2, and Koji Hoshi2
1Fukushima Medical University, Fukushima, Japan, 2Hoshi General Hospital, Koriyama, Japan
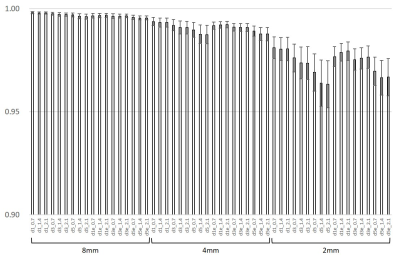
SNRs were increased higher
significantly by DLR in all SNR ranges. Increasing ratio of SNR was varied by
means of parameter settings. Combination of the DLR parameters affected varies
to SNR, SSIM, and spatial resolution of the images.
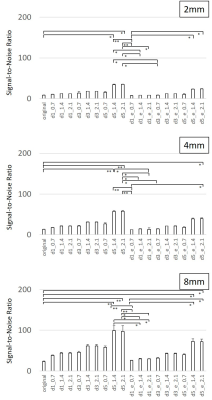
Signal-to-Noise ratios on the images of 2 mm, 4 mm, and 8 mm of slice
thickness with various parameters of Deep Learning Reconstruction (DLR) were
shown. DLR had a powerful performance to increase SNR in all SNR ranges.
Structural similarity (SSIM) of
the images were shown. Decreasing of SSIM higher in thinner slice images is
compared to that in thicker slice images. Edge enhancement recovered SSIM
higher, especially in thinner slice images.
-
Suppressing the ballistocardiography artifacts on EEG collected inside MRI using the dynamic modeling on heartbeats
Hsin-Ju Lee1,2, Hsiang-Yu Yu3,4,5, Cheng-Chia Lee4,5,6, Chien-Chen Chou3,4, Chien Chen3,4, Wen-Jui Kuo5,7, and Fa-Hsuan Lin1,2,8
1Physical Sciences Platform, Sunnybrook Research Institute, Toronto, ON, Canada, 2Department of Medical Biophysics, University of Toronto, Toronto, ON, Canada, 3Department of Epilepsy, Neurological Institute, Taipei Veterans General Hospital, Taipei, Taiwan, 4School of Medicine, National Yang-Ming University, Taipei, Taiwan, 5Brain Research Center, National Yang-Ming University, Taipei, Taiwan, 6Department of Neurosurgery, Neurological Institute, Taipei Veterans General Hospital, Taipei, Taiwan, 7Institute of Neuroscience, National Yang-Ming University, Taipei, Taiwan, 8Department of Neuroscience and Biomedical Engineering, Aalto University, Espoo, Finland
Using
both simulations and empirical data at 3T, we demonstrated that the dynamic modeling of heartbeats (DMH) method can suppress the BCG artifacts on the EEG collected inside MRI more efficiently than Optimal Basis Set method in both epilepsy and steady-state
visual evoked potential data.
-
Robust spatial and temporal unwrapping for accurate quantitative susceptibility mapping
Alex Ensworth1, Véronique Fortier1,2, Jorge Campos Pazmino1, and Ives R Levesque1,2,3,4
1Medical Physics Unit, McGill University, Montreal, QC, Canada, 2Biomedical Engineering, McGill University, Montreal, QC, Canada, 3Research Institute of the McGill University Health Centre, Montreal, QC, Canada, 4Gerald Bronfman Department of Oncology, McGill University, Montreal, QC, Canada
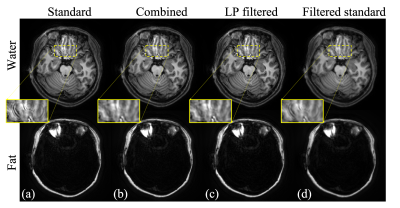
Quality-guided region-growing phase unwrapping with temporal median phase restoration is more accurate than Laplacian-based methods for quantitative susceptibility mapping.
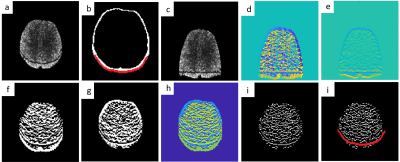
Five echoes after QGRG spatial unwrapping are shown across the columns. From left to right, the first echo is at 5.0 ms, followed by 10.4 ms, 15.8 ms, 21.2 ms and then 26.6 ms. The top row is without temporal unwrapping (TU), the middle row is with temporal unwrapping and the bottom row is a plot of the line profiles for each column. Dataset C2 was used.
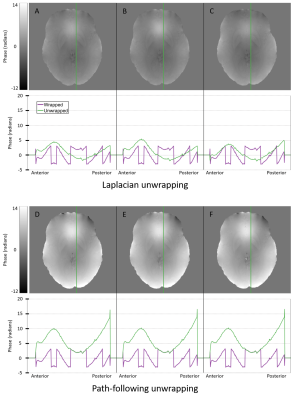
Six different techniques (three Laplacian, top row, and three path-following, bottom row) were used to spatially unwrap phase data from dataset C2. The output from each unwrapping technique is shown with an axial cross-section of the brain, and a line profile beneath it. Panel A represents the Laplacian from the STI suite, B is the Laplacian from the MEDI toolbox, C is the Laplacian from a collaborator, D represents QGRG, E represents SEGUE and F represents region growing from the MEDI toolbox.
-
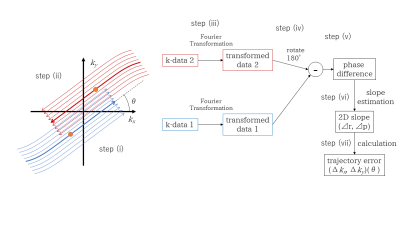
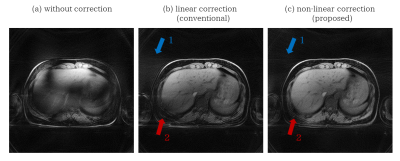
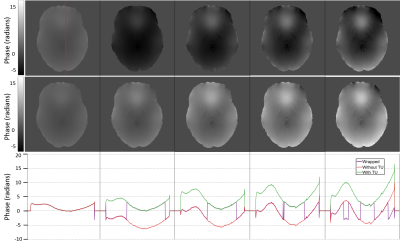
Off-resonance correction of non-cartesian SWI using internal field map estimation
Guillaume Daval-Frérot1,2,3, Aurélien Massire1, Mathilde Ripart2, Boris Mailhe4, Mariappan Nadar4, Alexandre Vignaud2, and Philippe Ciuciu2,3
1Siemens Healthcare SAS, Saint-Denis, France, 2CEA, NeuroSpin, CNRS, Université Paris-Saclay, Gif-sur-Yvette, France, 3Inria, Parietal, Palaiseau, France, 4Digital Technology and Innovation, Siemens Healthineers, Princeton, NJ, United States
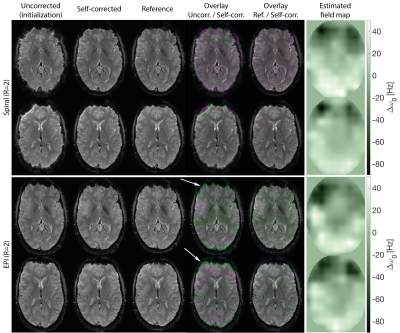
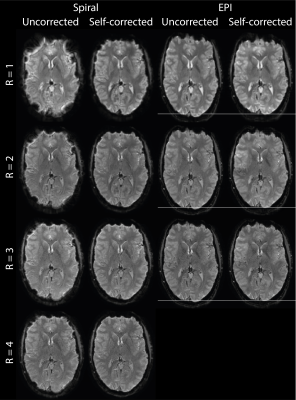
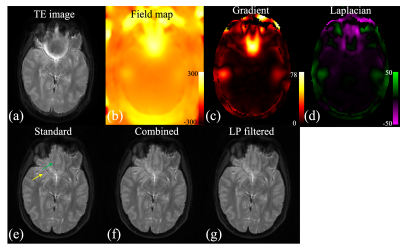
We propose to approximate the $$$\Delta{B_0}$$$ field map of a single echo acquisition using long echo time. The estimated 3D field maps, produced at 0.6 mm isotropic under 3 minutes, are then used for $$$\Delta{B_0}$$$ correction with performances similar to acquired ones.
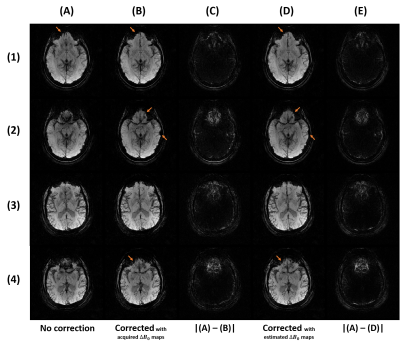
Figure 4 : Comparison of the SWI with mIP without correction (A), with correction using the acquired field map (B) and with correction using the estimated field map (D) with the same slices as Fig3. (C) and (E) are respectively the difference between (A) and (B), and between (A) and (D).
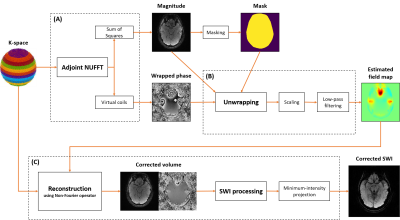
Figure 1 : Pipeline of the field map estimation followed by an off-resonance correction. The magnitude and associated mask estimated with the adjoint are used to weight and stabilize the phase unwrapping algorithm.
-
Characterizing the acquisition protocol dependencies of
B0 field mapping and the effects of eddy currents and spoiling
Divya Varadarajan1,2, Mukund Balasubramanian2,3, Daniel J. Park1, Thomas Witzel4, Jason P. Stockmann1,2, and Jonathan R. Polimeni1,2,5
1Martinos Center for Biomedical Imaging, Charlestown, MA, United States, 2Department of Radiology, Harvard Medical School, Boston, MA, United States, 3Boston Children’s Hospital, Boston, MA, United States, 4Qbio Inc., San Carlos, CA, United States, 5Division of Health Sciences and Technology, Massachusetts Institute of Technology, Cambridge, MA, United States
Here we investigate the accuracy of the standard B0 field
map acquisition, demonstrate that the estimated fields vary with several
acquisition parameters, and investigate sources of these errors.
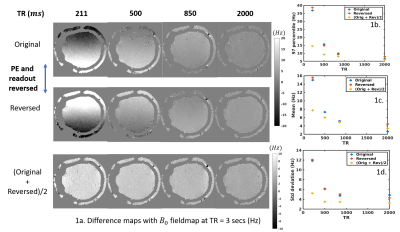
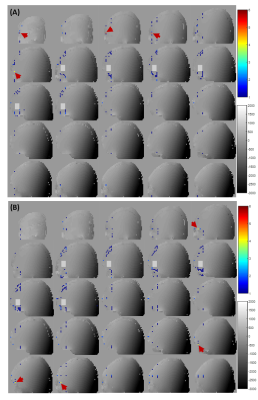
Figure 1. The figure shows the variation of fieldmaps with
TR and plots the associated statistics of the bias.
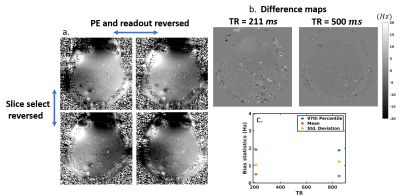
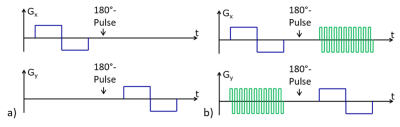
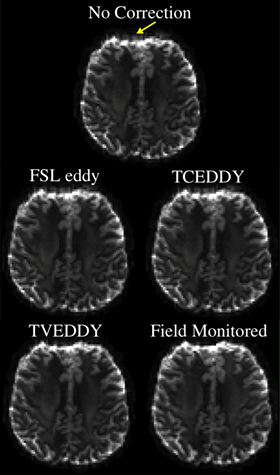
Figure 5. Slice
select gradient reversal along with PE and FE gradient reversal (a) cancels
most of the bias in the fieldmap (b) and reduces to a mean of 0.5 Hz and a 97th
percentile of ~2 Hz (c).
-
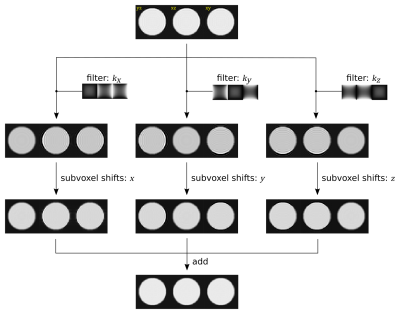
Application of Voxel Spread Function Method for Correction of Magnetic Field Inhomogeneity at 7T
seyedeh nasim adnani1, Thomas Denney Jr.1, Alexander Sukstansky2, Dmitriy Yablonskiy2, and adil bashir1
1electrical and computer engineering, auburn university, auburn, AL, United States, 2radiology, Washington university school of medicine in St. Louis, St. Louis, MO, United States
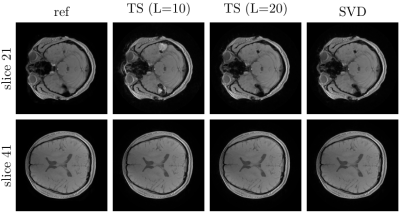
Ultra high-field imaging scenarios suffer from
increased field inhomogeneities compared with 3T scanners or below. Voxel
Spread Function addresses this issue and is feasible for ultra high-field MRI
imaging and compensates for the decreased T2* that is the outcome of the
inhomogeneities.
Representative T1 weighted image and T2* maps from
the in vivo experiment, a) before correction and b) after macroscopic field
inhomogeneity correction. Average increase in the T2* values in both GM and WM
is evident. GM/WM T2* contrast is also increased.
Proton density (a) and examples of T2* maps
calculated without (b) and with F-term correction (c). Regions substantially affected by the B0
field inhomogeneity are indicated by red arrows. F-function correction
significantly reduces magnetic field inhomogeneity artifacts on T2* maps and
sharpens T2* contrast in gray and white matter.
-
Correction of transmit-field induced signal inhomogeneity in 3D MP-FLAIR at 7T
Jan Ole Pedersen1, Vincent O. Boer2, Oula Puonti2, Jaco M. Zwanenburg3, and Esben Thade Petersen2,4
1Philips Healthcare, Copenhagen, Denmark, 2Danish Research Centre for Magnetic Resonance, Centre for Functional and Diagnostic Imaging and Research, Copenhagen University Hospital, Hvidovre, Denmark, 3Department of Radiology, University Medical Center Utrecht, Utrcecht, Netherlands, 4Section for Magnetic Resonance, DTU Health Tech, Technical University of Denmark, Kgs Lyngby, Denmark
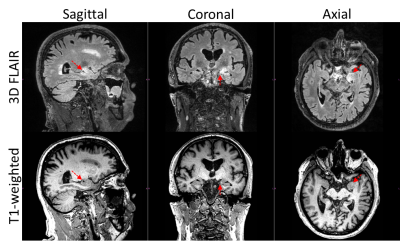
A bias-field correction based on simulations and
measurements of B1+ was developed to ease radiological assessment of MP-FLAIR
at 7T. In addition to showcasing the
algorithm, the abstract exemplifies the high dependency of MP-FLAIR towards B1+
through simulations and volunteer brain images.
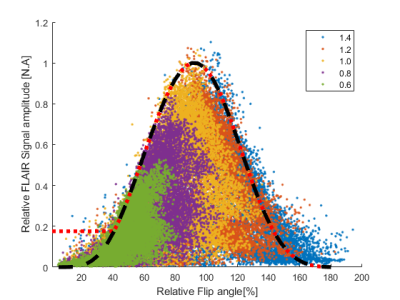
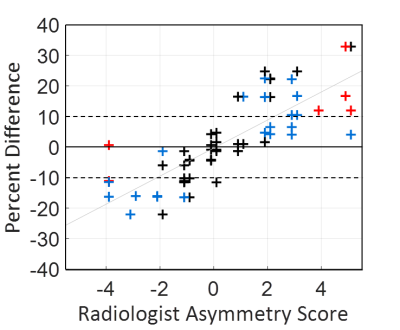
Figure 4:
Simulated versus
measured dependency of MP-FLAIR image intensity to B1+. Dots: Measured MP-FLAIR intensities as a function of measured
DREAM B1+. Colors depict different RF gains. Other sources of signal loss
(e.g. B1-/B0, fluid-content) cause
the measured intensities to “fill out” the area under the curve.
Black line: Simulated FLAIR intensities. Increasing discrepancy
between simulation and measurements is seen below 60% and above 140% of B1+, which is ascribed to inherent bias in the measured B1+.
Red line: The MP-FLAIR
dependency to B1+ used for bias-field correction.
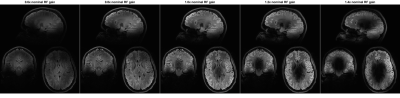
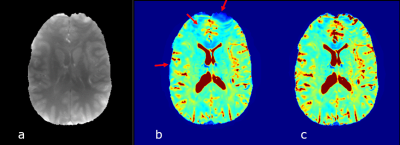
Figure 3:
5 repetitions of an MP-FLAIR scan with different
RF gains (0.6 – 1.4). For low RF gains, only the mid brain (where B1+ is
relatively large) experience close to nominal flip-angles. For RF gains higher
than 0.8, the mid brain shows as hypo-intense due to flip-angles being larger
than the nominal flip-angle. The lower occipital lobe (where B1+ is relatively
small), show as hypo-intense for all but the highest RF gain, where it
experiences close to nominal flip angles and shows as hyper-intense, due to the
surrounding tissue experiencing higher than nominal flip-angles.
-
Integrated Spin-Echo EPI scans for Fast Simultaneous B1 and B0 mapping in the Human Brain
Sofia Chavez1,2
1Centre for Addiction and Mental Health (CAMH), Toronto, ON, Canada, 2Psychiatry, University of Toronto, Toronto, ON, Canada
By
combining the requirements for B1 mapping using the DAM and reversed phase encode
blips for B0 mapping like that used by topup,
we were able to map B1 and B0 from integrated scans.
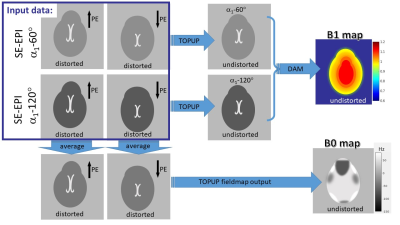
Fig.1 Cartoon depicting the proposed acquisitions and processing pipeline. The images contained in the purple square (top left) represent the four SE-EPI scans that need to be acquired (each in 15 s).
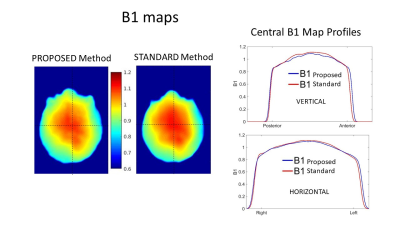
Fig.4 Sample of the B1 map produced using the proposed method compared to the B1 map produced using a typical SE-DAM protocol in our Centre (as per ref.2). The horizontal and vertical profiles are plotted on the right to show the very good agreement between these two B1 maps.
-
Optimisation of MRI Bias Field Correction Algorithms on Whole Brain and Atrophy Measurements
Kain Kyle1,2 and Chenyu Wang1,2
1Sydney Neuroimaging Analysis Centre, Sydney, Australia, 2University of Sydney, Sydney, Australia
In this investigation we compared bias correction techniques by estimating brain volume change in healthy controls. We found are proposed iterative WM N4 bias correction technique resulted in the lowest percentage brain volume change.
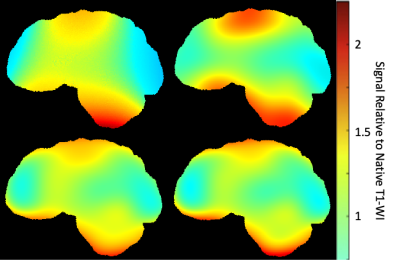
Figure 1. Example of bias correction applied to native T1-WI. Maps were generated by dividing the corrected image by the native image. Bias correction methods N3 (top left), N4 (top right), N4W(bottom left) and N4ITER(bottom right).
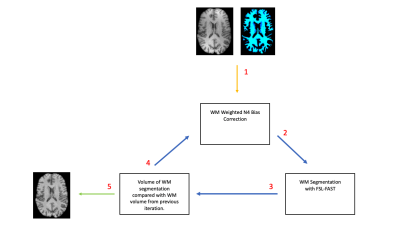
Figure 2. Summary of iterative WM N4 bias correction technique. 1) Initial WM mask is generated with FSL-FAST on native T1-WI and used for N4Wcorrection. 2) WM mask is segmented from N4 corrected image with FSL-FAST. 3) Volume of WM mask from step 2, is compared to the volume of the WM mask from the previous iteration, or initial input WM mask if it is the first iteration. 4) If the change in volume is greater than 0.05%, the updated mask is used to perform N4Won the native T1-WI. 5) If the change in volume is less than 0.05 percent, the process is terminated.