 BY RYAN TOPFER & NIKOLA STIKOV
In this Highlights Q&A we chat with Dongmei Wu about her technique to reverse phase history through gradient moment nulling, and senior author E. Mark Haacke takes a moment to tell us the history behind “The Green Book”.
MRMH: To start off, could you give us an idea of what this project was about?
Dongmei: The idea was to do full three-dimensional flow compensation for all the echoes so we could do MR angiography, SWI [susceptibility weighted imaging], QSM [quantitative susceptibility mapping], and T2* mapping all in one scan. Extracting all of this from a single sequence saves time, which is really important for clinical applications.
MRMH: In the paper, vessel wall imaging is mentioned as a clinical application. Normally this is done with a T1-weighted scan or black blood imaging. What’s the advantage of using SWI and QSM?
Mark: The point in studying vessel wall is to look for vulnerable plaque, and also to look at plaque formation. What Dongmei has demonstrated is that, by using this double echo approach, with the shorter echo, we can see the vessel wall and therefore do a QSM map of these abnormalities. SWI and QSM can differentiate the type of plaque: diamagnetic (calcified) material or paramagnetic blood products. If it turns out to be the latter (i.e. hemorrhagic plaque), especially if it’s beginning to infiltrate the edge of the vessel wall, then that’s the first indication it could be vulnerable plaque. Black blood imaging can’t do that because if the signal from the tissue is dark then you can’t see it. If you use a short echo time and you don’t lose that signal, then you may see a T1 enhancement; however, this enhancement may disappear over time. So the beauty of the approach here using SWI-QSM is that you can differentiate this tissue purely from its susceptibility factor. It’s a new idea but I believe it’s complementary to what people have done over the last twenty-five years to study atherosclerosis.
MRMH: So you want the scan to be sensitive to tissue iron content, and susceptibility contrast evolves with echo time, manifesting itself as increased phase contrast. Why bother with the short echo?
Mark: Theoretically, the QSM reconstructions should be echo-time independent, so you should get the same answer whether you use short or long echo. If you find something that’s in the second echo but not in the first (assuming it’s not a question of SNR) then clearly what’s in the second echo is wrong. Though, as you know, life is not always quite that simple…
Dongmei: Even with flow compensation, the residual background field inhomogeneity (from imperfect shimming), when combined with flow, can induce artifactual arterial phase that will produce streaking artifacts in the susceptibility map. So we use information from the first echo to suppress the artery in the second echo. Figure 6 in the paper shows that, without masking out the phase of the arteries before the QSM reconstruction, the arteries appear to have high susceptibility. But, in reality, the arteries have roughly the same susceptibility as the surrounding tissue and should not be visible in the phase images.
Mark: Clinicians, like our longtime collaborator Dr. Karen Tong at Loma Linda University, have been asking for ten years, “Please help us differentiate thrombus from veins!” At the long echoes you see so many veins that this is difficult to do. This need by the clinicians was part of the motivation for Dongmei’s project and now we’ve basically solved the problem. It could be an entirely new dimension for the clinicians to begin using; with the short echo you can visualize high iron content, which enables you to see the thrombus very well, and distinctly from the veins.

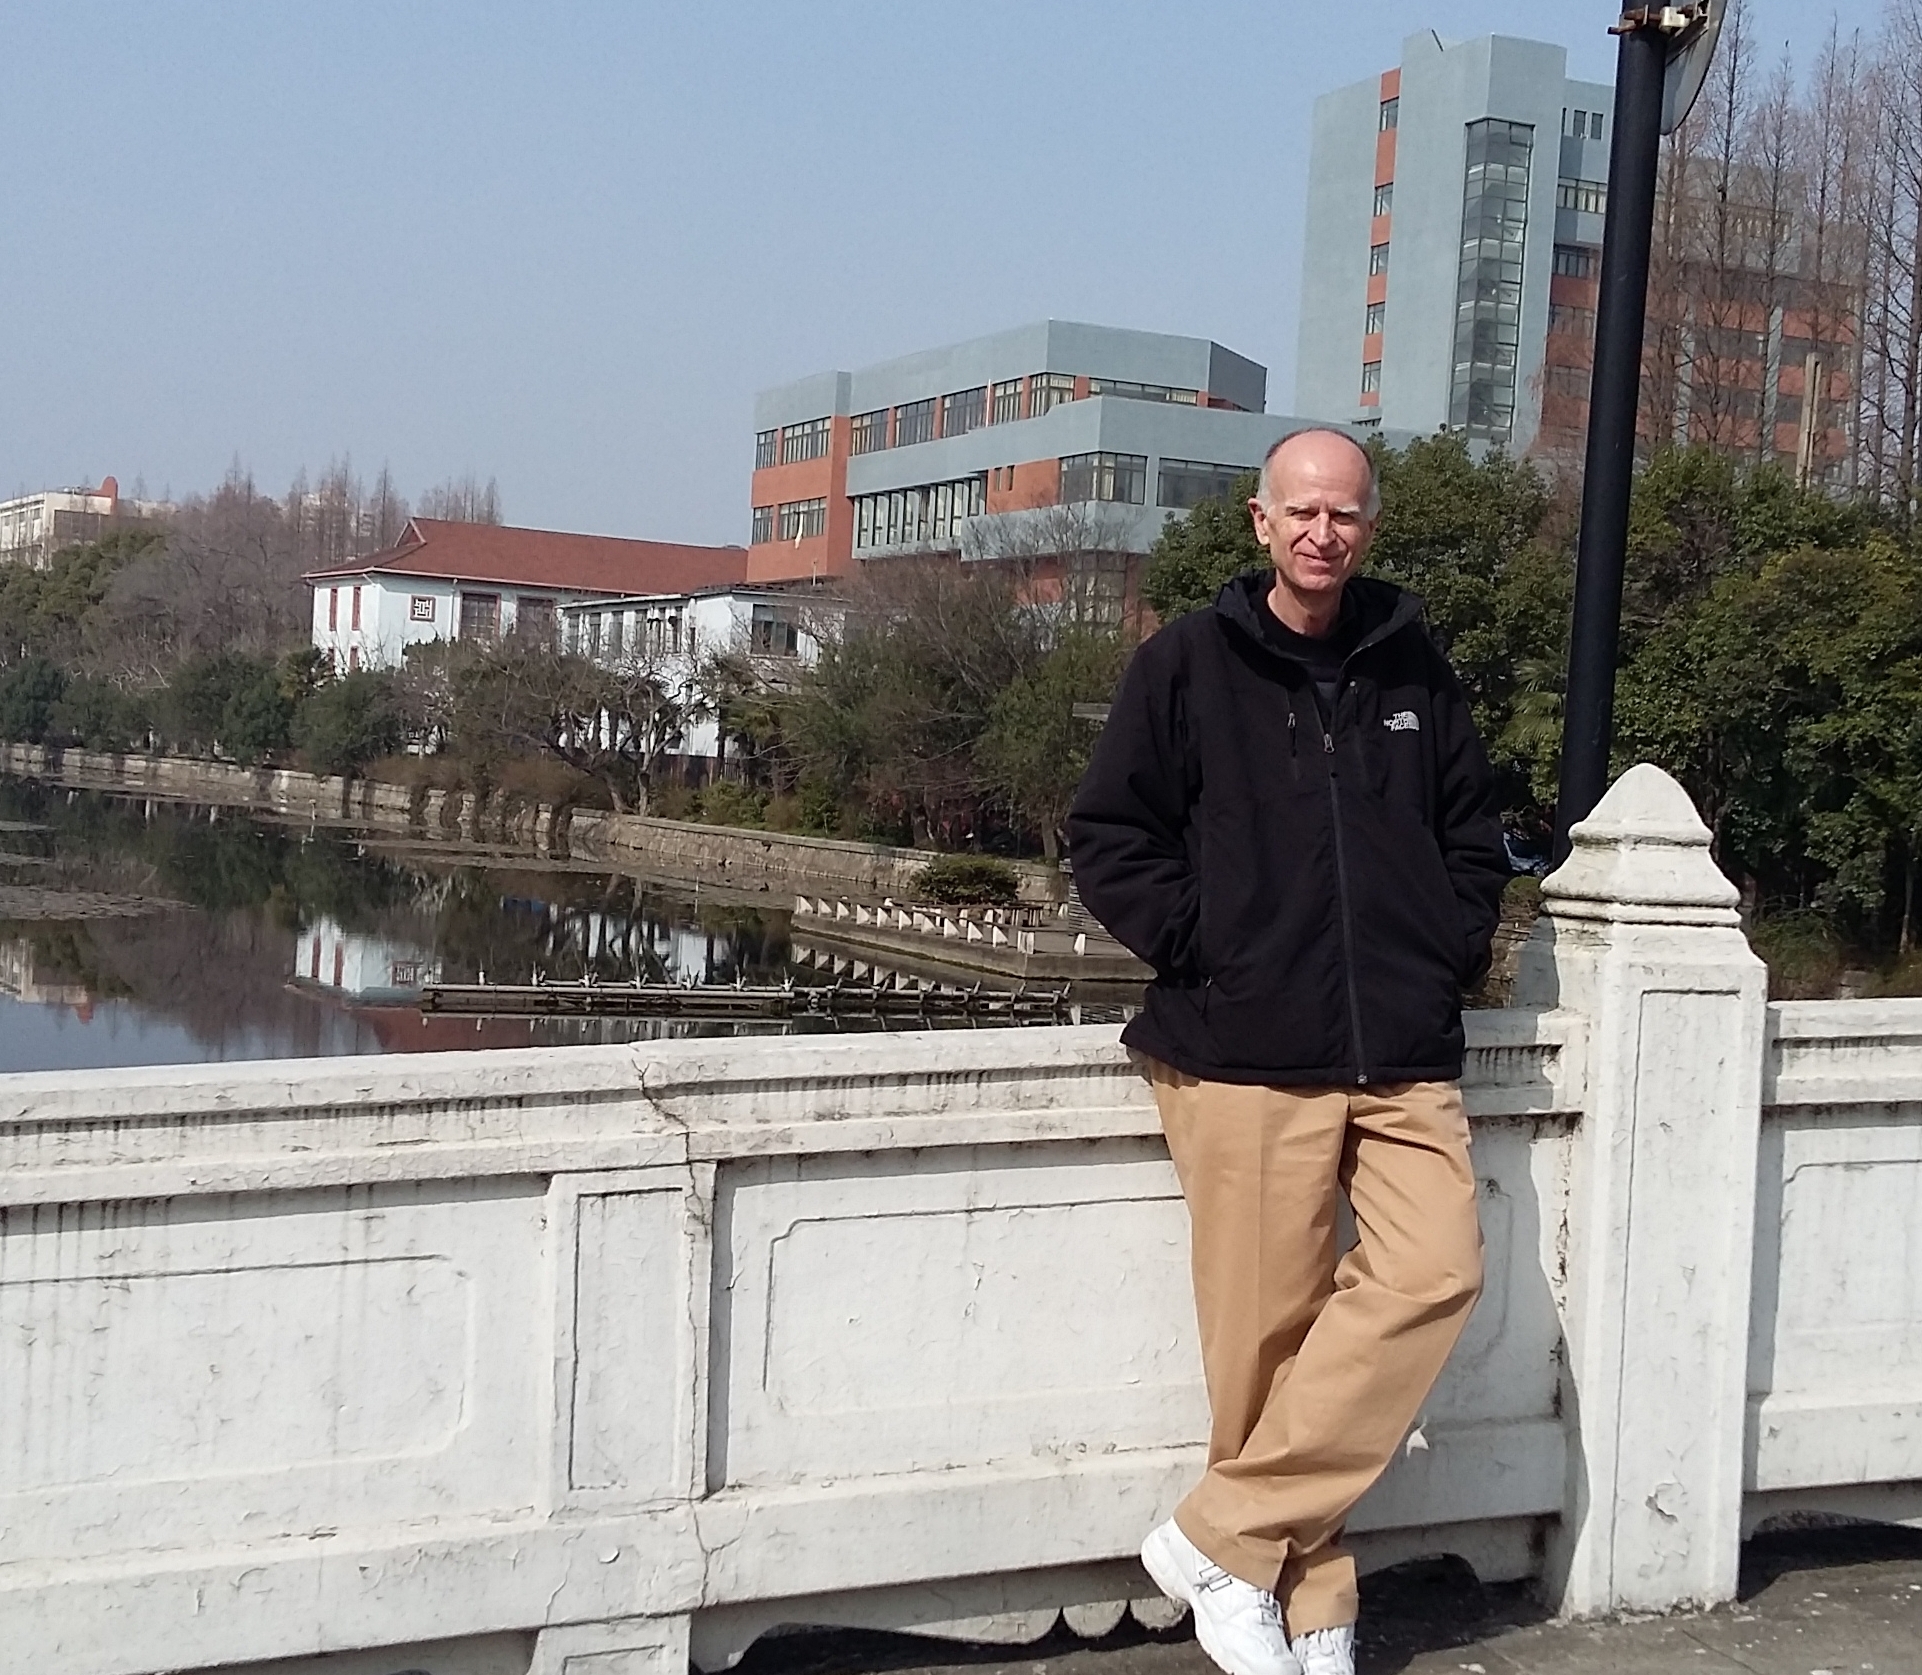
Mark Haacke on a visit to East China Normal University in Shanghai, China.
It was to our delight and surprise that we found these short echo times (7.5 ms) do a very good job of reconstructing QSM in regions of high iron content. They have less artifacts than the long echoes because there’s less aliasing to deal with and there’s less cancellation effects at the edges of regions of high iron content. The long echoes remain useful for their grey-white matter contrast, and for finding asymmetrically prominent cortical veins and microbleeds (the latter of which is very important for studying dementia, stroke and traumatic brain injury).
MRMH: Any other surprises during the course of this research? Where is it leading to next?
Dongmei: During the design of the flow compensation, the trick was really to have the flow compensation for each echo strictly independent. To do this, we designed the gradient structure to reverse all the earlier gradient moments before applying flow compensation to the later echoes. So the flow compensation for each echo then had a similar form, making it easy to extend to any number of echoes (e.g., in this paper, we used five echoes to do the T2* map).
We’re now beginning a project to speed up the SWI scan by using segmented EPI (SEPI). With SEPI SWI, we can use an echo train length of 3 to 7. Conventional SWI takes about 12 minutes, whereas with SEPI and parallel imaging, whole brain coverage can now be accomplished in 1 to 3 minutes depending on the desired resolution.
Mark: There’s something magical about SEPI SWI. In almost all imaging methods where you speed up data acquisition you will lose SNR. That isn’t true for SEPI SWI for reasonable length TR and TE, since you’re sampling with the echoes, and there’s not very much T2 decay. This would be tremendous because current imaging times for resolutions ranging from 0.65 x 0.65 x 1.3 mm3 to 0.65 x 1.3 x 2 mm3 can now be run in 1 to 3 minutes as Dongmei alluded to with almost no loss of SNR! It will be up to the clinicians to decide which resolutions and SNR they prefer for a given application.
MRMH: Is there a specific clinical application you’re hoping to apply this faster sequence to?
Mark: We wrote a paper a few years ago studying seventy-five patients with mild cognitive impairment. We showed that patients with four or more microbleeds all converted to progressive dementia during that study. So that becomes a potential biomarker for the presence of cerebral amyloid angiopathy. Realizing this problem – the longer echo time you get, the harder it becomes to flow compensate – the method Dongmei is developing now, ironically, is looking at the opposite effect that we tried to correct for in this paper. She’s looking at purposely dephasing all the signal, so there are no remnant artifacts, and getting the black blood type of image that allows for very high resolution, rapid SEPI SWI that could then also be used to detect microbleeds. In that case, the implications are tremendous for dementia, and traumatic brain injury. And very recently a group in Shanghai has shown that if you have 3 or more microbleeds in stroke, you maybe shouldn’t do anti-platelet therapy. So the ability to monitor the presence of microbleeds using this technique may become a very important clinical tool.
MRMH: Dongmei, how did you get into MRI? And how did you come to work with Mark?
Dongmei: I began my MR research career in 2006 when I finished my master’s studies and went to Siemens in Shenzhen to work on sequence development and ICE programming. After three years there I returned to Shanghai to work in the physics department at East China Normal University (ECNU), where they have a Siemens Trio. I began working with Dr. Haacke in 2008 when he started collaborating with our department. I officially became his PhD student in 2014, which is when we initiated our research on flow compensation.

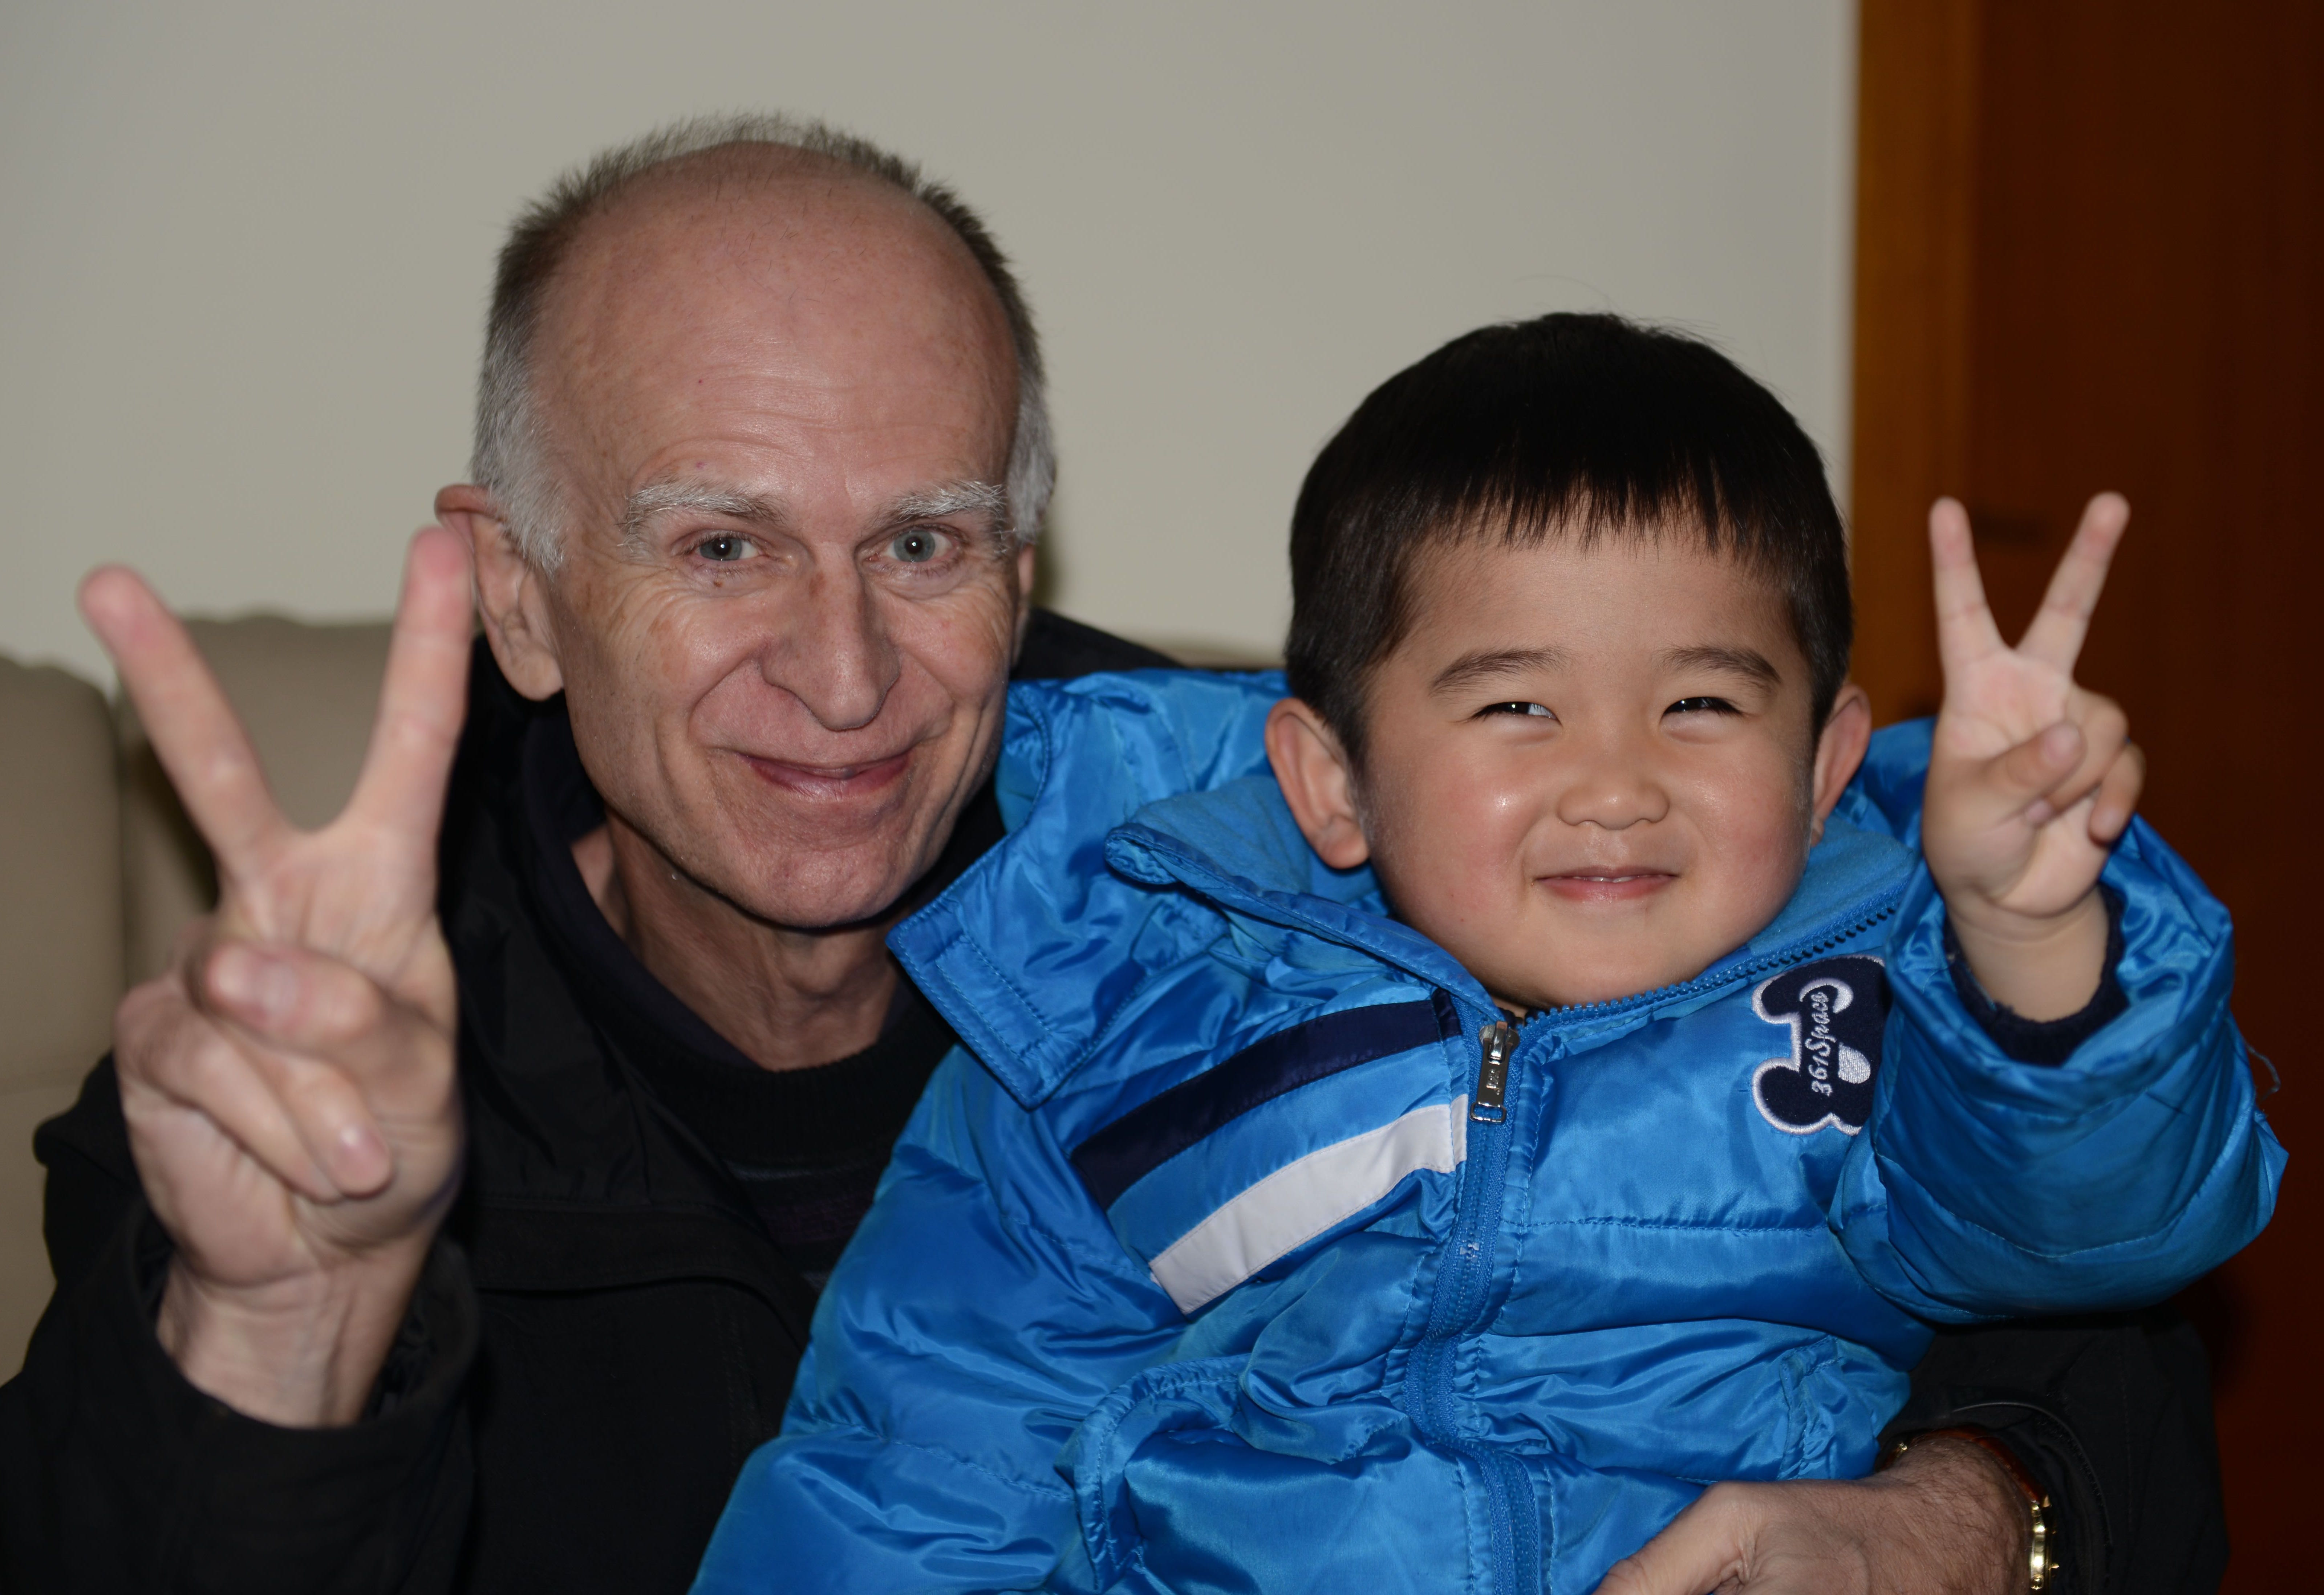
Mark, also known as “yeye”, & Dongmei’s son discussing future sections for the Green Book.
Mark: We also knew each other because Dongmei’s husband Dai Yongming works in MR. So we actually began collaborating, working on SWI sequence related issues, before she became a student. In 2014, I took on an adjunct position there as a professor in the physics group and I was then able to formally have her as a PhD student, in collaboration with Chen Qun, who’s a member of that department and now also the president of the university! It was nice to see an MR person become president of the university – hopefully boding well for the future of MR research at ECNU!
MRMH: Mark, how did you get started in MRI? And how did “The Green Book” come about?
Mark: I was at Case Western Reserve University, in Cleveland, doing high energy physics and I left to take a job in Pittsburgh, doing seismic tomography. That was my introduction to imaging. At that point, my wife had started medical school back in Cleveland so I was looking to return. I interviewed with Picker International and ended up starting there, right at the very beginning, just as they were switching from resistive to cryogenic units. I worked there for two years but maintained contact at Case Western with Robert Brown. We decided we would put together a course on imaging, which first involved CT, ultrasound, and MRI all together; however, as the interest in MRI grew and grew, the other topics dropped away. I had taught the course for almost fifteen years before “The Green Book” was first published in 1999.
It was around 1992 that I decided to begin putting a book together, because I was teaching the course every year and that gave us an opportunity to really look at the fundamentals, and also appreciate the students’ problem: The thing they liked least about most books was the statement “It is easy to prove that.” So we really thought it was best to have a clear enunciation of the problem and a step-by-step review, with as much insight as possible into where it would go in research applications. Since we were so embedded in the research at that point it became a really wonderful seven-year project for four people (so that first edition was really a twenty-eight man-year project).
The timing was perfect because John Wiley was interested in getting involved in JMRI, and I had known the people there very well. We actually had a totally complete text, done with LaTeX, so the publishers didn’t have to do anything! It was a print-ready copy and, up to this point, we’ve continued to do that: We had a hundred percent control of the format, structure, size of the book, type of images, and this really allowed us to do everything we wanted to do. Maybe in the future they won’t do this anymore!
I’ll add one more comment, because Dongmei is here. Sometimes, there were some PhD students whose work became an integral part of a given chapter. It might’ve just been an image representing some new concept, for example. In some cases those images might represent a year’s worth of effort – or even four years’! Two of the authors of that book, Ramesh Venkatesan and Mike Thompson, were both PhD students at the time, and they both took an extra year of their PhDs to help put this book together. That’s part of the magic of this book: the next version might contain a new paragraph in the discussion of flow compensation based on Dongmei’s results! So the book continues to evolve thanks, in part, to the wonderful work students do during their research.
