-
A quality-control database for the resting-state young-adult human connectome project
Daniele Mascali1,2, Antonio Maria Chiarelli1, Richard Geoffrey Wise1, and Federico Giove2
1Institute for Advanced Biomedical Technologies, Department of Neuroscience, Imaging and Clinical Sciences, "G. D'Annunzio University" of Chieti-Pescara, Chieti, Italy, 2Centro Fermi - Museo storico della fisica e Centro studi e ricerche Enrico Fermi, Rome, Italy
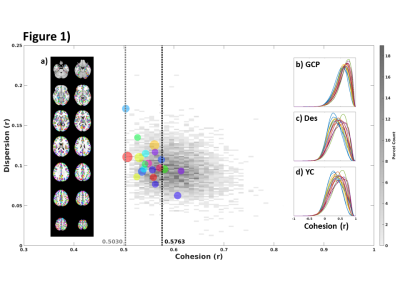
We provided a quality-control database for the
resting-state data of the young-adult human connectome project. We showed how
to exploit the database to select subjects/scans with opposite noise
characteristics, suitable for benchmarking denoising pipelines.
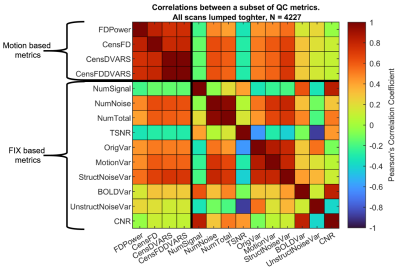
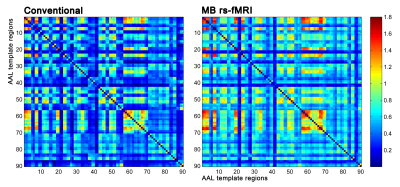
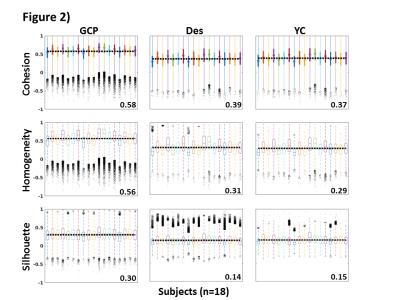
Figure 2. Pearson’s
correlations between a subset of the extracted QC metrics. The correlation
matrix was obtained considering the whole HCP dataset.
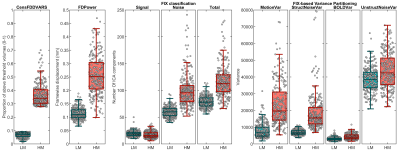
Figure 3. The box plots show the
distributions of some representative QC metrics for the two
samples of LM and HM subjects (n=250 in each sample). The criteria for sample
definition was based on the extreme values of the CensFDDVARS distribution (first
plot) and was limited to scans with RL phase encoding.
-
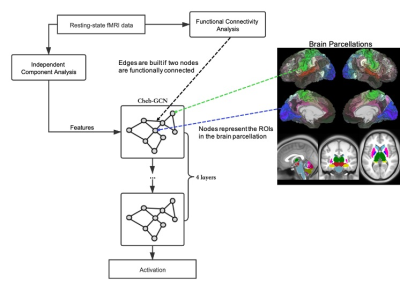
EEG Quantum Microstates correlate with resting state fMRI networks
Sneha Vaishali Senthil1, Vijayakumar Chinnadurai1, Ardaman Kaur1, Pawan Kumar1, Prabhjot Kaur1, and Maria D Souza1
1NMR Division, Institute for Nuclear Medicine and Allied Sciences, Delhi, India
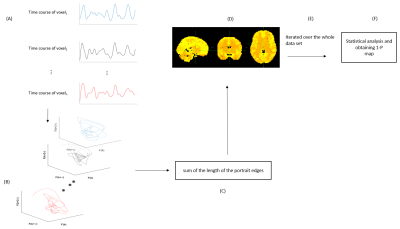
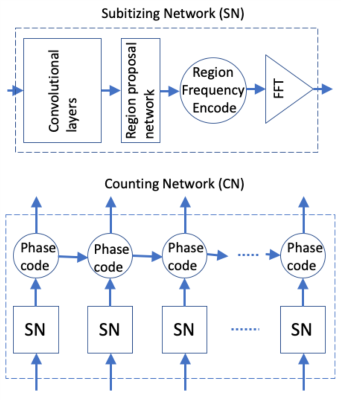
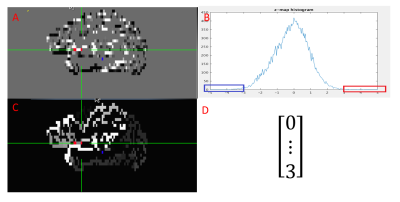
A novel quantum EEG microstate-based clustering approach to segregate resting state fMRI networks is proposed and validated.
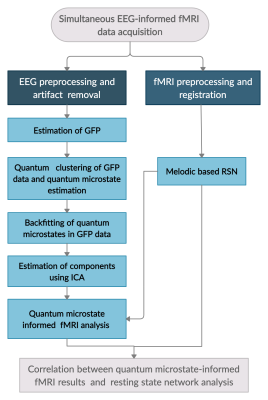
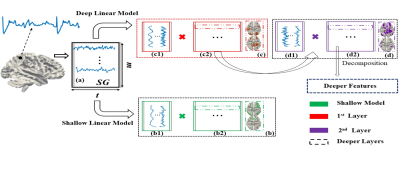
Figure 1: Schematic flowchart of the methodology employed in this study.
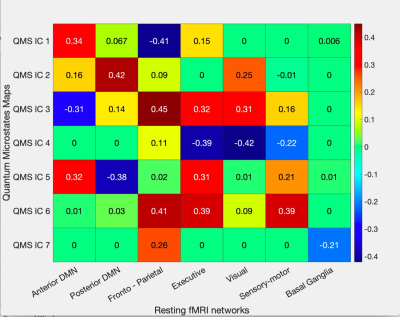
Figure 3: Correlation heatmap between ICA components of both quantum microstates and resting-state fMRI networks. The correlation values are plotted in colour and mentioned numerically inside the box. Insignificant correlations are shown as zero inside the box.
-
The effects of one rTMS session on the left DLPFC on episodic future thinking: preliminary results.
Peter Van Schuerbeek1, Linde De Wandel2, Sam Bonduelle3, Djamila Bennabi4, and Chris Baeken3
1Radiology, UZ Brussel (VUB), Brussels, Belgium, 2Head and Skin, UGent, Ghent, Belgium, 3Psychiatry, UZ Brussel (VUB), Brussels, Belgium, 4Laboratoire de Neurosciences Intégratives et Cliniques, Université de Bourgogne Franche-Comté, Bourgogne, France
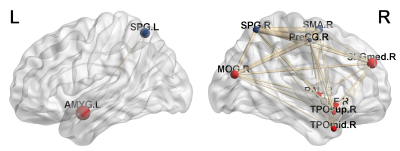
Our results revealed changes in the connectivity between the MPFC and right LP with both amygdalae during episodic future thinking (EFT) after 1 real or sham rTMS session.
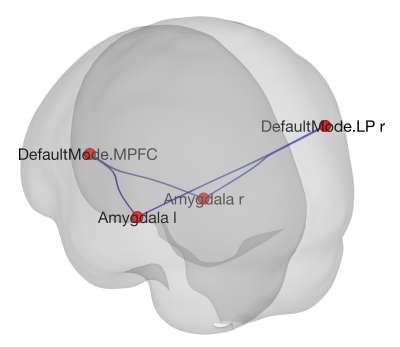
Figure 1. The network formed by the MPFC and the right LP from the DMN and the left and right amygdala showing a significant interaction (Real-Sham stimulation) x (Before-After stimulation).
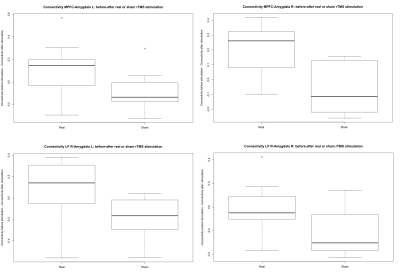
Figure 2. Boxplots presenting the difference (Before-After stimulation) in the connectivity between the MPFC (top) and right LP (bottom) with both amygdala for the real and sham stimulation.
-
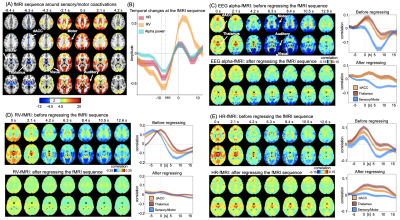
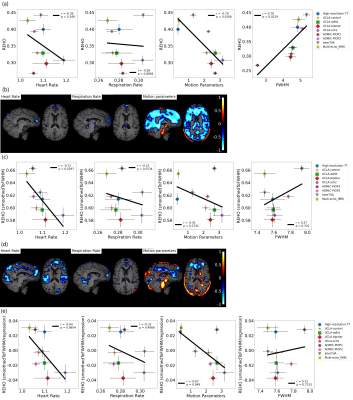
Tracing effects of breath-training on healthy brains using RS-fMRI
hacer dasgin1, naciye vardar yagli2, melda saglam2, and kader karli oguz3
1National Magnetic Resonance Research Center (UMRAM), Bilkent University, Ankara, Turkey, 2The Faculty of Physical Therapy and Rehabilitation, Hacettepe University, Ankara, Turkey, 3Faculty of Medicine, Department of Radiology, Hacettepe University, Ankara, Turkey
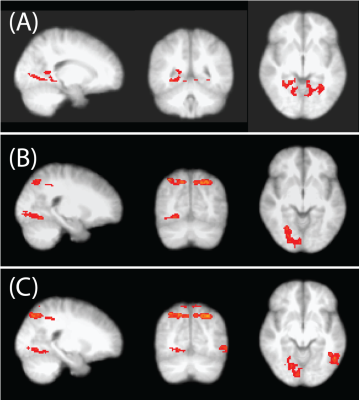
After breath training,
the treatment IMT shows less activation clusters with less activation strength
compared to the sham IMT. Our results agree with previous meditation studies including breathing training, showing
that DMN is deactivated and network gets more organised and localised
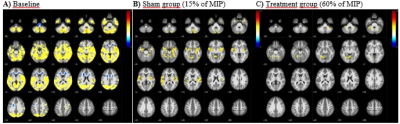
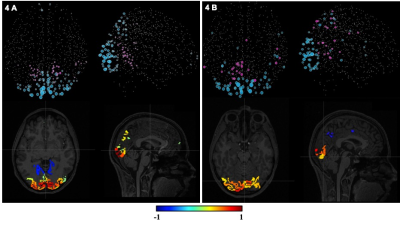
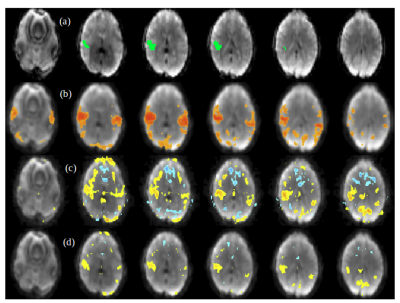
Fig.1. RS-fMRI global correlations of fourteen subjects obtained at baseline
(A) and at 8 weeks after the training at 15% of MIP (B) and profoundly decreased
connectivity patterns at 60% of MIP
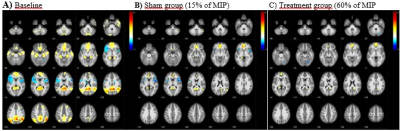
Fig. 2. Compared with Default-mode-network
(DMN) activity at baseline (A), at 8 weeks after breath-training at 15% of MIP
(B) reduced activation (yellow-to-red) at ACC, PCC and left intraparietal
sulcus (IPS) along with diminutive activation at right IPS.
Deactivation (blue) is seen in the bilateral insula and periventricular area
(B). Note that reduction in BOLD activation at ACC network and at posterior
cingulate-retrosplenial cortex, disappeared at the temporal lobes at 60% of MIP
(C)
-
Functional connectivity markers of cross-modal inhibition: Effects of auditory and visual stimulation on homo- and hetero-modal brain networks
Anissa L. Ramadhani1,2, Ali-Reza Mohammadi-Nejad1,2,3, Katrin Krumbholz2,4, and Dorothee Auer1,2,3
1Radiological Sciences, DCN, School of Medicine, University of Nottingham, Nottingham, United Kingdom, 2SPMIC, School of Medicine, University of Nottingham, Nottingham, United Kingdom, 3National Institute for Health Research (NIHR), Nottingham BRC, Queens Medical Ctr, Nottingham, United Kingdom, 4Hearing Sciences, DCN, School of Medicine, University of Nottingham, Nottingham, United Kingdom
We investigate if brain coherence reduction is a modality-specific effect, by comparing BOLD signal during rest and a continuous auditory or visual task. Our results suggest that task-induced reduction in brain coherence occurs only in default-mode and hetero-modal brain regions.
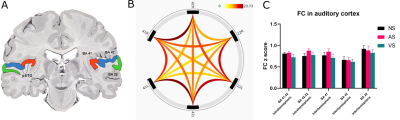
Figure 2. A) Coronal section of the human brain showing
the representative Broadmann areas studied. B) Pairwise connectivity
in ROI-to-ROI FC during rest. Strongest FC is shown in dark red. C) Mean z score (±SEM) showing FC in five
strongest connections from panel (B), between BA 41 and 42, between BA 42 and
22, and between left and right hemisphere of BA 41, 42 and 22, during rest and
each task condition. BA: Brodmann area. BA 41/42/22: primary/secondary/tertiary
auditory cortex. NS/AS/VS: no task/acoustic task/visual task.
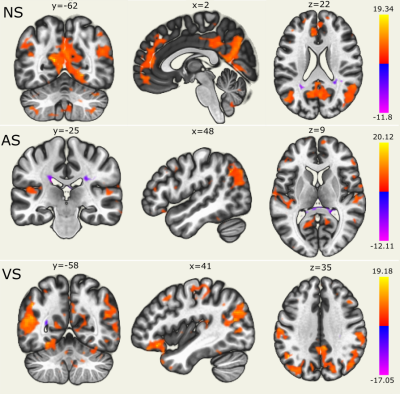
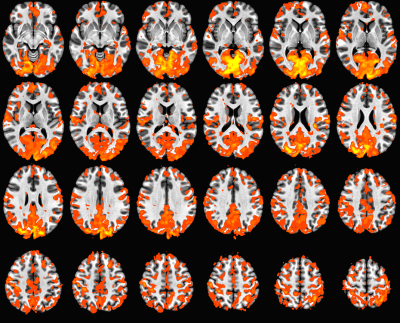
Figure 1. Global correlation maps represent a measure the connectedness
of each voxel, characterized by the strength and sign of connectivity between a
given voxel and the rest of the brain. The DMN was identified during
resting-state (NS), while during task-state (AS and VS) DMN appeared to be
reduced. Language network and dorsal-visual network were identified during AS
and VS, respectively. Maps were thresholded at a voxel threshold of p <
0.001 (uncorrected) and a cluster threshold of p < 0.05 (FDR corrected).
DMN: Default Mode Network. NS/AS/VS: no task/acoustic task/visual task.
-
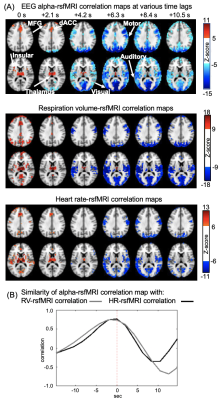
Characteristics of frequency specificity associated with memory cognition.
Himanshu Singh1, S Senthil Kumaran1, A Ankeeta1, and Shefali Chaudhary1
1Department of NMR, All India Institute of Medical Sciences, New Delhi, India
Semantics perception associated
with singular syllable is perceived in respect to its frequency
characteristics. Shifting from IPS to FEF within attentional framework which
may be associated with frequency specificity of stimuli characteristics.
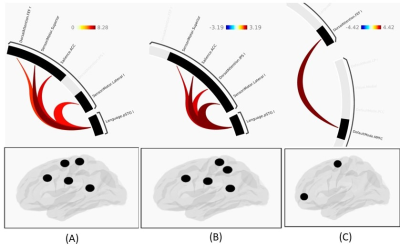
Figure 1: Network connectome for
(a) 500Hz (PTA) modulated 1-Back Memory task, (b) 1-Back Memory without
modulation and (c) 1-Back recall without modulation.
-
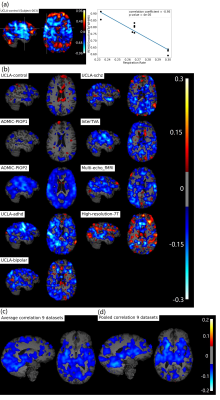
Locus coeruleus is associated with brain state switching
Sana Hussain1, Isaac Menchaca1, Mahsa Alizadeh Shalchy2, Kimia C. Yaghoubi2, Jason Langley3, Aaron R. Seitz2, Megan A.K. Peters4, and Xiaoping P. Hu1,3
1Department of Bioengineering, University of California, Riverside, Riverside, CA, United States, 2Department of Psychology, University of California, Riverside, Riverside, CA, United States, 3Center for Advanced Neuroimaging, University of California, Riverside, Riverside, CA, United States, 4Department of Cognitive Sciences, University of California, Irvine, Irvine, CA, United States
The results described demonstrate that locus coeruleus (LC) activation is associated with switching between brain states. Consequently, they provide potential insight into LC functionality and its relationship with latent brain states.
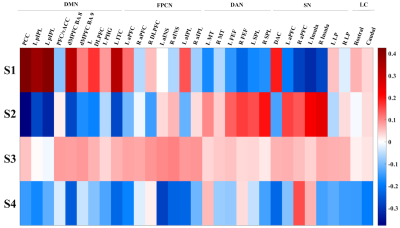
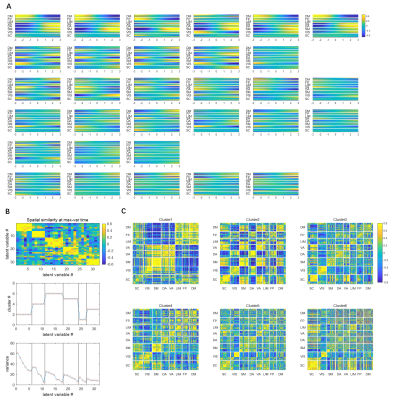
Figure 2. Latent brain states identified from the HMM. Compared to the other states, S1 shows increased DMN activity while S2 shows increased DAN and SN activity. S3 appears to be a transition state consistent with that presented in literature11, and S4 is prevalent during the squeeze blocks of the paradigm. DMN - default mode network; FPCN - fronto-parietal control network; DAN - dorsal attention network; SN - salience network; LC - locus coeruleus.
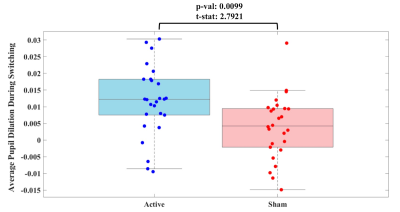
Figure 3. Boxplot showing the average pupil dilation during switching between brain states for active session (left, blue) and sham session (right, red).
-
Dynamic nature of resting networks across different brain states in auditory attentional framework.
Himanshu Singh1, S Senthil Kumaran1, and A Ankeeta1
1Department of NMR, All India Institute of Medical Sciences, New Delhi, India
Quantification of
dynamic nature of hemodynamics pre, post and during Navon task revealed an
association with the most recent experience. Features of dynamic are observed
only across information perceiving network hub, irrespective of overlaid
framework even across complex processing.
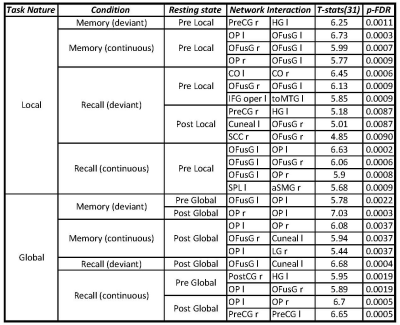
Table 1. Network interaction across different brain states in alphabet Navon task
-
Frequency heterogeneity of semantic language perception in auditory cognition.
S Senthil Kumaran1, Himanshu Singh1, A Ankeeta1, and Shefali Chaudhary1
1Department of NMR, All India Institute of Medical Sciences, New Delhi, India
Processing of complex information
(sentences or series of words) involves modulation of frequency during auditory
perception, which may not represent underlying semantic frequency characteristics.
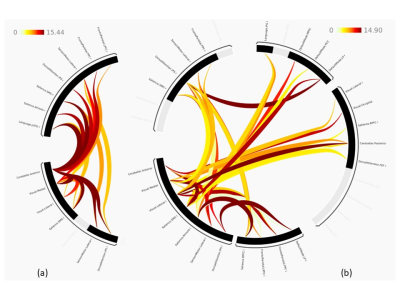
Figure 1.
Intermediate frequency modulation for recall condition in the frequency range (a) 10 to 16 kHz and (b)
1 to 3 kHz.
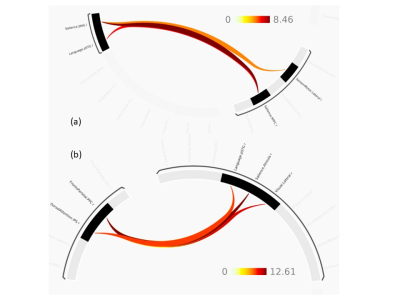
Figure 2. Frequency
modulation for (a) memory condition at 2 kHz (b) recall condition in the intermediate range
of 1 to 3 kHz.
-
KIBRA rs17070145 interacts with gender on brain gray matter volume and functional connectivity density in healthy young adults
Junxia Wang1, Sichu Wu2, Jiaming Lu1, Jilei Zhang3, Zhao Qing1,4, and Bing Zhang1
1Department of Radiology, Nanjing Drum Tower Hospital, The Affiliated Hospital of Nanjing University, Nanjing, China, 2The Affiliated Brain Hospital of Nanjing Medical University, Nanjing, China, 3Philips Healthcare, Shanghai, China, 4Institute for Brain Sciences, Nanjing University, Nanjing, China
These findings underscored the
importance of KIBRA and gender interactions as regards to brain structural and
functional alterations, which is crucial for the neurobiological understanding
of episodic memory.
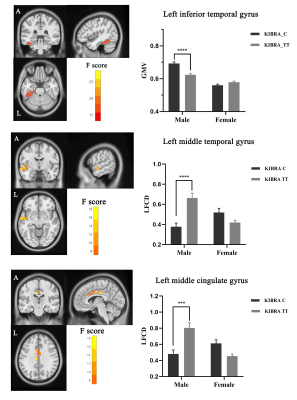
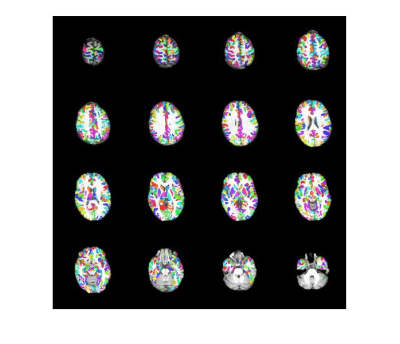
Figure1 KIBRA
rs17070145 interacts with gender on brain gray matter volume and long-range
functional connectivity density. Male KIBRA C-allele carriers showed
greater GMV in the inferior temporal gyrus, while decreased lrFCD in the left
middle temporal gyrus and left middle cingulate gyrus than male TT homozygote.
FWE correction, voxel p < 0.01, cluster p < 0.05.
-
Global Connectivity of the Cerebellum Predicts Slow Wave Sleep Improvement: A Randomized Controlled Acupuncture Trial
Ran Pang1,2, Xi Wu3, Yuchen Chi4, Rommy Elyan5, Xianke Luo6, Zhigang Chen6, Qingxian Yang2, Karunanayaka Prasanna7, and Kuncheng Li8
1Department of Radiology, Dongfang Hospital, Beijing University of Chinese Medicine, Beijing, China, 2Department of Neurosurgery, Pennsylvania State University College of Medicine, Hershey, PA, United States, 3Department of Acupuncture, Dongfang Hospital, Beijing University of Chinese Medicine, Beijing, China, 4Department of Otolaryngology, Dongfang Hospital, Beijing University of Chinese Medicine, Beijing, China, 5Department of Radiology, Pennsylvania State University College of Medicine, PA, USA, Hershey, PA, United States, 6Department of Neurology, Dongfang Hospital, Beijing University of Chinese Medicine, Beijing, China, 7Department of Radiology, Pennsylvania State University College of Medicine, Hershey, PA, United States, 8Department of Radiology, Xuanwu Hospital, Capital Medical University, Beijing, China
Using verum and
sham acupunture treatments, and resting state fMRI, we've identified a unique
role and architecture for the cerebellum. It acts as a flexible, global hub
with a brain-wide influence that supports and maintains circadian rhythms
and sleep homeostasis.
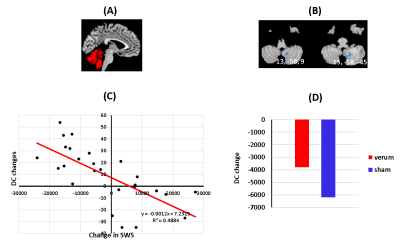
Figure 2. (A)
Cerebellum mask (B &C) DC changes in cerebellum (8,9) is
correlated with sleep improvement (D) Insignificant DC changes between verum and
sham groups in cerebellum (8,9)
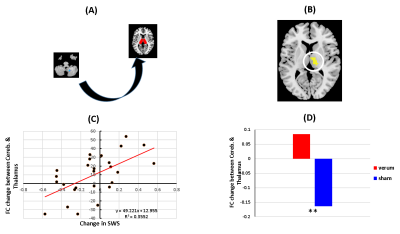
Figure 3. (A)
Functional connectivity (FC) between the cerebellum (8,9) seed and the thalamus
(B
& C) FC
changes in thalamus are correlated with sleep improvement in both groups (D) Significant
FC
changes between the verum and
sham groups in the thalamus (**p < 0.01).
-
Dynamic functional network connectivity differences and its association with neurocognitive changes in cirrhotic patients
Jia Yan Shi1, Zhong Shuai Zhang2, and Hua Jun Chen1
1Department of Radiology, Fujian Medical University Union Hospital, Fuzhou, China, 2SIEMENS Healthcare, Shanghai, China
Aberrant dynamic FNC is a fundamental feature of brain dysfunction in cirrhotic patients without OHE, which is associated with neurocognitive decline. Dynamic FNC analysis may be a promising avenue in generating new insights into cirrhosis-related neuropathological processes.
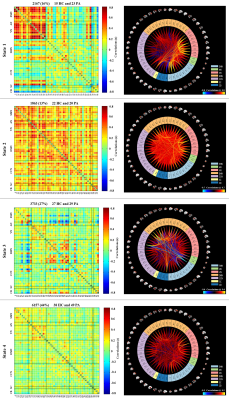
Figure 2. Left column indicates the FNC matrices of States 1-4, with the number of windowed FNCs in every state, the corresponding percentage, as well as the number of participants from every group who entered into the state. Right column represents the visualization of functional network connectivity in each state. The functionalconnectivity matrix was screened using a threshold of 0.1 to display all independent components of functional networks. HC, healthy control; PA, cirrhotic patient.
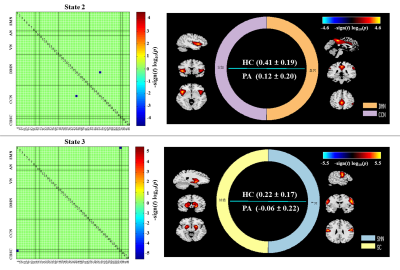
Figure 3. Significant group differences in the functional network connectivity in each state. The results are displayed as the -sign(t)*log10(p). Statistical threshold wasestablished at an FDR-corrected P<0.05. HC, healthy control; PA, cirrhotic patient.
-
Altered cortical-striatal network in patients with hemifacial spasm
Wenwen Gao1, Lei Du1, Bing Liu1, Yue Chen1, Yige Wang1, Xiuxiu Liu1, Lizhi Xie 2, and Guolin Ma1
1China-Japan Friendship Hospital, Beijing, China, 2GE healthcare, China, Beijing, China
Hemifacial spasm (HFS) is a motor disorder. The
purpose of this study was to investigate the functional alterations of the cortical-striatal
network in HFS using resting-state fMRI. To sum up, these data suggest that HFS may lead to an alteration of
neural activity of the cortical-striatal
loop.
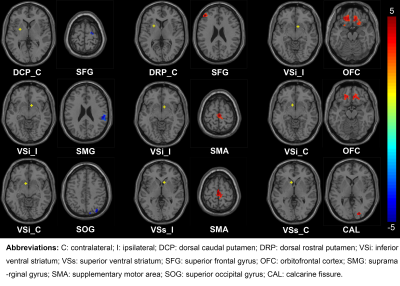
Fig. 1: Differences of the
cortical-striatal FC in patients with HFS compared to healthy controls. The FC
between striatal subregions and both motor and emotion-related cortex was
statistically different between the two groups (GRF correction, voxel P < 0.005,
cluster P < 0.05). The yellow dots in the brain represent the seeds of
striatal subregions. The red regions represent the increased FC between seeds
and cortexes, while the blue areas represent a decreased FC. The color bar
represents the t value.
-
Alterations in regional and network-level neural function in patients with HCV infection and its association with cognitive dysfunction
Jia Yan Shi1, Zhong Shuai Zhang2, and Hua Jun Chen1
1Department of Radiology, Fujian Medical University Union Hospital, Fuzhou, China, 2SIEMENS Healthcare, Shanghai, China
This preliminary study presents additional evidence that HCV infection
affects brain function, including local intrinsic neural activity and global functional
integration.
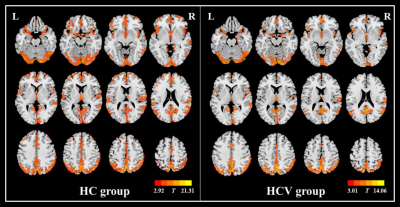
Figure 1. Within-group ALFF maps in the healthy control (HC) group as well as the
patients infected with hepatitis C virus (HCV). The letters “L” and “R” represent the
left and right sides, respectively.
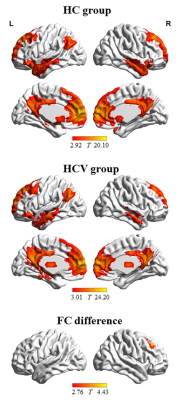
Figure 3. The functional connectivity pattern of seed region (i.e. left medial frontal
gyrus and bilateral anterior cingulate gyrus) in the healthy control (HC group) and the
patients with Hepatitis C Virus infection (HCV group). Compared with HC group,
HCV group shows decreased functional connectivity between seed region and right
middle frontal gyrus. The letters “L” and “R” represent the left and right sides,
respectively.
-
Brain structural and functional reorganization in tinnitus patients without hearing loss after sound therapy: a preliminary longitudinal study
Qian Chen1, Han Lv1, Zhaodi Wang2, and Zhenchang Wang1
1Department of Radiology, Beijing Friendship Hospital, Capital Medical University, Beijing, China, 2Department of Otolaryngology Head and Neck Surgery, Beijing Friendship Hospital, Capital Medical University, Beijing, China
Idiopathic tinnitus patients
experienced significant differences in auditory-related and nonauditory-related
brain reorganization before and after sound therapy (narrow band noise), that
is, sound therapy may have a significant effect on brain reorganization in
patients with idiopathic tinnitus.
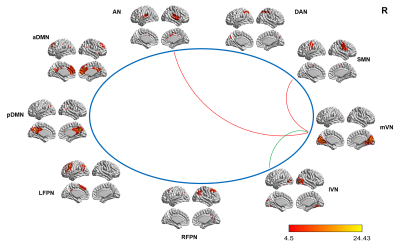
Figure4 Intergroup differences in internetwork FC between the tinnitus patients and HCs and
between the patients before and after sound therapy.
(A) Compared with the HCs, the tinnitus patients exhibited a
decreased (i.e., positive) (mVN and lVN) or an increased (i.e., less negative)
(mVN and SMN; mVN and AN) internetwork FC at baseline.
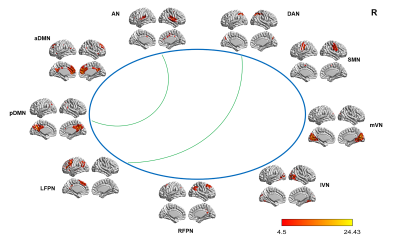
Figure4 (B) Compared with HCs,
tinnitus patients showed a decreased (i.e., positive) (AN and pDMN; DAN and LFPN) internetwork FC after sound
therapy.
-
Altered small-world, functional brain networks in patients with postherpetic neuralgia
jian jiang1 and yanwei miao1
1The first affiliated hospital of Dalian medical university, Dalian, China
Enter a 250-character short synopsis that will appear in the digital slides. The short synopsis should NOT appear in the actual abstract submission.
The brain networks of the LBP group lead to the slower information processing in the brains of those with LBP compared to PHN.
-
Clavulanic Acid Alters Functional Connectivity of the Anterior Cingulate Cortex in Subjects with Cocaine Use Disorder: A Pilot fMRI Study
Helene L Philogene-Khalid1,2, Eric M Cunningham1, Mary F Morrison1,2, and Nicolas R Bolo3,4
1Psychiatry, Lewis Katz School of Medicine at Temple University, Philadelphia, PA, United States, 2Center for Substance Abuse Research, Lewis Katz School of Medicine at Temple University, Philadelphia, PA, United States, 3Psychiatry, Beth Israel Deaconess Medical Center, Boston, MA, United States, 4Psychiatry, Harvard Medical School, Boston, MA, United States
In cocaine addiction, repeated CLAV decreased the anterior
cingulate connectivity with default mode and cue reactivity related networks,
while it increased the anterior cingulate connectivity with sensory-motor and
motor control processing networks.
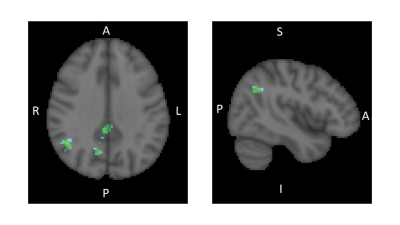
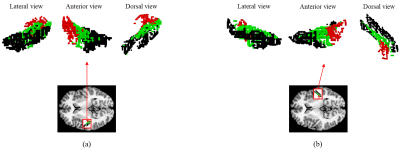
Fig. 1 Statistical nonparametric map showing regions with significant decrease
in functional connectivity (FC) with the ACC after 10days of CLAV
administration compared to baseline. Regions of decreased FC (FDR=0.01,
corrected) in blue-green scale (paired t-test T-value threshold 5.3) overlaid
on the standard MNI-152 brain in grey scale. Right side sagittal slice (y=-56) shows
the angular gyrus region. Left
side axial slice (z=33) shows the angular
gyrus, precuneus, and posterior cingulate cortex regions. R=right
L=left A=anterior P=posterior I=inferior S=superior
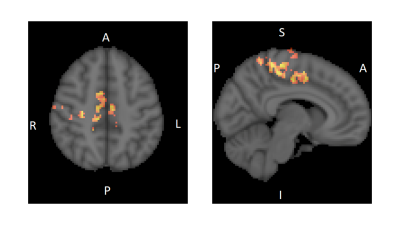
Fig. 2 Statistical nonparametric map showing regions with significant increase
in functional connectivity (FC) with the ACC after 10days of CLAV
administration compared to baseline. Regions of increased FC (FDR=0.01,
corrected) in red-yellow scale (paired t-test T-value threshold 5.3) overlaid
on the standard MNI-152 brain in grey scale. Right side sagittal slice (y=-6) shows
the Paracentral gyrus (pre and post-central) regions. Left side axial slice (z=48) shows the Supplementary
Motor Area and dorsal ACC regions. R=right L=left A=anterior
P=posterior I=inferior S=superior
-
Can familial Alzheimer variability affect brain networks? Exploration through Osaka Ab variant inoculation in mice.
Marina Celestine1, Jean-Baptiste Pérot1, Muriel Jacquier-sarlin2, Karine Cambon1, Julien Flament1, Alain Buisson2, Anne-Sophie Hérard1, and Marc Dhenain1
1Université Paris-Saclay, Commissariat à l’Energie Atomique et aux Energies Alternatives (CEA), Centre National de la Recherche Scientifique (CNRS), Molecular Imaging Research Center (MIRCen), Laboratoire des Maladies Neurodégénératives, Fontenay-aux-roses, France, 2University Grenoble Alpes, Inserm, U1216, Grenoble Institut Neurosciences (GIN), Grenoble, France
Exposition to Alzheimer's disease related-Aβ variant lead to memory
impairment, brain connectivity alteration and decreased brain glutamate
levels in transgenic mouse model.
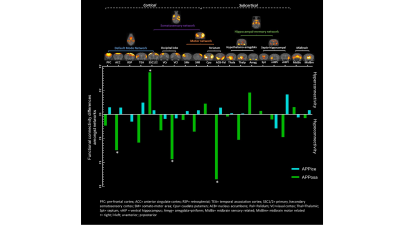
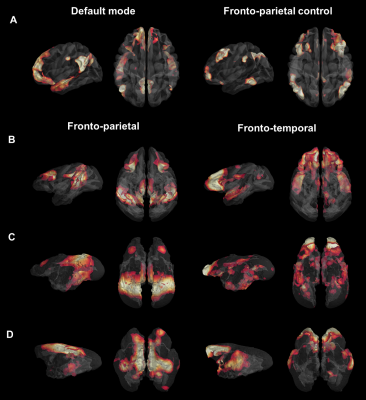
Figure 2. Aβosa and Aβice induce seed-based
analysis of connectivity changes amongst network. Whole-brain dictionary learning
maps depicting 19 cortical and subcortical components found in 4 main networks (upper).
Group differences seed-based connectivity pattern through components for
inoculum site (dentate gyrus)(lower). Asterisk represents significant p-value (p<0.001) of the
group difference in Fisher z-transformed correlation.
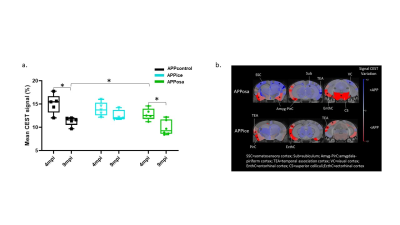
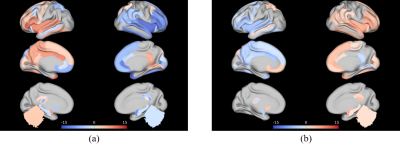
Figure 5. Decreased glutamate levels after Aβosa inoculation in APPswe/PS1de9
mice. a. GluCEST average signal
evolution in APPice, APPosa and APPcontrol mice shows age-related modification
detected in 9 mpi animals. They are rescued by Aβice inoculation. b. Variation maps of GluCEST at 4mpi (right). Variations was
calculated in every region from the atlas. Colors represent hyposignal (blue)
and hypersignal (red) comparing to control mice (*p<0.05).
-
Changes in Gray Matter Volume and Functional Connectivity of Obese Females with Acupuncture and Diet Control Therapy: Placebo Effect or Not?
Jiawei Han1, Hui Zhang2, Junqi Xu2, Fanwen Wang2, Jian Gao3,4, Weibo Chen5, Hongmei Yan6, and He Wang1,2
1Human Phenome Institute, Fudan University, Shanghai, China, 2Institute of Science and Technology for Brain-Inspired Intelligence, Fudan University, Shanghai, China, 3Department of Nutrition, Zhongshan Hospital, Fudan University, Shanghai, China, 4Center of Clinical Epidemiology and Evidence-based Medicine, Fudan University, Shanghai, China, 5Philips Healthcare, Shanghai, China, 6Department of Endocrinology, Zhongshan Hospital, Fudan University, Shanghai, China
Compared with diet control, acupuncture increase grey matter volume in physiological and psychological brain regions, where the impact on functional connectivity is even lighter after therapy. Acupuncture is likely to improve endocrine while reducing the pressure of weight loss.
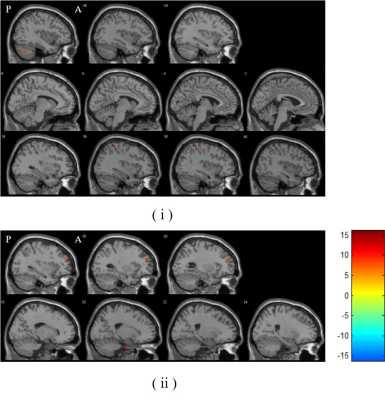
Figure 1. (i) Regions wherein GMV are significantly
increased after acupuncture. The centers of 3 ROIs are MNI space coordinates of these clusters’ peak voxel
(ROI 1: (-38, -72, -35); ROI 2: (-5, -54, 8); ROI 3: (39, -41, 66)). (ii) Regions
wherein GMV are significantly increased after diet control therapy. The centers
of 2 ROIs are the MNI space coordinates of these clusters’ peak voxel (ROI 4:
(18, -9, -38); ROI 5: (-30, 47, 27)). P: Posterior; A: Anterior. Results (scan
2 – scan 1) are reported with a threshold of p < 0.001 (uncorrected) on the
voxel level and a cluster extent > 30 voxels.
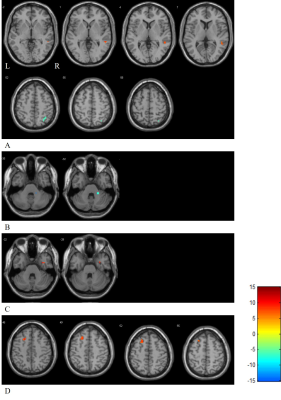
Figure 2. The results of FC with 5 ROIs after acupuncture. A: Row 1 is the region wherein FC with ROI 2 are significantly increased and row 2 is the region wherein FC are decreased. B: The region wherein FC with ROI 3 are significantly decreased. C: The region wherein FC with ROI 4 are significantly increased. D: The region wherein FC with ROI 5 are significantly increased. L: Left; R: Right. Results (scan 2 – scan 1) are reported with a threshold of p < 0.001 (uncorrected) on the voxel level and a cluster extent ≥ 5 voxels.
-
The Changes in Longitudinal ALFF and ReHo Values of Methamphetamine Abstinence Subjects Based on Harvard-Oxford Atlas
Yanyao Du1, Ru Yang1, Wenhan Yang1, Huiting Zhang2, and Jun Liu1
1Department of Radiology, the Second Xiangya Hospital of Central South University, Changsha, China, 2MR Scientific Marking, Siemens Healthcare Ltd., Wuhan, China
The ALFF value of the two regions may be a new biomarker which can
reflect the impact of withdrawal on brain function.
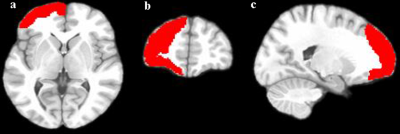
Figure 1. Different brain regions compared by
ALFF value of short-term and long-term abstinence
groups