-
Signal-to-noise-ratio gain and in vivo application of a 13C cryo-coil for hyperpolarized MRSI
Luca Nagel1, Geoffrey J. Topping1, and Franz Schilling1
1Department of Nuclear Medicine, Technical University of Munich, School of Medicine, Klinikum rechts der Isar, Munich, Germany
We show that a cryogenically cooled 13C RF coil
can improve the SNR up to a factor of 10 compared to conventional RF coils. As a proof of concept, we
used the 13C-cryocoil for improved
detection of hyperpolarized compounds in vivo.
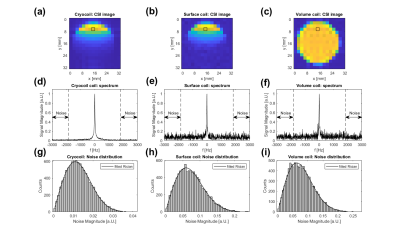
Figure 1: CSI images of the
thermal 13C Urea phantom (a, cryocoil), (b, surface coil) and (c,
volume coil). It can be seen that both surface coils suffer from an inhomogeneous
transmit and receive profile. (d), (e) and (f) show spectra from the voxel
indicated by the black box in the above images. The spectral range indicated
by the arrows was used for the calculation of noise distribution. (g), (h) and
(i) show the the Rician noise distribution from the range indicated in the
above spectra.
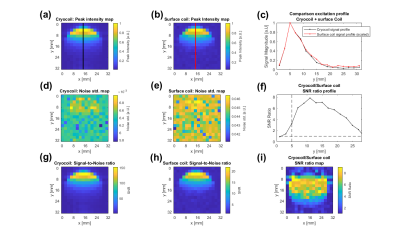
Figure 2: The peak intensity
maps for the cryocoil (a) and surface coil (b) at RF powers that yield similar
excitation profiles for both coils(c). (d) and (e) show an example of the noise
maps, which were determined by fitting a Rician distribution to the noise
region shown in Fig.1. The SNR ratio along the lines in (a) and (b) is shown in
(f). (g) and (h) show the calculated SNR maps of the cryocoil and the surface coil. In (i), the ratio of the two SNR maps is shown.
-
Ultra-Flexible 8-Channel Receive Array for 13C Imaging
Vitaliy Zhurbenko1, Juan Diego Sánchez Heredia1, Wenjun Wang1, and Jan Henrik Ardenkjær-Larsen1
1Technical University of Denmark, Kgs. Lyngby, Denmark
In this work, a design of an 8-element
ultra-flexible array for 13C imaging is presented. The design is
based on a compact low-noise preamplifier and includes 13C/1H
active and passive decoupling. Due to flexibility, the array is easily adoptable
to different parts of the body.
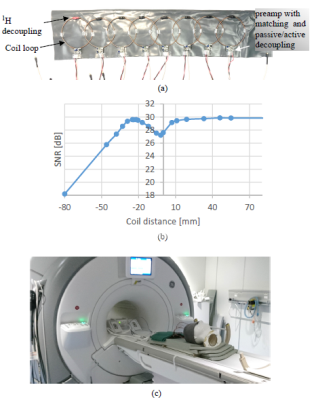
Fig.
4. (a) Photograph
of the array with cover removed; (b) measured SNR of the element as a function
of edge-to-edge distance to the neighbor element; (c) photograph of the imaging setup.
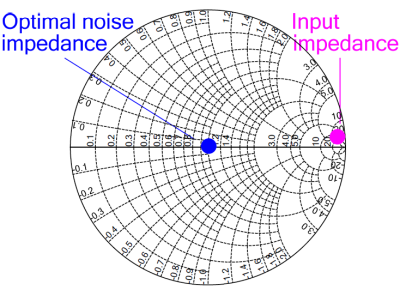
Fig.
3. Impedances
at the input terminals of the matching and decoupling circuit (normalized to impedance
of the coil Zc).
-
Metamaterial Liner RF Head Coil for 23Na and 1H at 4.7 T
Adam Maunder1, Ashwin Iyer2, and Nicola De Zanche1
1Oncology, Medical Physics, Cross Cancer Institute, University of Alberta, Edmonton, AB, Canada, 2Electrical and Computer ENgineering, University of Alberta, Edmonton, AB, Canada
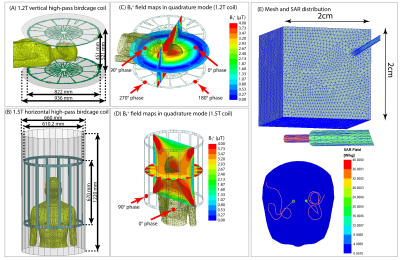
A novel
metamaterial liner based RF transmit coil, representing a new class of volume
coil, is developed for 23Na/1H head imaging at 4.7T. Reduced specific
absorption rate for the same transmit field compared to the birdcage coil is
demonstrated by simulation and imaging results are presented.
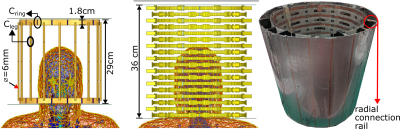
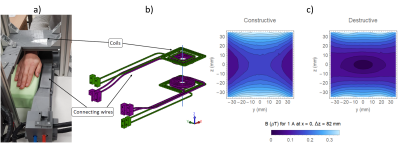
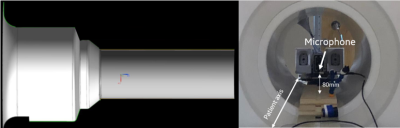
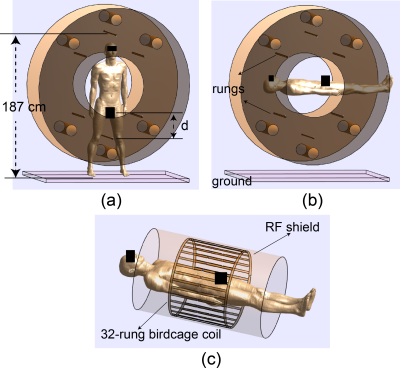
Figure 3: (Left) Simulation model of the birdcage coil (with tuning
capacitors labelled) used to compare performance of the (Middle) simulation
model of the metamaterial resonator with human body model. (Right) Photograph
of the constructed metamaterial liner resonator. Small wires (0.6 mm diameter)
join the Cr capacitor pads to the aluminum mesh through contact
between conductive rails that press against aluminum tape on the inner side of
the polycarbonate shell.
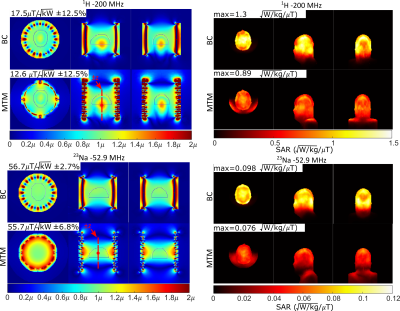
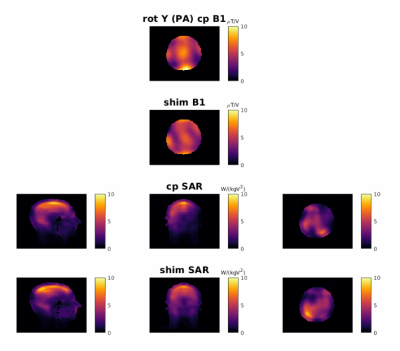
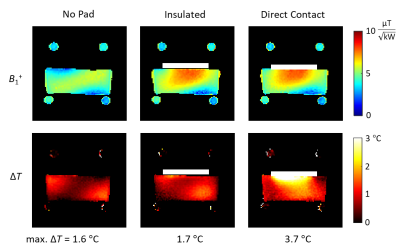
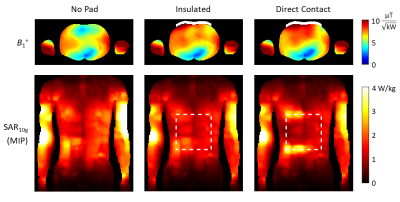
Figure 4: (Left) Simulated transmit performance of the metamaterial
liner and single tuned birdcage coil for 1H – 200 MHz and 23Na – 52.9 MHz imaging. (right) Maximum intensity
projections of the local 10g average SAR normalized to a mean 1μT
transmit field in the region outlined in the transmit efficiency maps
for 1H–(200 MHz) and 23Na–(52.9 MHz).
-
1H, 31P, 23Na, and 13C imaging and spectroscopy with a multi-tunable double-coil assembly
Viktor Puchnin1, Viacheslav Ivanov1, Mikhail Gulyaev2, and Mikhail Zubkov1
1Department of Physics and Engineering, ITMO University, Saint-Petersburg, Russian Federation, 2Faculty of Fundamental Medicine, Lomonosov Moscow State University, Moscow, Russian Federation
A dual-coil assembly for imaging two and more nuclei is tested with
phantoms containing a mixture of different nuclei, including 1H, 31P, 23Na and
13C. 1H and 23Na images and 23Na, 31P and 13C spectra are acquired. The coil
design shows promising results for multiheteronuclear imaging.
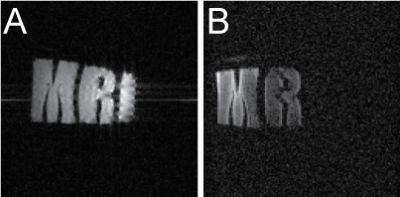
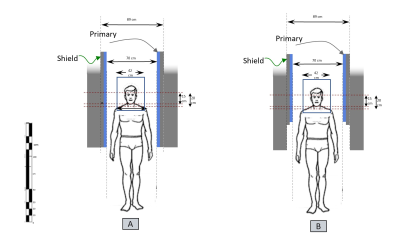
A –
1H image of a 3-section phantom filled uniformly with aqueous NaH2PO4
solution, B – 23Na image of a 3-section phantom. Section 1, “M” contains
aqueous NaH2PO4. Section 2, “R”, contains a solution of
NaCl and MnCl2. Section 3, “I”, is filled with the MnCl2 solution.
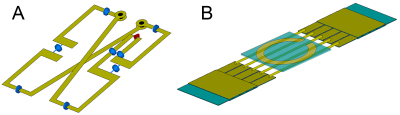
A –
1H butterfly-type coil model with tuning/matching capacitors. B – X-nuclei tuneable coil model. Feeding of the X-nuclei coil is
provided via inductive coupling to a small loop coil.
-
SNR and B1+ Field Homogeneity of a Koch Fractal Geometry RF Surface Coil for 23Na-MRI
Cameron Nowikow1, Paul Polak1, Norman B. Konyer2, Natalia Nikolova3, and Michael D. Noseworthy1,2,3
1School of Biomedical Engineering, McMaster University, Hamilton, ON, Canada, 2Imaging Research Centre, St. Joseph's Healthcare, Hamilton, ON, Canada, 3Electrical and Computer Engineering, McMaster University, Hamilton, ON, Canada
There is a lack of SNR in 23Na-MR images than 1H-MRI. RF coil geometry could provide an SNR increase. A comparison in B1+ field homogeneity between a Koch fractal surface coil and a circular geometry reference found the circular coil to have a more homogeneous field and associated SNR.
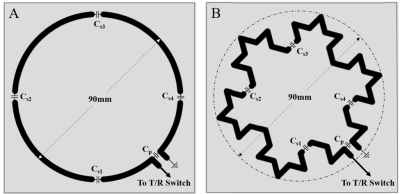
Figure 1: Surface coil geometry.
The geometry of the
(A) circular, and (B) fractal coil. Each were copper etched on a 100x100mm FR4
substrate with breaks in loop for the tuning capacitors (Cs1-4) and
the matching capacitor (Cp). One end of the loop for both coils was
connected to the T/R switch via a coaxial cable while the other end of the loop
was grounded using the same coaxial cable to form a one port network.
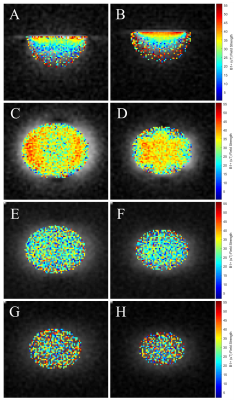
Figure 3: B1+ Field
Maps.
The B1+ field
maps for the (A,C,E,G) circular coil, and (B,D,F,H) fractal coil. A and B show
the sagittal field map and C-H show the three coronal maps which are slice
centered at depths of (C,D) 15mm, (E,F) 25mm, and (G,H) 35mm.
-
Towards a cryogenic RF coil array for 13C human head imaging: first experience
Wenjun Wang1, Juan Diego Sánchez Heredia2, Vitaliy Zhurbenko1, and Jan Henrik Ardenkjær Larsen2
1Department of Electrical Engineering, Technical University of Denmark, Kongens Lyngby, Denmark, 2Department of Health Technology, Technical University of Denmark, Kongens Lyngby, Denmark
A cryogenic coil for 13C human head
imaging is developed, showing 1.90-fold SNR improvement over a room-temperature
coil. Based on this coil design, a 4-channel cryogenic array is developed showing
1.54-fold SNR gain over a room-temperature array.
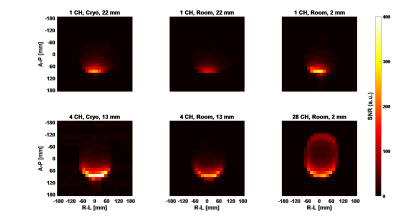
Fig. 3. SNR maps of 1-, 4-, and 28-channel coils at
cryogenic and room temperatures. The SNR has an arbitrary unit. The peak SNRs are
247 for 1-channel cryogenic coil, 130 and 296 for room-temperature coils separated
from the phantom by 22 mm and 2 mm; 417 and 270 for 4-channel
cryogenic and room-temperature arrays separated from the phantom by 13 mm;
265 for 28-channel array. The ratio of cryogenic SNR to room-temperature are
1.90 for the 1-channel coil and 1.54 for the 4-channel array.
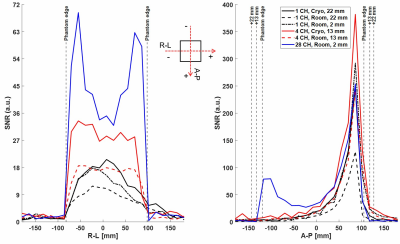
Fig. 4. Cross-section SNR profiles of imaging
experiments. The SNR has an arbitrary unit. The SNR values are averaged between
two nearest pixels. The inset shows the positions of cross-sections.
-
Quantitative Comparison of 31P MRS Imaging Performances between 7T and 10.5T Human Scanners Using a Loop-dipole 31P-1H Probe
Xin Li1, Hannes M. Wiesner1, Matt Waks1, Xiao-Hong Zhu1, and Wei Chen1
1Center for magnetic Resonance Research (CMRR), Department of Radiology, University of Minnesota, Minneapolis, MN, United States
We found that SNR of the 31P MRSI signal was 1.5
times higher at 10.5T human scanner as compared to 7T, and the power dependence
of SNR on B0 was 1.7.
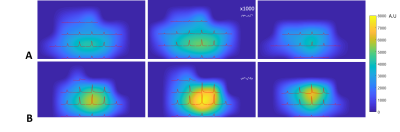
Figure 4. Three representative transversal slices of 31P
SNR maps of Pi acquired at (A) 7T and (B) 10.5T, overlaid with 2D CSI slice (extracted
from 3D data) acquired at the 90o nominal flip angle of the global Pi
signal. The noise level was zoomed in ×1000
times along the vertical scale. This figure clearly shows significant
improvement in spectral quality and SNR at 10.5T.
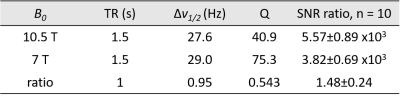
Table1. The parameters and their ratios measured at 7T and 10.5T and
used for quantification.
-
A nested dual-tuned proton-sodium loop-array transceiver coil on a 9.4T whole-body MRI system
Zhe Wang1, Fangrong Zong2, Cheng Fang1, Wenhui Yang3,4, Shasha Yue1, Yan Hou2, Zehui Li2, Tianyu Xie2, Kun Zhang2, Yan Zhuo1,4,5, Xiaohong Joe Zhou6, Xiaoliang Zhang7, and Rong Xue1,4,8
1State Key Laboratory of Brain and Cognitive Science, Beijing MRI Center for Brain Research, Institute of Biophysics, Chinese Academy of Sciences, Beijing, China, 2Institute of Biophysics, Chinese Academy of Sciences, Beijing, China, 3Institute of Electrical Engineering Chinese Academy of Sciences, Beijing, China, 4University of Chinese Academy of Sciences, Beijing, China, 5CAS Center for Excellence in Brain Science and Intelligence Technology, Chinese Academy of Sciences, Beijing, China, 6Center for MR Research and Departments of Radiology, Neurosurgery and Bioengineering, University of Illinois at Chicago, Chicago, IL, United States, 7Department of Biomedical Engineering, State University of New York at Buffalo, Buffalo, NY, United States, 8Beijing Institute of Brain Disorders, Beijing, China
A nested dual-tuned proton-sodium loop-array transceiver coil was designed for 9.4T MRI with RF shimming for both nuclei. High quality proton and sodium images on a water phantom were successfully collected at the same location, which sufficiently provide
convenience for patients.
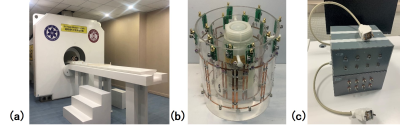
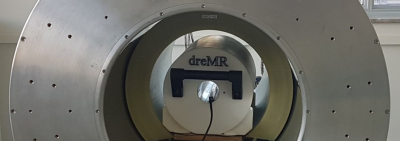
Figure 1 Photography of the first 9.4T whole-body
(830 cm diameter) ultra-high field MRI in China (a), the nested dual-tuned
proton-sodium multi-channel loop-array transceiver coil (b) and the RF interface
(c).
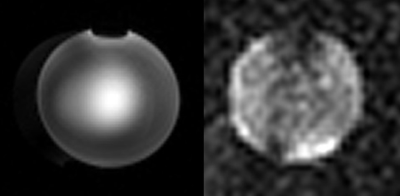
Figure 4 Proton(left)and sodium(right)images obtained by the dual-tuned coil array at 9.4 T.
-
Flexible 32-Channel 13C MRI Head Array: An EEG-Lookalike Design Approach
Juan Diego Sánchez Heredia1, Wenjun Wang1,2, Vitaliy Zhurbenko2, and Jan Henrik Ardenkjær-Larsen1
1Department of Health Technology, Technical University of Denmark (DTU), Kgs. Lyngby, Denmark, 2Department of Electrical Engineering, Technical University of Denmark (DTU), Kgs. Lyngby, Denmark
We propose a design concept for flexible human
head coil arrays, where the array is built into a neoprene EEG cap, and made
of regular-copper flexible wire.
A 32-channel prototype for 13C at 3T
(32.1 MHz) is presented and evaluated, showing SNR performance superior to a 13C-dedicated
volume coil.
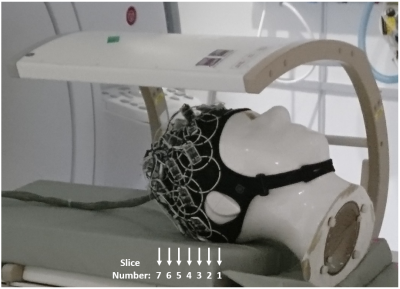
Figure 2. Fabricated flexible 32-channel 13C
receive-only array (f = 32.1 MHz), attached to the head phantom used for MR
characterization. The projection of the 7 slices used for the volumetric
characterization is also noted.
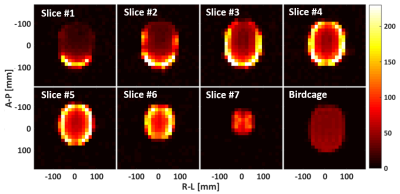
Figure 3. SNR maps of the
seven slices covering the whole brain area of the head phantom, and comparison
to the results measured with a reference birdcage coil.
-
9.4 T Double-Tuned 13C/1H Human Head Array Using a Combination of Surface Loops and Dipole Antennas.
Nikolai Avdievich1, Georgiy Solomakha2, Loreen Ruhm1, Anke Henning1,3, and Klaus Scheffler1
1High-field Magnetic Resonance, Max Planck Institute for Bilogical Cybernetics, Tübingen, Germany, 2Physics and Engineering, ITMO University, St. Petersburg, Russian Federation, 3Advanced Imaging Research Center, University of Texas Southwestern Medical Center, Dallas, TX, United States
Combining X-nuclei surface loops and 1H dipoles
can substantially simplify the design of a double-tuned UHF human head coil. We developed and constructed a novel 13C/1H
human head 9.4T array coil consisting of eight 13C surface loops
and eight 1H folded-end dipoles surrounding the head.
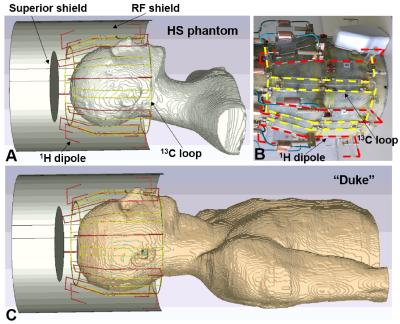
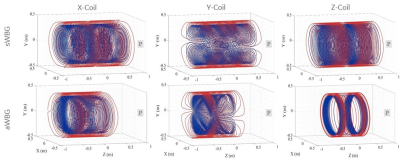
Figure 1. A) EM simulation model of
the double-tuned 13C/ 1H array coil loaded by the HS
phantom. B) Photo of the 13C/ 1H array with the RF shield
removed for better visualization. C) EM simulation model of the 13C/
1H array loaded by the Duke voxel model. In Figure 1B, dipoles and
loops are marked by red and yellow dashed lines, respectively.
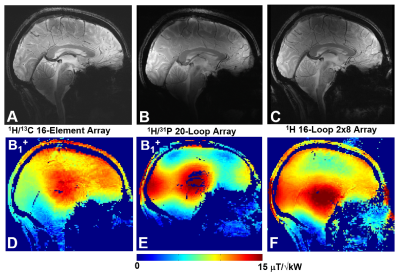
Figure 5. Central sagittal in-vivo human
brain GRE images (A, B, C) and corresponding B1+ maps (D, E, F) obtained using the presented double-tuned 13C/ 1H array (A,D), double-tuned
20-loop 31P/ 1H array (B, E), and single-tuned 16-loop
double-row 1H array (C, F).
-
Analysis of common-mode rejection ability and Insertion Loss of Dual band Lattice Balun with non-ideal components
Yue Zhu1,2 and Xinqiang Yan1,2
1Vanderbilt University Institute of Imaging Science, Nashville, TN, United States, 2Department of Radiology and Radiological Sciences, Vanderbilt University, Nashville, TN, United States
A
dual band Lattice balun was proposed to remove common mode current for both frequencies in dual-tuned MRI coils with a single
interfacing unit. In
this work, we analyzed how each lumped element will affect this device's performance
and optimized the circuit performance based on the analysis.
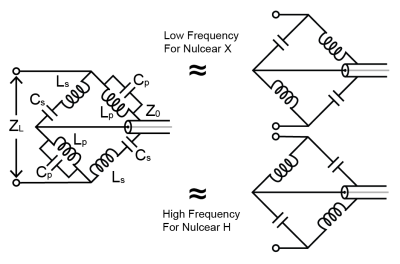
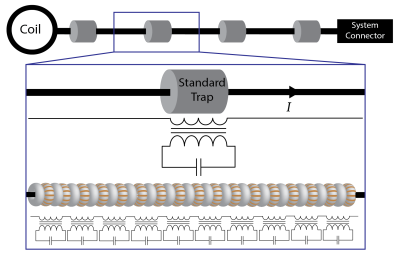
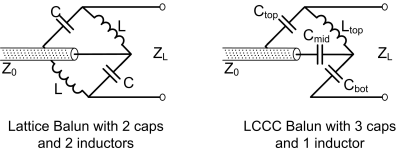
Figure 1. Diagram of
the dual tuned balun and approximations for different nuclei. The dual-band balun
approximates two different single-band baluns at different frequencies, making
it suitable for dual-band detection systems.
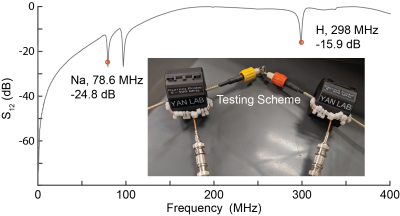
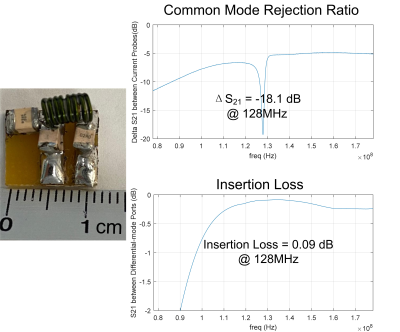
Figure 5. Common
mode rejection ratio test with current probes. The CMRR shows a good rejection
ratio at sodium and proton frequencies. The two current probes are connected to
the VNA while the ground of the two cables from the balun circuit connects to a
large resistor.
-
Interleaved nine-leg birdcages for simultaneous geometric decoupling from a double tuned planar array
Joseph Busher1, Chenhao Sun2, Travis Carrell1, Edith Valle2, Steven M. Wright1,2, and Mary McDougall1,2
1Biomedical Engineering, Texas A&M University, College Station, TX, United States, 2Electrical and Computer Engineering, Texas A&M University, College Station, TX, United States
This work describes two interleaved nine-leg birdcages for geometric decoupling from a planar array for 1H and 23Na at 4.7T. The symmetric design was shown to geometrically decouple from a six element array at both frequencies, thus enabling multinuclear multichannel imaging experiments.
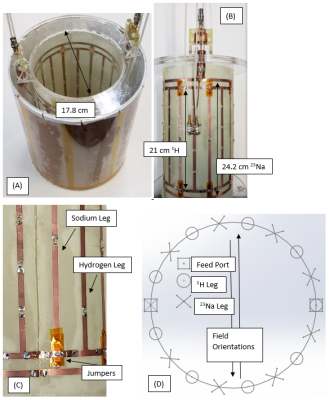
Figure 1:
Photographs of the coil (A) Coil inside of shield (B) Coil showing alternating
rungs and match/tune configuration for the hydrogen port. (C) Close up view of
the jumpers. The hydrogen coil can be
identified by the greater number of breakup capacitors on the legs, the
capacitors on the end rings bridging the sodium legs, and the shorter length
compared to the sodium coil. (D)
Cross-sectional block diagram showing field orientations with respect to the
legs and the respective feed ports.
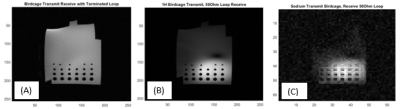
Figure 3: Image data. (A) Birdcage Transmit/Receive with loop
terminated in 50Ω load. (B)
Birdcage transmit, loop receive for hydrogen.
(C) Birdcage transmit,loop receive for sodium
-
Flexible 8-Channel Array for Hyperpolarized 13C at 3T (32.1 MHz), with Nearly Identical 23Na (33.8 MHz) Sensitivity Profiles
Juan Diego Sánchez Heredia1, Wenjun Wang1,2, James T. Grist3,4,5, Esben Søvsø Szocska Hansen6, Christoffer Laustsen6, Vitaliy Zhurbenko2, and Jan Henrik Ardenkjær-Larsen1
1Department of Health Technology, Technical University of Denmark (DTU), Kgs. Lyngby, Denmark, 2Department of Electrical Engineering, Technical University of Denmark (DTU), Kgs. Lyngby, Denmark, 3Department of Physiology, Anatomy and Genetics, University of Oxford, Oxford, United Kingdom, 4Oxford Centre for Magnetic Resonance, University of Oxford, Oxford, United Kingdom, 5Department of Radiology, The Churchill Hospital, Oxford University Hospitals NHS Trust, Oxford, United Kingdom, 6The MR Research Center, Department of Clinical Medicine, Aarhus University, Aarhus, Denmark
An 8-Channel flexible array is proposed for hyperpolarized 13C, where the coil coupling coefficients are matched to be
nearly identical at the 13C (32.1 MHz) and 23Na (33.8 MHz) frequencies. This
way, the 23Na present in biological tissue can be used to obtain accurate 13C
profiles.
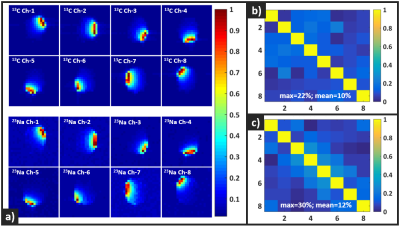
Figure 4. (a) Measured sensitivity profiles of the
individual array channels for 13C (top) and 23Na (bottom). (b) 13C Noise correlation matrix. (c) 23Na Noise correlation matrix.
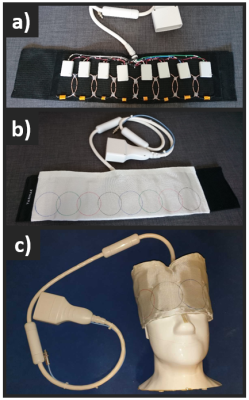
Figure 1. Fabricated flexible 8-channel 13C
receive array (f = 32.1 MHz): a) with the 8-elements visible sewn into a flexible cloth, b) covered
with a flame-retardant protective cloth and, c) wrapped over the head-size
phantom used for imaging. All the electronic components (matching network,
active decoupling, LNA) are integrated into one PCB, and enclosed into an ABS
box (60x35x15 [mm]).
-
Increased B1+ efficiency of a dipole antenna compared to a loop coil for 31P-MRS at 7T: simulations and cardiac MRSI data
Jabrane Karkouri1, Saba Shirvani1, Tiger Zhang1, Dennis Klomp2, Martijn Lunenburg3, Ladislav Valkovic4, and Christopher T. Rodgers1
1Wolfson Brain Imaging Center, University of Cambridge, Cambridge, United Kingdom, 2Department of Radiology, University Medical Center Utrecht, Utrecht, Netherlands, 3Tesla Dynamic Coils, Zaltbommel, Netherlands, 4Oxford Centre for Clinical Magnetic Resonance Research, University of Oxford, Oxford, United Kingdom
We evaluated the performance of
two RF coil configurations for ultra-high field 31P-MRS
applications in the body via simulations, through
phantom and in vivo scans. Both verifications indicate that there is improvement in terms of B1+
efficiency for the dipole + loop vs quadrature loops.
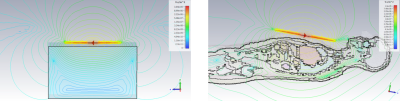
Figure 3: B1+ field simulation results
of the dipole coil over a homogeneous phantom and a heart numerical model.
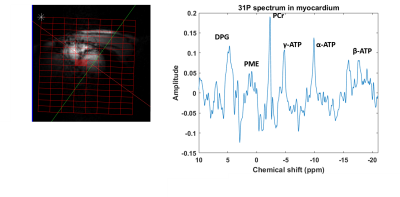
Figure 5: Left: cardiac mid-short axis localiser and CSI
grid. Right: mid-septal 31P cardiac spectrum (apodised by 30 Hz) from
the voxel highlighted in the CSI grid.
-
Optimized Single-loop Coil with 3D-shaped Design for Simultaneous fMRI and Optical Imaging in Rodent
Wen-Ju Pan1, Lei Zhou1, Gloria Perrin Clavijo1, Vahid Khalilzad Sharghi1, and Shella Keilholz1
1Biomedical Engineering, Emory University/Georgia Institute of Technology, Atlanta, GA, United States
Single loop coil was optimized in 3D shape to fitting rodent
bran geometry and meet the requirement of simultaneous fMRI and optical imaging,
exhibited significant improvement in overall SNR and signal homogeneity especially
in cortical areas and center brain.
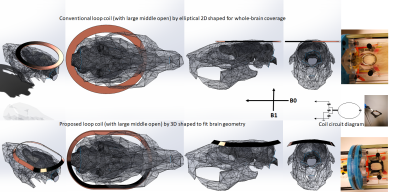
Figure 2. Comparison of
single-loop-coil positioning with rat between the 2D- and 3D-shaped. The 3D-shaped
coil base was 3D printed out that fits better to brain geometry than 2D flat
coil. The gap between coil and skull will be muscle and skin that are not shown
in CAD.
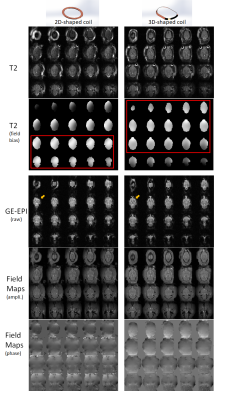
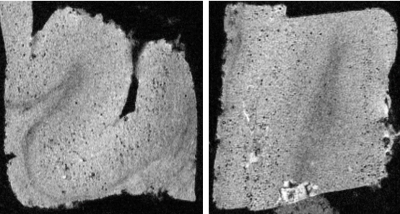
Figure 3. Comparison
of image qualities of rat brain between 2D- and 3D-shaped loop coils. Both have
good whole brain coverage but relatively the 3D-shaped loop that fitted better
to brain geometry exhibits higher SNR and better field homogeneity in T2-weighted
and EPI images and Field maps. The 3D-shaped coil may have more efficient
coverage on most brain areas with nearly uniform field signals based on field
biases from T2 weighted images (good homogeneity highlighted in red frames,
prefrontal difference pointed out in arrows on EPI).
-
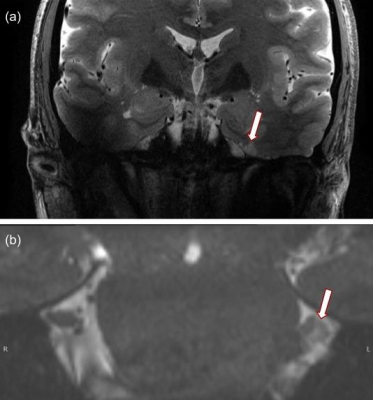
Inductively coupled small-diameter volume coils insertable to the knee coil at 7T for MR microscopy
Tomohisa Okada1, Shinya Handa2, Bill Ding2, Shin-ichi Urayama1, Koji Fujimoto1, Atsushi Shima3, Takashi Ayaki4, Nobukatsu Sawamoto3, Ryosuke Takahashi4, Hirotaka Onoe1, Tadashi Isa1, and Labros Petropoulos2
1Human Brain Research Center, Kyoto University, Kyoto, Japan, 2Quality Electrodynamics, Mayfield Village, OH, United States, 3Department of Human Health Sciences, Kyoto University, Kyoto, Japan, 4Department of Neurology, Kyoto University, Kyoto, Japan
Inductively coupled volume coils that can be inserted to the knee
coil was created. They could fine structures of the specimen using the same
sequence implemented on the whole-body human 7T scanner.
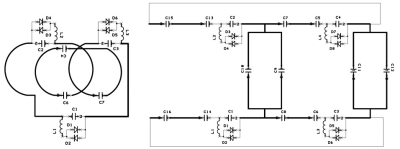
Figure 1. Designs of the coils
(left: 26 mm, right: 64 mm diameters; D26 and D64 coils, respectively).
Figure
3. Brain specimen images of a
Alzheimer’s disease patient using the D26 coil in isotropic 50 μm
resolution (left: axial, right: coronal). Numerous tiny dots were
considered to be
iron-loaded amyloid plaques.
-
A Simple, Multi-purpose Coil for Improved Mouse Brain Image Quality and Coverage at 3-T MRI
Kuan-Hung Cho1, Po-Hsun He1, Hsuan-Han Chiang1, Ming-Jye Chen1, Ezequiel Farrher2, Nadim Jon Shah2,3, Chang-Hoon Choi2, and Li-Wei Kuo1,4
1Institute of Biomedical Engineering and Nanomedicine, National Health Research Institutes, Miaoli County, Taiwan, 2Institute of Neuroscience and Medicine – 4, Forschungszentrum Juelich, Juelich, Germany, 3Department of Neurology, Faculty of Medicine, RWTH Aachen University, Aachen, Germany, 4Institute of Medical Device and Imaging, National Taiwan University College of Medicine, Taipei, Taiwan
A multi-purpose coil arrangement
incorporating a small loop coil and a position-adjustable add-on saddle coil is
proposed to enhance the imaging coverage of anatomical images and improve the
SNR in the regions distant to the surface coil.
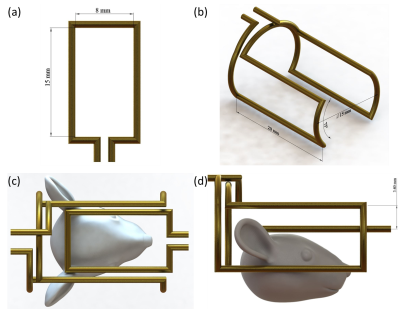
The design of small
surface coil (a), saddle coil (b) and surface coil combined with the saddle coil
(c and d). The diameter of all copper wires is 1 mm.
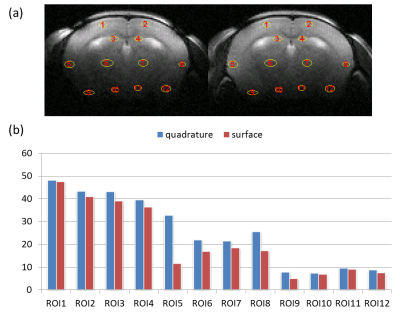
(a) The position of
12 selected ROI overlaid on T2WIs using small surface coil only (left) and proposed
coil (right) respectively. One group of ROIs (1 to 4) is located at regions
close surface coil, another group (5 to 8) is located at regions with middle
distance from surface coil and the other group of ROIs (9 to 12) is at regions
with farthest distance from surface coil. (b) The SNR results from 12 ROIs
using small surface coil only and proposed coil respectively.
-
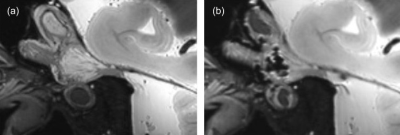
Development of a multi-turn double helix dipole coil for magnetic resonance microimaging of chemically-fixed human embryos at 7T.
Yuto Murakami1 and Yasuhiko Terada1
1University of Tsukuba, Tsukuba, Japan
We proposed a new double helix dipole coil
for high-field MR and constructed it for 7T system, which had nearly twice the
signal-to-noise ratio of a saddle coil. We demonstrated MR microimaging of
human embryo.
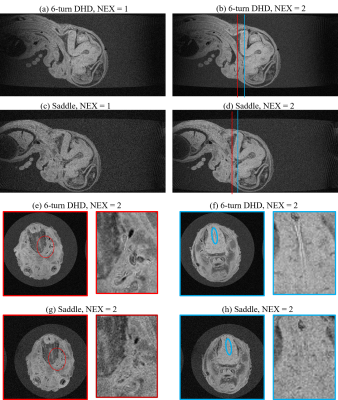
Fig. 5
MR microimaging results of the human embryo acquired with the 6-turn
and saddle coils. (a-d) Sagittal views. (e-h) Axial views. In Figs. (e)-(h),
the magnified images near the trigeminal fibers (red ovals) and the border of
the medulla oblongata (blue ovals) were shown on the right side of the original
images. NEX: number of excitations.
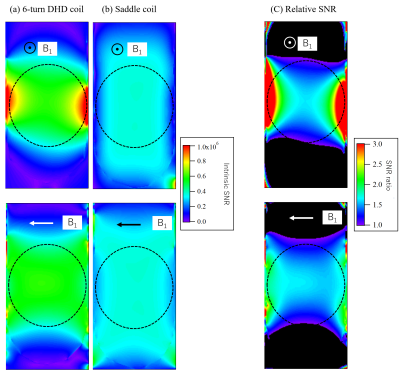
Fig. 3
Simulated SNR maps. (a,b) Intrinsic SNR maps for (a) 6-turn DHD and
(b) saddle coils. (c) Relative SNR of the 6-turn DHD coil with respect to the
saddle coil.
-
Wirelessly controlled stand-alone automatic RF tuning and matching system for preclinical imaging at 7T
Sri Kirthi Kandala1 and SungMin Sohn2
1Biomedical Engineering, Arizona State Universirty, Tempe, AZ, United States, 2Biomedical engineering, Arizona State University, Tempe, AZ, United States
An
automatic RF tuning and matching network was developed. This system is completely
stand-alone with built-in self-triggering and wireless communication. Separate
Tx and Rx coils were used with high power and low power systems respectively.
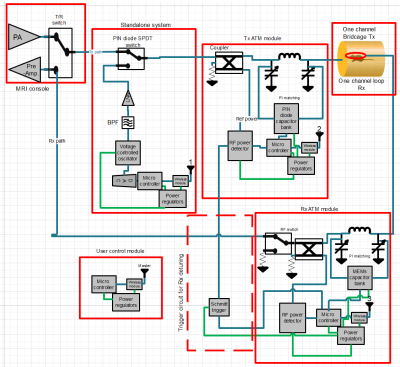
Figure
1: Block diagram of the standalone wireless automatic tuning and matching
system
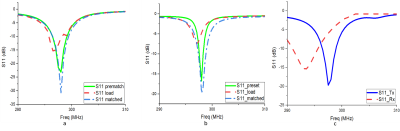
Figure 3: Return
Loss data a) Tx coil b) Rx coil with measured S-parameters c) Rx detuning
during transmit
-
Imaging performance of a multi-channel non-human primate coil
Daniel Papp1, Urs Schüffelgen2, Mo Shahdloo2, Sebastian W Rieger1,3, Aaron T Hess4, Matthew Rushworth2, and Stuart Clare1
1Wellcome Centre for Integrative Neuroimaging, FMRIB, Nuffield Department of Clinical Neurosciences, University of Oxford, Oxford, United Kingdom, 2Wellcome Centre for Integrative Neuroimaging, Department of Experimental Psychology, University of Oxford, Oxford, United Kingdom, 3Wellcome Centre for Integrative Neuroimaging, OHBA, Department of Psychiatry, University of Oxford, Oxford, United Kingdom, 4British Heart Foundation Centre of Research Excellence, Department of Cardiovascular Medicine, University of Oxford, Oxford, United Kingdom
We present the evaluation of a 15ch macaque head coil for awake behaving fMRI. The coil shows marked improvement over our current hardware, and offers highly accelerated imaging capability, up to a combined factor of Multiband 6 and in-plane GRAPPA 2
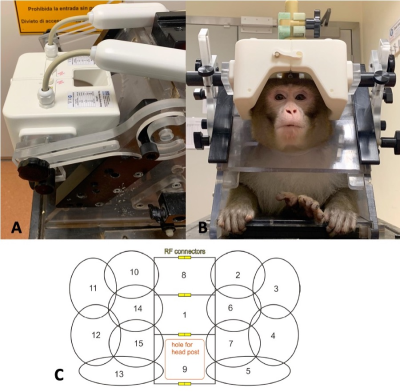
Figure 1: The fit of the bespoke coil and the animal chair (A), a macaque in the coil (B), and a schematic showing the receiver loops (C)
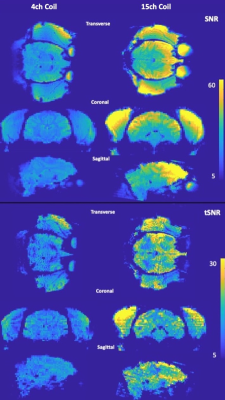
Figure 3: Transverse, coronal and sagittal views of the SNR (first three rows) and tSNR (last three rows) maps of the head for in-vivo scans acquired using the 4-channel flexible coil (first column) and the 15-channel coil (second column). The improvements are most pronounced in the frontal regions, however, a meaningful increase in imaging performance can be observed through the brain. Note that stock reconstruction was used, and the images were not brain extracted.