-
Rapid T1, T2 measurements and SNR evaluation by 31P MR fingerprinting in human brain at 7T
Song-I Lim1,2, Mark Stephan Widmaier1,3, Yun Jiang4, and Lijing Xin1,2
1CIBM Center for Biomedical Imaging, Lausanne, Switzerland, 2Animal Imaging and Technology, EPFL, Lausanne, Switzerland, 3Laboratory for Functional and Metabolic Imaging, EPFL,, Lausanne, Switzerland, 4Department of Radiology, University of Michigan, Ann Arbor, MI, United States
This study shows the feasibility of rapid multiparametric measurement in vivo using 31P MRS fingerprinting scheme.
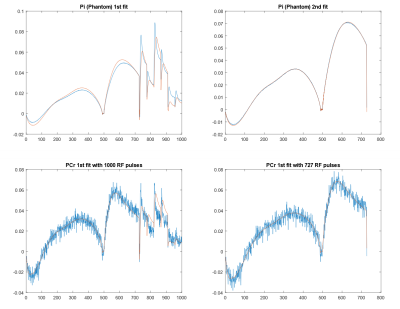
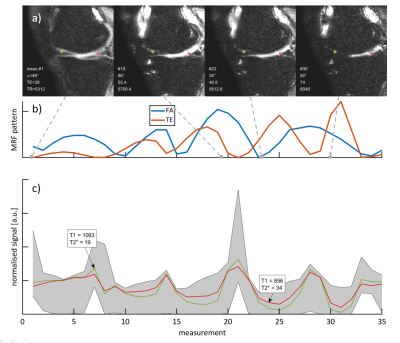
Figure 2 shows the representative MRF fitting using phantom and in vivo experiment.
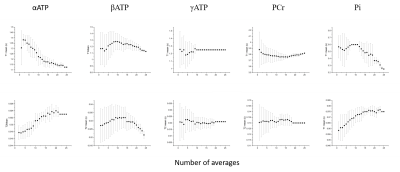
Figure 3 SNR evaluation for 5 measured metabolites in MRS-FP experiment. Scanning time can be shortened up to 2min without compensation of measurement reliability
-
Development of a Clinical CEST-MR Fingerprinting (CEST-MRF) Pulse Sequence and Reconstruction Methods
Ouri Cohen1, Or Perlman2, Christian T Farrar2, and Ricardo Otazo1
1Memorial Sloan Kettering Cancer Center, New York, NY, United States, 2Radiology, Massachusetts General Hospital, Charlestown, MA, United States
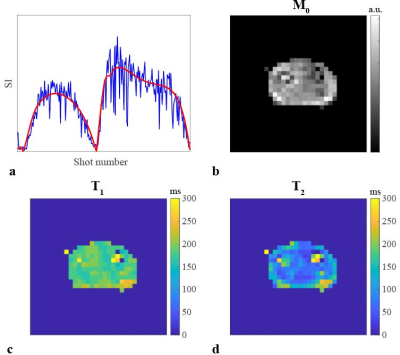
A clinical CEST MR Fingerprinting pulse sequence is shown to simultaneously yield multiple accurate tissue parameter maps in a short scan time.

Figure
3: Reconstructed water relaxation (T1w, T2w), amide exchange rate (Ksw) and
volume fraction (fs) and semi-solid exchange rate (Kssw) and volume fractions
(fss) from an in vivo healthy subject imaged with the clinical CEST-MRF pulse
sequence.
Figure
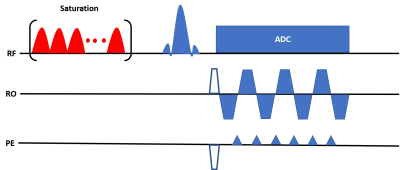
1: Pulse sequence diagram for the proposed MRF-CEST sequence for one time step.
A gaussian-shaped pulse train saturates the amide proton which then exchange
with the water protons. The reduction in the water signal is measured with an
EPI readout
-
Vascular fingerprinting using DSC MRI for quantification of microvasculature in glioma
Krishnapriya Venugopal1, Esther A.H Warnert1, Daniëlle van Dorth2, Marion Smits1, Juan Antonio Hernandez Tamames1, Matthias J.P van Osch2, and Dirk H.J Poot1
1Radiology and Nuclear Medicine, Erasmus MC, Rotterdam, Netherlands, 2Radiology, Leiden University Medical Center, Leiden, Netherlands
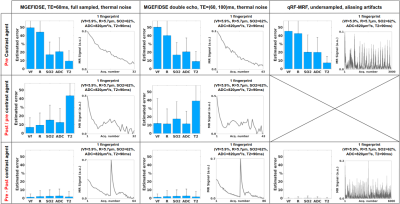
Dictionaries were simulated for
DSC-MRI time courses with GRE and SE read-out. The fingerprints from
in-vivo healthy and glioma data were matched and resulted in estimations of
cerebral blood volume, vessel radius and permeability.
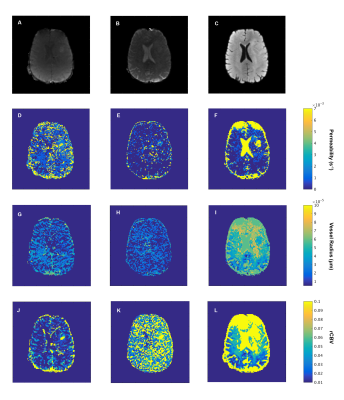
Figure 3. GRE
(A) and SE (B) images from HEPI and T2 FLAIR (C) as reference of the patient
brain acquired on the same scanner. D, E, F are the permeability maps, G, H, I
are the vessel radius maps and J, K, L are the rCBV maps in the GRE (D, G, J),
SE (E,H,K) and combined GRE-SE (F, I, L) images.
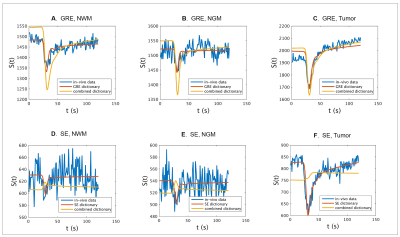
Figure 4.
Comparison of signals from voxels in NWM, NGM and tumor tissues from GRE (A,B,C
respectively) and SE (D,E,F, respectively) images with the signals obtained
from the individual GRE and SE dictionary atoms ( red ) and that from the
respective GRE and SE of the combined dictionary atoms ( yellow ) with maximum
correlation
-
Noise Considerations for Accelerated MR Vascular Fingerprinting
Gregory J. Wheeler1 and Audrey P. Fan1,2
1Biomedical Engineering, University of California Davis, Davis, CA, United States, 2Neurology, University of California Davis, Davis, CA, United States
Accelerating acquisition for MR vascular fingerprinting will enable
dynamic quantitative vascular parameter mapping and new investigations of
vascular diseases. This simulation study investigated SNR, time resolution, and
mapping accuracy tradeoffs that will arise from acceleration.
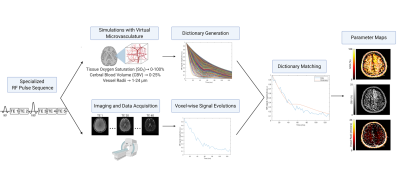
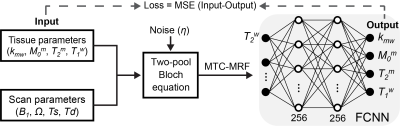
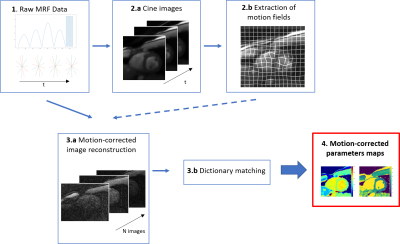
Figure 1. Overview of the MR vascular
fingerprinting technique. A pulse sequence sensitive to the vascular parameters
of interest is utilized for both imaging and MR physics simulations. Physiological
ranges of SO2, CBV, and vessel radii
are used to simulate the MR signal in a virtual voxel with each combination of
those parameters. After the images are acquired, the time-course signal
evolution of each voxel is compared to all dictionary entries. The closest
match between the fingerprint and dictionary allows for the extraction of the underlying
parameters for quantitative mapping.
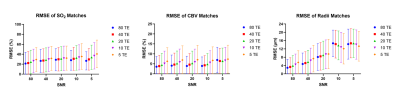
Figure 5. Mean RMSE of vascular parameters predicted from matching
algorithm and the signals true underlying parameter values at five SNRs and
with five echo train lengths. The RMSE for each parameter was calculated by
taking 10 random parameter combinations and finding the RMSE at each SNR/TE
combination. This was repeated 1000 times resulting in 10,000 total RMSE values
for each SNR/TE combination tested. The means and standard deviations were calculated
and plotted as the dots and error bars in the graphs.
-
5-Minute MR Fingerprinting from Acquisition to Reconstruction for Whole-Brain Coverage with Isotropic Submillimeter Resolution
Yilin Liu1, Yong Chen2, and Pew-thian Yap1
1University of North Carolina at Chapel Hill, Chapel Hill, NC, United States, 2Case Western Reserve University, Cleveland, OH, United States
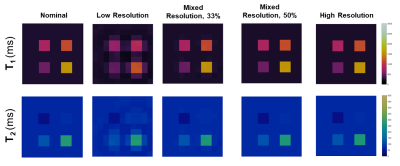
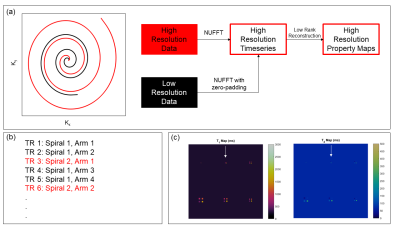
We develop a 3D MRF sequence coupled with a novel end-to-end deep learning image reconstruction framework for rapid and simultaneous whole-brain quantification of T1 and T2 relaxation times with isotropic submillimeter spatial resolution.
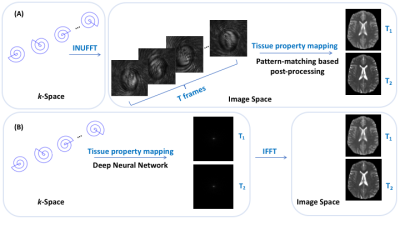
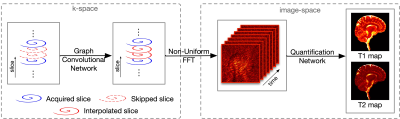
Fig 1. (A) The original MRF framework. (B) Our approach.
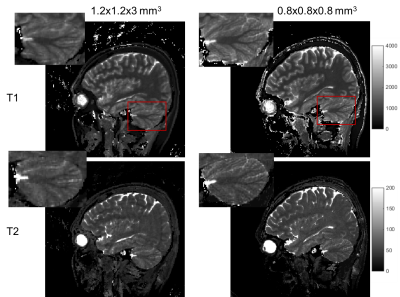
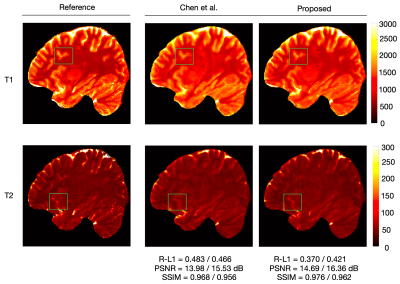
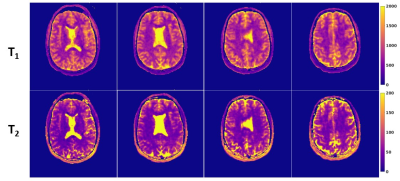
Fig 2. Low-resolution (left) and high-resolution (right) T1 and T2 maps of the same subject.
-
Differentiation of Peritumoral White Matter in Glioblastomas and Metastases using Magnetic Resonance Fingerprinting
Charit Tippareddy1, Walter Zhao2, Andrew Sloan3,4, Jeffrey Sunshine5, Jill Barnholtz-Sloan6, Mark Griswold2,5, Dan Ma2,5, and Chaitra Badve5
1Case Western Reserve University School of Medicine, Cleveland, OH, United States, 2Department of Biomedical Engineering, Case Western Reserve University, Cleveland, OH, United States, 3Departments of Neurosurgery and Pathology, University Hospitals Cleveland Medical Center, Cleveland, OH, United States, 4Seidman Cancer Center and Case Comprehensive Cancer Center, Cleveland, OH, United States, 5Department of Radiology, University Hospitals Cleveland Medical Center, Cleveland, OH, United States, 6Department of Population and Quantitative Health Sciences, University Hospitals Cleveland Medical Center, Cleveland, OH, United States
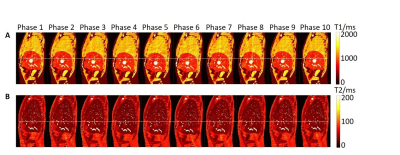
Post contrast MRF T1, T2 maps allow quantitative
characterization of NET region in GBMs and METs. MRF-radiomics signatures can
differentiate NET regions of GBMs from METS and demonstrate unique differences
between near (within 1 cm of enhancing tumor) and far (beyond 1 cm) NET regions.
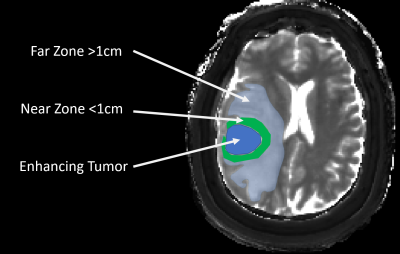
Zone analysis demonstrated on MRF T1 map in a right temporal GBM
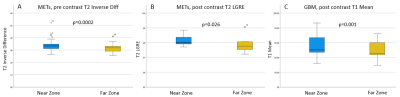
Boxplots of significant pre and post contrast
texture
features from NET
regions showing
near vs far zones in METs and GBMs
-
Exploring cyto-architecture of Brodmann areas with High-resolution 3D MR Fingerprinting
Joon Yul Yul Choi1, Siyuan Hu2, Ting-yu Su1,2, Yingying Tang1, Ken Sakaie3, Ingmar Blümcke1,4, Imad Najm1, Stephen Jones3, Mark Griswold5, Dan Ma2, and Zhong Irene Wang1
1Epilepsy Center, Neurological Institue, Cleveland Clinic, Cleveland, OH, United States, 2Biomedical Engineering, Case Western Reserve University, Cleveland, OH, United States, 3Imaging Institute, Cleveland Clinic, Cleveland, OH, United States, 4Neuropathology, University of Erlangen, Erlangen, Germany, 5Radiology, Case Western Reserve University, Cleveland, OH, United States
We
investigate T1 and T2 values in Brodmann areas of the normal brain using 3D magnetic
resonance fingerprinting. Our results demonstrate the sensitivity of
multi-parametric MRF results at 3T to differentiate cortical regions with different
cyto- or myelo-architecture.
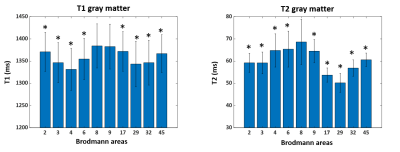
Figure 2. Mean and
standard deviation of MRF T1 and T2 values of gray matter in selected Brodmann
areas. Paired t-test was performed between Brodmann areas 8 and the other
areas. p* < 0.05
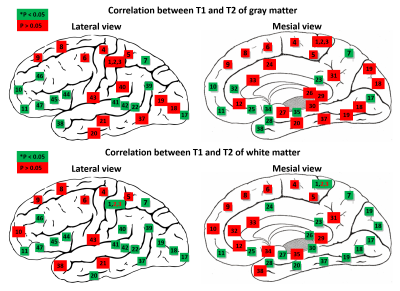
Figure 5.
Correlation analyses between T1 and T2. Spearman’s correlation analysis was
performed in each BA. Green: p* < 0.05, red: p > 0.05
-
Human cerebral cortex parcellation using time-fractional order magnetic resonance fingerprinting (MRF)
Shahrzad Moinian1,2, David Reutens1,2, and Viktor Vegh1,2
1Centre for Advanced Imaging, The University of Queensland, Brisbane, Australia, 2ARC Training Centre for Innovation in Biomedical Imaging Technology, The University of Queensland, Brisbane, Australia
The additional parameters of the extended time-fractional
order Bloch equations improve MRF dictionary fitting accuracy. Anomalous
relaxation models may be used to derive additional information useful for more accurate
parcellation of the cerebral cortex in individuals.
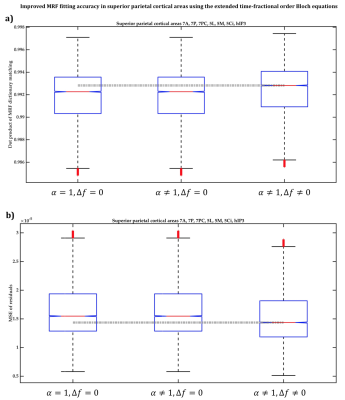
Figure 3 MRF dictionary matching accuracy between
classical monoexponential Bloch equations (left box), Magin et al model (middle
box), and extended Bloch equations (right box) in cortical aeras 7A, 7P, 7PC,
5L, 5M, 5Ci, and hIP3 was compared using a) dot product of the actual and best
matching MRF signals, and b) mean squared error of MRF residuals. Note that
outliers more than three median absolute deviations (MAD) are removed.
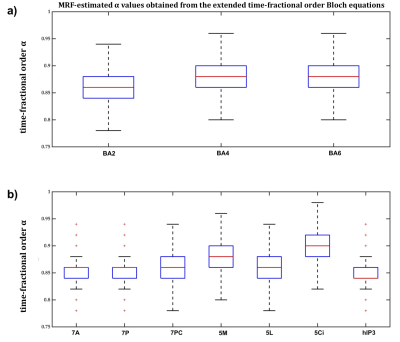
Figure 4 Distribution of time-fractional order
parameter α values was compared across ten cortical areas
of interest; a) areas 2, 4, and 6, b) areas 7A, 7P, 7PC, 5M, 5L, 5Ci, and hIP3.
-
Validity and repeatability of MRF in glioma and normal appearing contralateral brain tissue at 3T
Simran Kukran1,2, Joely Smith3,4, Luke Dixon1,3, Ben Statton5, Sarah Cardona3, Lillie Pakzad-Shahabi6,7, Matthew Williams6,8, Dow-Mu Koh2,9, Rebecca Quest3,4, Matthew Orton2, and Matthew Grech-Sollars1,3
1Department of Surgery and Cancer, Imperial College London, London, United Kingdom, 2Department of Radiotherapy and Imaging, Institute of Cancer Research, London, United Kingdom, 3Department of Imaging, Imperial College Healthcare NHS Trust, London, United Kingdom, 4Department of Bioengineering, Imperial College London, London, United Kingdom, 5Medical Research Council, London Institute of Medical Sciences, Imperial College London, London, United Kingdom, 6Computational Oncology group, Institute for Global Health Innovation, Imperial College London, London, United Kingdom, 7John Fulcher Neuro-oncology Laboratory, Department of Brain Sciences, Imperial College London, London, United Kingdom, 8Radiotherapy Department, Charing Cross Hospital, London, United Kingdom, 9Department of Radiology, Royal Marsden Hospital, London, United Kingdom
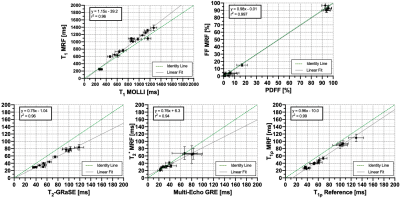
MRF was found to give highly repeatable T1 and T2 measurements that were strongly and significantly correlated to measurements from established mapping techniques in both tumour and normal appearing contralateral brain tissue of glioma patients.
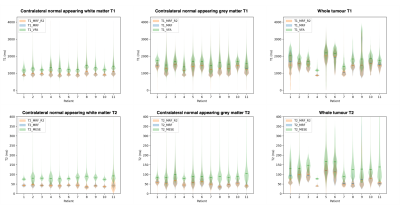
Violin plots with medians for T1 and T2 values of NAC GM, NAC WM, and tumour regions from repeated MRF and established T1 VFA and T2 MESE relaxometry. MRF repeat violins (red/blue) are almost indistinguishable, indicating MRF measurements are highly repeatable. MRF values are consistently lower than established techniques (green).
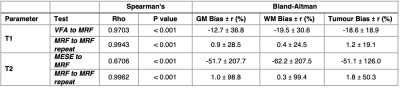
Table 2: Summary of Spearman’s Rho correlation testing and Bland-Altman statistics for: VFA vs. MRF T1, MESE vs. MRF T2 and repeated MRF measurements of both T1 and T2.
-
In vivo repeatability of Tailored MR Fingerprinting
pavan Poojar1,2, Enlin Qian1, and Sairam Geethanath 1,2
1Columbia Magnetic Resonance Research Center, Columbia University, New York, NY, United States, 2Dayananda Sagar College of Engineering, Bangalore, India
The narrow SNR range of 0.1 to 0.75 for white matter and 0.2 to 1.1 for grey matter shows that TMRF is repeatable. TMRF provides six contrasts and two maps in approximately 4 mins.
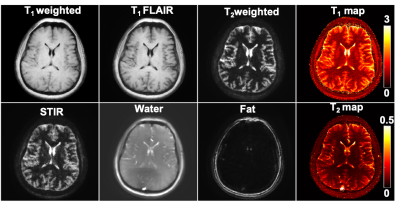
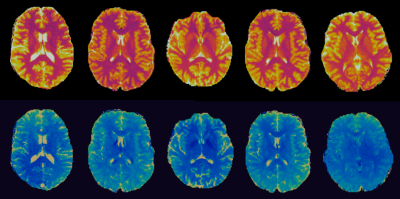
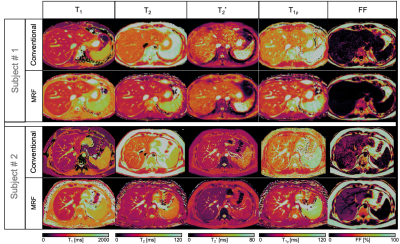
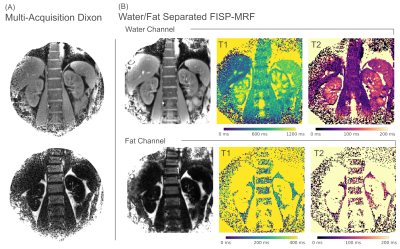
Figure 1: Representative images acquired using
tailored magnetic resonance fingerprinting (TMRF) which provides qualitative
and quantitative data simultaneously within ~4 minutes. This includes T1 weighted,
T1 fluid
attenuated inversion recovery (T1 FLAIR), T2 weighted, short tau inversion
recovery (STIR), water
and fat images. Quantitative
data include T1 and T2 maps. All images were acquired on in
vivo healthy
human brain on a
3T GE 750w scanner.
The reconstructed qualitative images were denoised using DL. The maps were generated
using DRONE method.
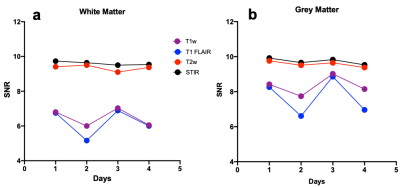
Figure 3: Signal to noise ratio (SNR) for the
four contrasts
(T1 weighted, T1 fluid attenuated inversion recovery (T1 FLAIR), T2
weighted, and
short tau
inversion recovery (STIR))
over a period of 4 days. All scans were performed on same in vivo
healthy human subject on a
3T GE 750w scanner.
The white matter (WM) and grey matter (GM) was segmented semi automatically using
3D slicer to get the (a) WM SNR and (b) GM SNR where different color
represents different contrasts. The SNRs were similar for all the four days.
-
Reproducibility of 3D MR Fingerprinting with Different Dictionary Resolution in the Healthy Human Brain
Krishna Pandu Wicaksono1, Yasutaka Fushimi1, Satoshi Nakajima1, Akihiko Sakata1, Takuya Hinoda1, Sonoko Oshima1, Sayo Otani1, Hiroshi Tagawa1, Yang Wang1, Tomohisa Okada1, and Yuji Nakamoto1
1Kyoto University, Graduate School of Medicine, Kyoto, Japan
This study showed comparable in-vivo reproducibility
of 3D MRF reconstructed using two different dictionary resolutions in most
brain parenchyma. Yet, lower reproducibility was evident in CSF measurement, notably
in a higher resolution dictionary.
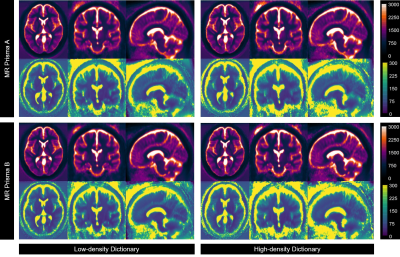
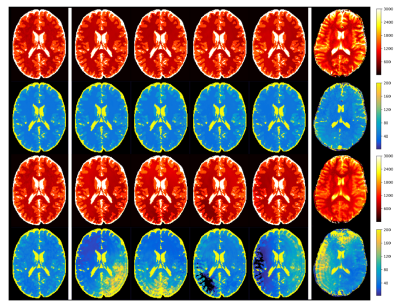
Figure 2. A comparison
of average DARTEL-normalized T1 and T2 maps of all healthy volunteers
reconstructed by using low-density and high-density dictionaries. Consistencies
were evident in most brain parenchyma.
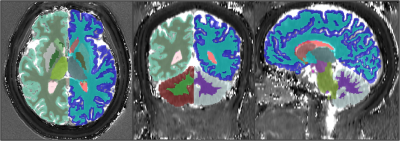
Figure 1. Example of T1 map overlaid with the volume of
interests selected from Freesurfer’s segmentation results.
-
Multi-compartment MR Fingerprinting: an off-the-grid approach
Mohammad Golbabaee1 and Clarice Poon1
1University of Bath, Bath, United Kingdom
We introduce a novel off-the-grid sparse approximation algorithm for multicompartment MRF. The proposed algorithm is an accurate and importantly a scalable alternative to the multicompartment MRF baselines because it does not rely on fine-gridded multiparametric MRF dictionaries.
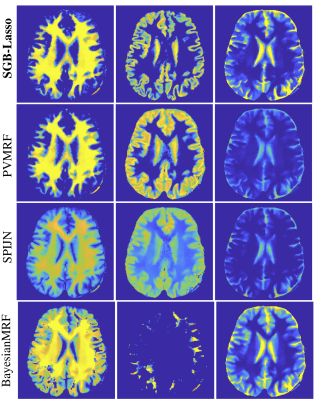
Mixture maps (margins cropped) of the WM, GM and a CSF related compartments for the in-vivo brain using different MC-MRF algorithms.
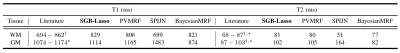
Estimated T1/T2 values (milliseconds) for in-vivo WM, GM compartments using MC-MRF algorithms compared to the 1.5T literature values in [11]* and [12]+.
-
Estimating tissue volume fractions and proton density in multi-component MRF
Martijn A. Nagtegaal1, Laura Nunez Gonzalez2, Dirk H.J. Poot2, Matthias J.P. van Osch3, Jeroen H.J.M. de Bresser4, Juan A. Hernandez Tamames1,2, and Frans M. Vos1,2
1Department of Imaging Physics, Delft University of Technology, Delft, Netherlands, 2Department of Radiology and Nuclear Medicine, Erasmus MC, Rotterdam, Netherlands, 3C.J. Gorter Center for high field MRI, Department of Radiology, Leiden University Medical Center, Leiden, Netherlands, 4Department of Radiology, Leiden University Medical Center, Leiden, Netherlands
Obtaining tissue volume fractions from multi-component MRF
data requires accurate estimation of proton density values. An effective method
to estimate these PD values is proposed and tested in simulations and in-vivo.
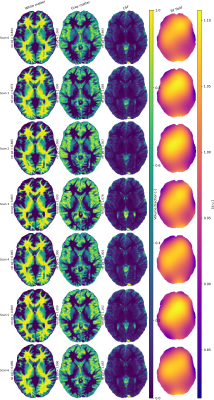
Figure 4 Estimated volume fraction maps and RF
fields for one subject scanned 7 times. The subject was repositioned after
every scan, possibly resulting in slightly different slice locations, volume
estimations and $$$B_1^-$$$ field estimations, although visual differences are minimal this hindered quantitative comparison on a voxel basis. Low rank reconstruction(rank 6) was
used, in subsequent SPIJN processing
$$$\mu=0.2$$$ was applied. Tissues were identified based on relaxation
times. The acquitisition scheme from [4] was used.
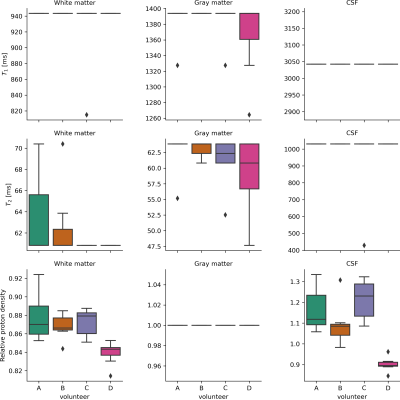
Figure 3 Boxplots of estimated $$$T_1$$$, $$$T_2$$$
and relative proton densities over 7 scans per
subject. $$$T_1$$$ and $$$T_2$$$ values show descrete estimations due to the
used dictionary grid (5% relative step size). Proton densities were calculated relative to gray matter.
Literature values for WM relative to GM are between 84% and 90%, for CSF 116%
and 128%. Relaxation times for WM are consistent with literature[15], GM shows slightly lower times than expected, potentially caused by
partial volume effects in GM areas.
-
3D Ultrashort Echo Time MR Fingerprinting (3D UTE-MRF) for Whole Brain Myelin Imaging
Zihan Zhou1, Qing Li1,2, Congyu Liao3, Xiaozhi Cao3, Ting Gong1, Qiuping Ding1, Hongjian He1, and Jianhui Zhong1,4
1Center for Brain Imaging Science and Technology, College of Biomedical Engineering and Instrumental Science, Zhejiang University, Hangzhou, China, 2MR Collaboration, Siemens Healthcare Ltd, Shanghai, China, 3Radiological Sciences Laboratory, Stanford University, Stanford, CA, United States, 4Department of Imaging Sciences, University of Rochester, Rochester, NY, United States
3D Ultrashort Echo Time MR Fingerprinting (UTE-MRF) sequence
can achieve whole brain myelin mapping in 15 min with 0.87 mm isotropic
resolution.
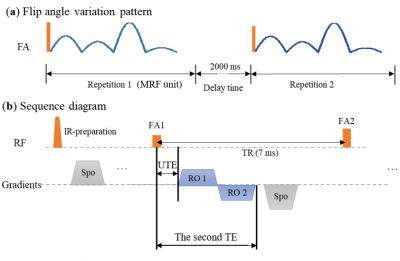
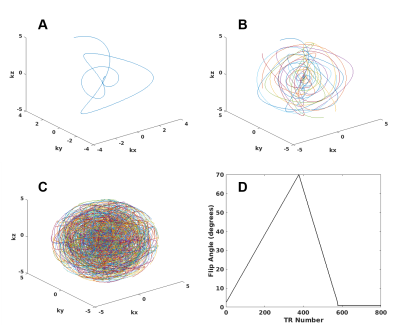
Fig. 1. 3D UTE-MRF sequence diagram 5. (a) shows the pattern of flip angles in an MRF unit. It varies among every TR. A delay time of 2000 ms between two repetitions is used. (b) shows the sequence during a TR. UTE is the first (ultrashort) echo time.
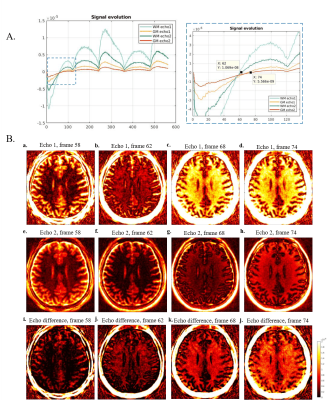
Fig. 3. 3D UTE-MRF dual echo results of a healthy volunteer (Subject 1). A: Real part of the signal curves in both WM and GM for the dual-echo images. Frame 62 is chosen as the optimum frame for myelin imaging. B: Different frame images for different contrast. (a-d) are echo 1 from frame 58, 62, 68 and 74. (e-f) are echo 2 from frame 58, 62, 68, and 74. (i-l) are echo difference from frame 58, 62, 68, and 74. (j) shows that at frame 62, the long T2 tissue is suppressed.
-
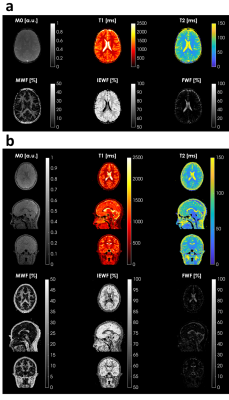
High-resolution myelin-water fraction (MWF) and T1/T2/proton-density mapping using 3D ViSTa-MR fingerprinting with subspace reconstruction
Congyu Liao1, Xiaozhi Cao1, Ting Gong2, Zhe Wu3, Zihan Zhou2, Hongjian He2, Jianhui Zhong2,4, and Kawin Setsompop1
1Radiological Sciences Laboratory, Stanford University, Stanford, CA, United States, 2Center for Brain Imaging Science and Technology, College of Biomedical Engineering & Instrument Science, Zhejiang University, Hangzhou, China, 3Techna Institute, University Health Network, Toronto, ON, Canada, 4Department of Imaging Sciences, University of Rochester, Rochester, NY, United States
We developed a 3D ViSTa-MRF sequence with subspace
reconstruction, to achieve whole-brain myelin-water fraction (MWF) and T1/T2/PD
mapping at 1mm isotropic resolution in 10 minutes. The proposed method can
provide fast parametric mapping with high SNR and good image quality.
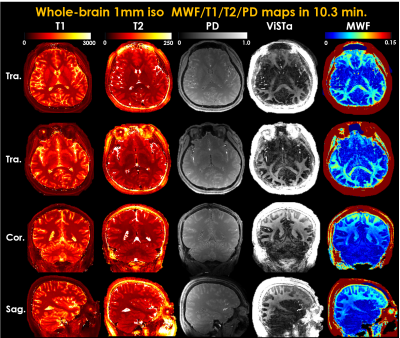
Whole-brain 1mm iso
T1/T2/PD/ViSTa and MWF maps in three orthogonal views.
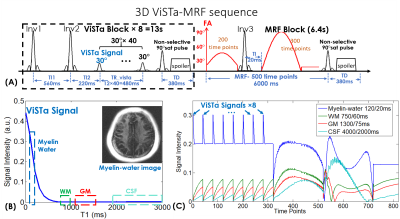
Figure 1. (A) Sequence diagram of 3D ViSTA-MRF.
(B) extended phase graph (EPG) simulation of the first ViSTa signal. The myelin-water signal with short-T1
is preserved in the ViSTa signal while the white-matter (WM), gray-matter (GM)
and CSF are suppressed, which enables direct myelin-water imaging. (C)Simulated
signal curves of myelin-water, WM, GM and CSF for the ViSTa-MRF sequence. FA: flip angle.
-
High Accuracy Numerical Methods for Solving Magnetic Resonance Imaging Equations and Optimizing RF Pulse Sequences
Cem Gultekin1, Jakob Assländer2, and Carlos Fernandez-Granda3
1Mathematics, Courant Institute of Mathematical Science, New York, NY, United States, 2Radiology, New York University Grossman School of Medicine, New York, NY, United States, 3Mathematics and Data Science, Courant Institute of Mathematical Science and Center for Data Science New York University, New York, NY, United States
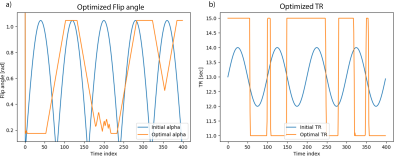
We present an adaptive Petrov-Galerkin(PG) solver applicable to many MRI typical ordinary differential equations. We apply the technique to solve an optimization
problem for pulse design. Our method reduces the
time required to compute the gradients by three orders of magnitude.
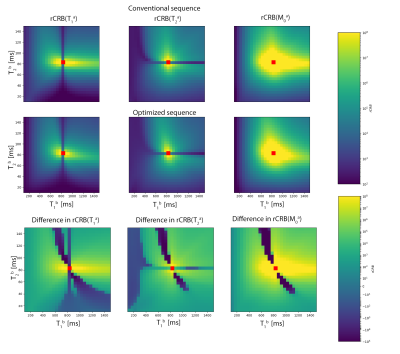
Optimization result acquired with PG on
Hybrid-State model. Targeted relative CRB values after minimization
rCRB(m0s)=1.1 · 10^5, rCRB(T1)=2.0 · 104 and rCRB(T2f)=3.26 ·104.
Biophysical parameters included in the CRB computation are proton
density=1, m0s=0.1, T1=1.6 sec, T2f=65 msec, R=30, T2s=60 µsec, B0 and B1. Relative CRB is defined as rCRB(T1)=CRB(T1)Texp/TRT12
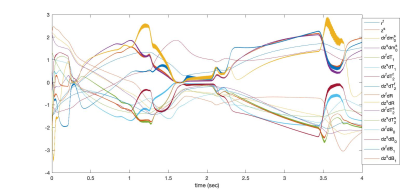
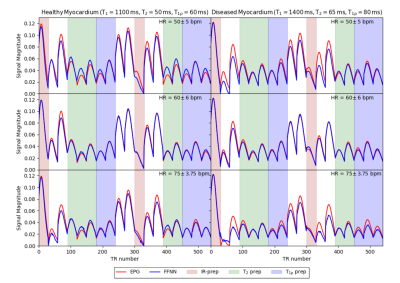
Hybrid-State equations solved by PG for cycle of 4 seconds. Each signal is normalized by its mean magnitude for visualization. The oscillations are aligned with RF pulses. Representation of such a signal by piece-wise polynomials needs higher orders which quickly blows up the number of unknowns to solve the BVP. PG can increase order of accuracy without increasing the number of unknowns by putting more effort to locally defined simple problems.
-
Myelin Water Imaging in the Hybrid State
Andrew Mao1,2,3, Sebastian Flassbeck1,2, Cem Gultekin4, Xiaoxia Zhang1,2, and Jakob Asslaender1,2
1Center for Biomedical Imaging, Department of Radiology, New York University School of Medicine, New York, NY, United States, 2Center for Advanced Imaging Innovation and Research, New York University School of Medicine, New York, NY, United States, 3Vilcek Institute of Graduate Biomedical Sciences, New York University School of Medicine, New York, NY, United States, 4Courant Institute of Mathematical Sciences, New York University, New York, NY, United States
We optimize an MR fingerprinting sequence for SNR efficiency using hybrid-state theory, and apply it in vivo demonstrating simultaneous quantification of myelin water fraction, T1 and T2 of axonal/extra-axonal water in the full brain with high spatial resolution with a 14 minute scan.
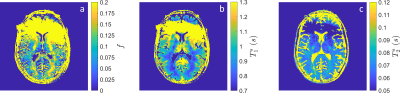
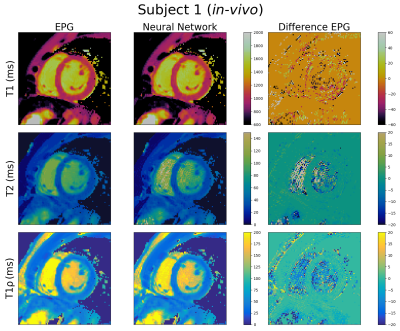
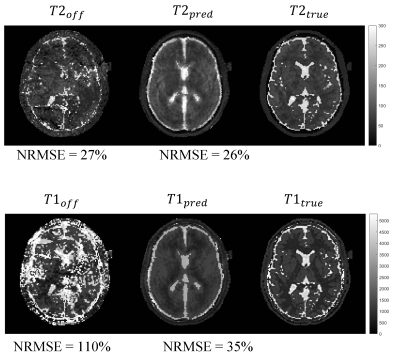
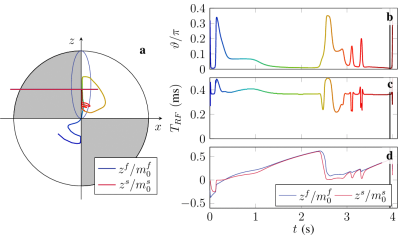
Figure 4: In vivo quantitative maps of (a) $$$f$$$, (b) $$$T_1^s$$$ and (c) $$$T_2^s$$$ from a single axial slice through the brain at the level of the lateral ventricles. The fast compartment ($$$T_1^f$$$ and $$$T_2^f$$$) was fixed to literature values for the fitting process. Note that the anterior brain is corrupted by $$$B_0$$$ artifact arising from metal in the volunteer's face mask.
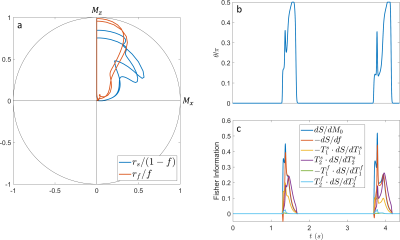
Figure 2: (a) Spin dynamics of the slow (blue) and fast (red) compartment on the Bloch sphere. Note that the magnetization of each compartment is normalized by their respective fractions for visual clarity. (b) Numerically optimized $$$\vartheta$$$ pattern over time. (c) Fisher information over time. The optimized sequence prefers two distinct information dense periods per $$$T_{cyc}$$$.
-
A faster and improved tailored Magnetic Resonance Fingerprinting
Pavan Poojar1,2, Enlin Qian1, and Sairam Geethanath 1,2
1Columbia Magnetic Resonance Research Center, Columbia University, New York, NY, United States, 2Dayananda Sagar College of Engineering, Bangalore, India
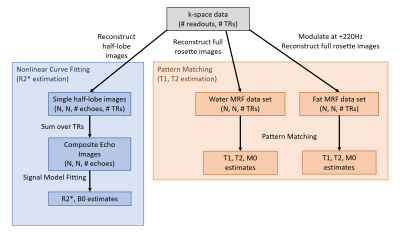
We improved our tailored MRF implementation by adding two contrasts (water and fat), reducing scan time by 25% (from 5:27(min:sec) to 4:07(min:sec)) and reducing reconstruction time (from ~40mins to ~3mins). TMRF SNR and contrast was better than MRF.
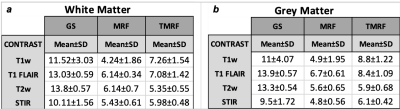
Table
2: Mean
and standard deviation (SD) of signal to noise ratio (SNR) for (a)
white matter
(WM)
and (b) grey matter (GM). The SNR was calculated for all the three methods –
GS, MRF and TMRF (columns) and for all the four contrasts (rows). Initially, WM
and GM were segmented and then SNR was calculated using 3D slicer software. SNR
was measured using “difference image” method, where the same brain images were
acquired twice with identical conditions. The SNR for GS>TMRF>MRF for WM
and GM for all the contrasts.
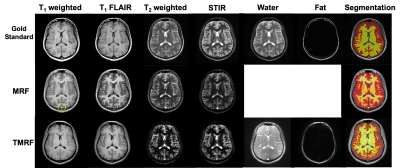
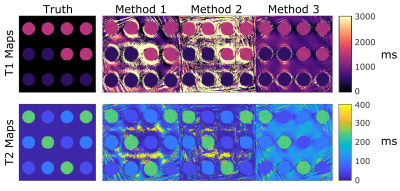
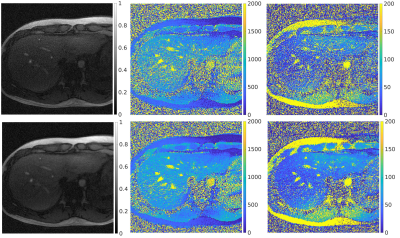
Figure 1: Qualitative
healthy brain images obtained using gold standard method (first row), magnetic
resonance fingerprinting (MRF) (second
row) and tailored
MRF
(TMRF) (third
row).
The color
axis bar for each image is different. Each
column
represents different contrasts along
with the representative grey matter and white matter segmentation (last column)
using 3D slicer. Images obtained using MRF method were synthetically generated
and have flow artifacts as shown in the yellow circle.
-
Iterative MR Fingerprinting Reconstruction in a Compressed k-space
Di Cui1, Edward S. Hui2, and Peng Cao1
1Diagnostic Radiology, The University of Hong Kong, Hong Kong, China, 2Rehabilitation Science, The Hong Kong Polytechnic University, Hong Kong, China
A k-space compression
strategy is proposed in a 3D alternating direction method of multipliers (ADMM)
framework in this study, with data and image series compressed, and
intermediate computation simplified.
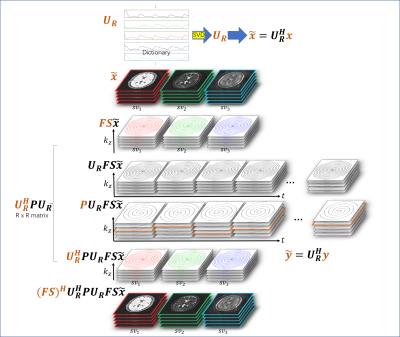
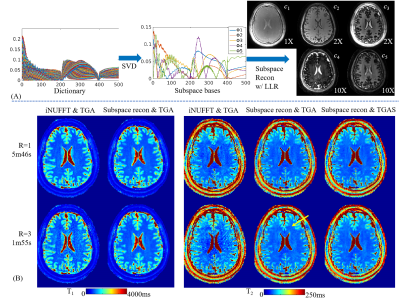
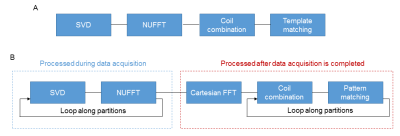
(top) We
utilize a singular value decomposition (SVD) based k-space compression method. Image
series $$$x$$$ can be compressed with SVD. (bottom) in the iterative
reconstruction, the undersampling mask $$$P$$$ is replaced by $$$U_R^H P U_R $$$ with a size of R times R for a compressed
k-space, instead of computing vary large data matrices. Therefore, the iterative
reconstruction is performed on a compressed k-space.
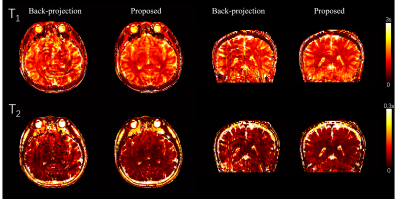
3D
in vivo result, acquired using a stack of spiral MRF. Severe artifacts resisted
in the backprojection method, while they were effectively reduced with the
proposed method.
-
MR Fingerprinting Reconstruction based on Structured Low-rank Approximation and Subspace Modeling
Peng Li1 and Yue Hu1
1Harbin Institute of Technology, Harbin, China
MR Fingerprinting Reconstruction based on
Structured Low-rank Approximation and Subspace Modeling.
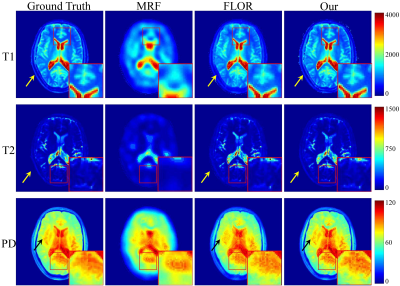
Fig.2 Reconstructed maps of T1, T2 and PD, using the 5% sampled noiseless data. The acquisition length is $$$L=400$$$.
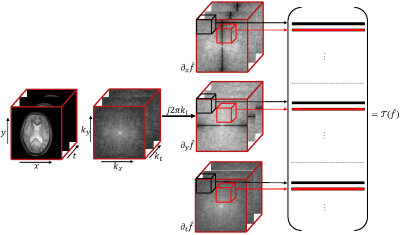
Fig.1 Illustration of the structure of the lifted matrix $$${\cal T}(\mathbf{x})$$$: The rows of the matrix are 3-D neighborhoods of the gradient-weighted $$$k$$$-space samples.