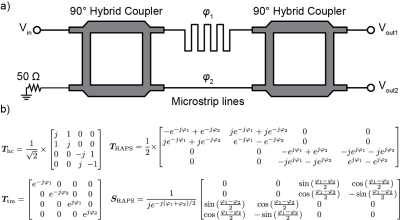
-
Exploration of the Surgical Placement of the Local Pituitary Coil for Microadenomas
Jiahao Lin1,2, Siyuan Liu2, Rock Hadley3, Marvin Bergsneider4, Giyarpuram N Prashant4, Sophie Peeters4, Robert Candler2,5, and Kyunghyun Sung1
1Department of Radiological Sciences, David Geffen School of Medicine, University of California, Los Angeles, LOS ANGELES, CA, United States, 2Department of Electrical and Computer Engineering, University of California, Los Angeles, LOS ANGELES, CA, United States, 3Department of Radiology, University of Utah, Salt Lake City, UT, United States, 4Department of Neurosurgery, University of California, Los Angeles, LOS ANGELES, CA, United States, 5California NanoSystems Institute, Los Angeles, CA, United States
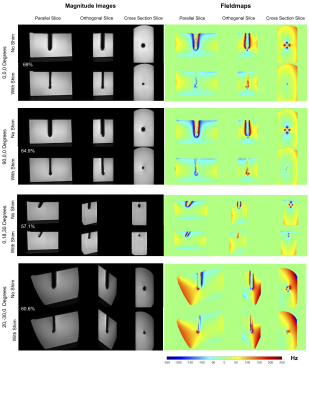
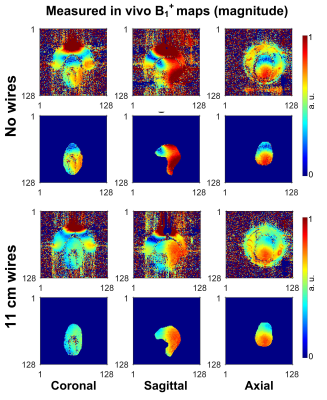
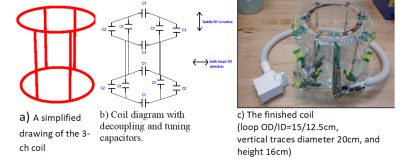
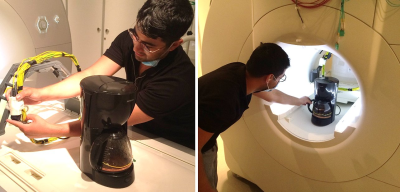
We construct an agar phantom to examine the SNR variation as the coil plane rotates from 0° to 90°, respect to B0. Our local pituitary coil has improved SNR with a factor, ranged from 3.3 to 4.2, compared to the commercial Siemens head coil as long as the positioning of the coil to be within 0° and 70°.
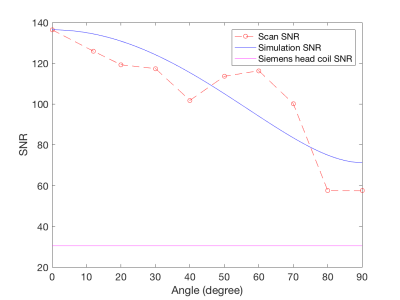
Figure 5, Local pituitary coil and Siemens head coil combined SNR, versus simulation SNR. Siemens commercial head coil SNR is not affected by the local coil angle.
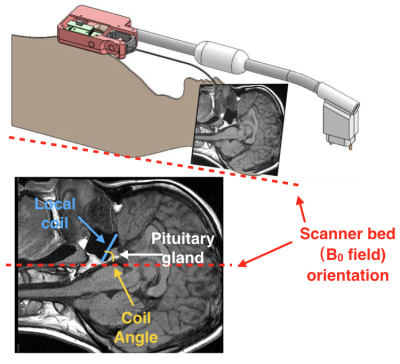
Figure 1, local pituitary coil placement against pituitary gland, and the illustration coil angle with respect to the scanner bed (B0 field).
-
Toward automatic lesion transmurality assessment using machine learning: a proof of concept in preclinical EP studies under MRI-guidance
Valéry Ozenne1,2,3,4, Pierre Bour2,3,4, Marylène Delcey2,3,4, Nicolas Cedilnik5, Maxime Sermesant5, and Bruno Quesson2,3,4
1Centre de Résonance Magnétique des Systèmes Biologiques, UMR 5536, CNRS, Bordeaux, France, 2IHU Liryc, Electrophysiology and Heart Modeling Institute, Fondation Bordeaux Université, Bordeaux, France, 3Univ. Bordeaux, Centre de recherche Cardio-Thoracique de Bordeaux, U1045, Bordeaux, France, 4INSERM, Centre de recherche Cardio-Thoracique de Bordeaux, U1045, Bordeaux, France, 5Université Côte d’Azur, Inria, Epione, Sophia Antipolis, France
The purpose of this work is to evaluate the feasibility of automatic
in-line segmentation in routine preclinical EP
studies with applications for roadmap segmentation and lesion transmurality assessment
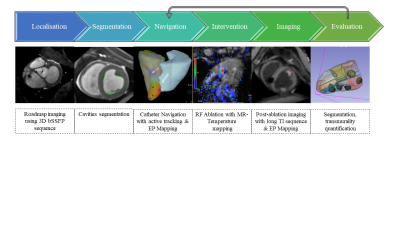
Figure 1: Schematic view of the EP workflow under MRI guidance. A 3D bSSFP acquisition is used as a reference for the roadmap & EP mapping. The cavities are segmented and converted to meshes. Then catheter navigation is performed using active catheter tracking followed by EP mapping. RFA ablation is performed under MRI temperature monitoring followed by post-ablation imaging without contrast agent. Evaluation of the lesion size and transmurality is done on the post ablation images after epi/endo segmentation. The segmentation steps could benefit from machine learning.
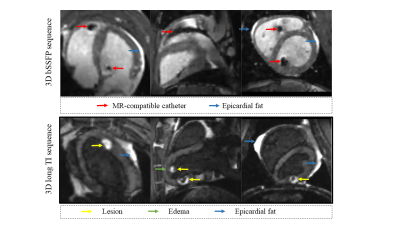
Figure 2: Specific features of the 3D images. Top: 3D bSSFP acquisition or 3D roadmap acquisition after catheter introduction into the cavities. The artefacts of the catheter (red arrows) are larger than the actual size of the catheter, in particular at the vicinity of the tip. The epicardial fat in hyper signal( blue arrows). Bottom: 3D long-TI acquisition performed after RFA. The created lesion can be visualized in hyper signal (yellow arrows) compared to the surrounding tissue attributed to edema (green arrows). The epicardial fat is highly visible in anterior and posterior view.
-
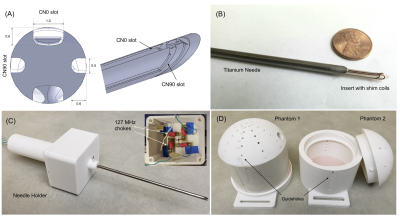
Towards Catheter-based Intra-Arterial Spin Labeling for Perfusion Measurements
Kevin Waescher1, Simon Reiss1, Ali Caglar Özen1,2, Thomas Lottner1, and Michael Bock1
1Dept. of Radiology, Medical Physics, Medical Center University of Freiburg, Faculty of Medicine, University of Freiburg, Freiburg, Germany, 2German Consortium for Translational Cancer Research Partner Site Freiburg, German Cancer Research Center (DKFZ), Heidelberg, Germany
In this study, we
present in vitro results to demonstrate that arterial spin labelling using a local catheter
based labelling coil provides an alternative technique for perfusion
measurements during cardiovascular interventions without the use of exogenous contrast
agents.
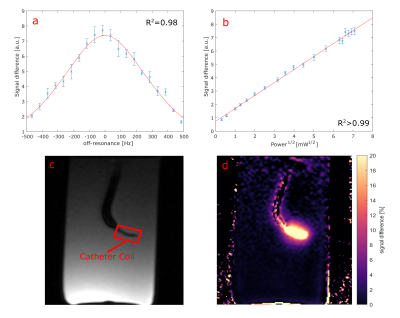
Figure 2: Frequency dependence
of the labelling signal fitted with a Lorentzian (a) along with the power dependence
(b). Image of the catheter (c) and map of the relative signal difference created
by the labelling (d). The difference image indicates the transmit B1 profile of
the labelling coil.
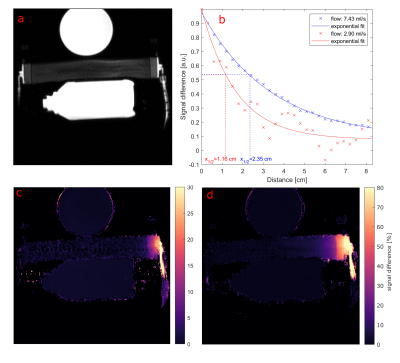
Figure 3: Image of the perfusion
phantom setup (a) and maps of the relative signal difference between the
labelled and unlabeled case for two different flow velocities (c and d). A plot of the normalized signal difference shows
the exponential decay within the perfusion phantom.
-
Prototype Platform for Real-time MR-guided Brain Clot Evacuation
Robert Moskwa1, Azam Ahmed2, and Walter Block1
1Medical Physics, University of Wisconsin-Madison, Madison, WI, United States, 2Neurological Surgery, University of Wisconsin-Madison, Madison, WI, United States
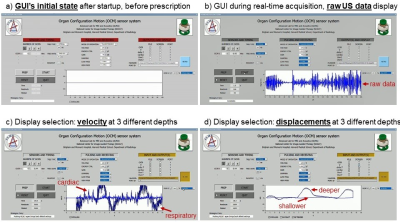
We present an MR-guidance prototype designed to provide neurosurgeons with an interface having similar viewpoints to those commonly used in stereotactic operating room settings. Flexible and interactive interface that leverages real-time MRI sequences.
Three displays, all individually acquired. Images are acquired in real
time using a real-time Spiral GRE sequence. Each display can show a different
view plane in real time by applying interactive tools. For example, a sample
catheter trajectory is shown in red. The top-left axial display was rotated. The top-right view shows a perpendicular, but collinear
display. The bottom image is perpendicular to the trajectory and shows the
probe’s eye view. Parameters also adjustable.
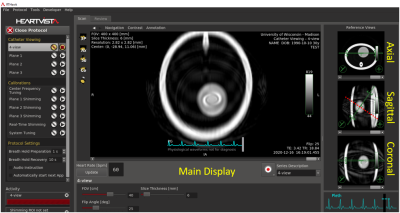
Three reference planes and a main display. Images are acquired in real
time using a real-time Spiral GRE sequence. The main display can be changed to
show a different view plane in real time by manipulating a graphic slice Rx on
any of the three reference planes. For example, a sample plane holding the catheter
trajectory is shown in red on the sagittal display in red. By selecting a
perpendicular plane, shown in green, the probe’s eye view can be observed in
real time. Parameters adjustable.
-
PETRA subtraction-based MRA to assess middle-cerebral-artery stenosis before and after treatment with angioplasty
Feifei Zhang1, Yuncai Ran1, Shujian Li1, Jinxia Zhu2, Xuemei Gao1, Jingliang Cheng1, and Chengcheng Zhu3
1The first Affiliated Hospital of Zhengzhou University, Zhengzhou, China, Zhengzhou, China, 2MR Collaboration, Siemens Healthcare Ltd., Beijing, China, Beijing, China, 3Department of Radiology, University of Washington, Seattle, Seattle, WA, United States
PETRA-MRA
is a promising non-invasive technique to evaluate MCA stenoses and could be an
alternative technique for patient follow-up assessments after stent
angioplasty.
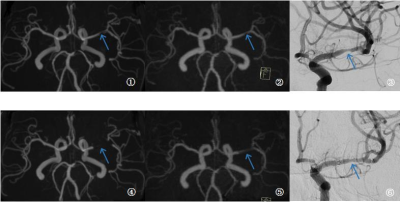
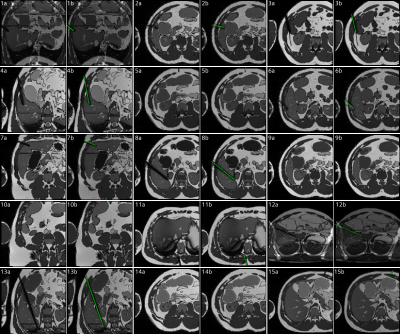
Fig1. Example results in a 63-year-old female patient who had left stent angioplasty in the left middle-cerebral-artery M1 segment. Preoperative (top row) and post-operative (bottom row) images are shown for time-of-flight magnetic resonance angiography (TOF-MRA, left), pointwise encoding time reduction with a radial acquisition (middle, PETRA-MRA), and digital subtraction angiography (right). Preoperative images indicated a similar degrees of stenosis (blue arrow). Obvious signal loss was observed in post-operative scans, with PETRA-MRA outperforming TOF-MRA.
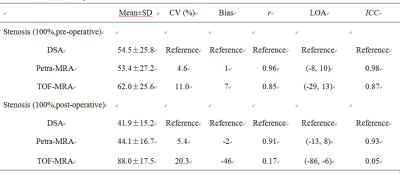
Table 1. Comparison of PETRA-MRA/TOF-MRA and DSA in measurements of stenosis of MCA
-
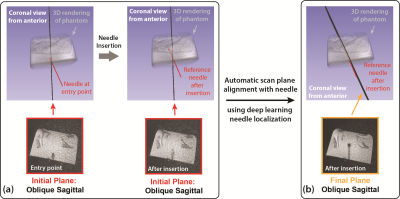
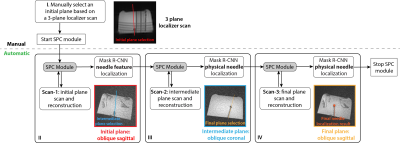
Deep Learning-Based Needle Tracking Trained on Bloch-Simulated Data and Evaluated on Clinical Real-Time bSSFP Images
Ralf Vogel1,2, Dieter Ritter2, Jonathan Weine2,3, Jonas Faust2,4, Elodie Breton5, Julien Garnon5,6, Afshin Gangi5,6, Andreas Maier1, and Florian Maier2
1Pattern Recognition Lab, Friedrich-Alexander-Universität Erlangen-Nürnberg, Erlangen, Germany, 2Siemens Healthcare, Erlangen, Germany, 3TU Dortmund, Dortmund, Germany, 4Universität Heidelberg, Heidelberg, Germany, 5ICube UMR7357, University of Strasbourg, CNRS, FMTS, Strasbourg, France, 6Imagerie Interventionnelle, Hôpitaux Universitaires de Strasbourg, Strasbourg, France
Synthetic training
data was successfully used to train a U-Net for image-based needle tracking, utilizing
automatically generated ground-truth labels. The evaluation on clinical patient
data indicates that synthetic MR images can replace patient data and animal
experiments.
Figure
1: Needle
predictions on clinical interventional images (red overlays), generated by U-net
trained with synthetic data only.
Figure
5: (a) random
selection of simulated images generated using the AustinMan model. All images
were simulated in the transversal plane, tilted by up to ±45° to the coronal plane. The needle was either placed
in liver tissue from a reasonable angle or completely random (11, 12, 14, 15). (b) Image
including the automatically generated needle label (green).
-
Deep Learning-based MR-only Radiation Therapy Planning for Head&Neck and Pelvis
Florian Wiesinger1, Sandeep Kaushik1, Mathias Engström2, Mika Vogel1, Graeme McKinnon3, Maelene Lohezic1, Vanda Czipczer4, Bernadett Kolozsvári4, Borbála Deák-Karancsi4, Renáta Czabány4, Bence Gyalai4, Dorottya Hajnal4, Zsófia Karancsi4, Steven F. Petit5, Juan A. Hernandez Tamames5, Marta E. Capala5, Gerda M. Verduijn5, Jean-Paul Kleijnen5, Hazel Mccallum6, Ross Maxwell6, Jonathan J. Wyatt6, Rachel Pearson6, Katalin Hideghéty7, Emőke Borzasi7, Zsófia Együd7, Renáta Kószó7, Viktor Paczona7, Zoltán Végváry7, Suryanarayanan Kaushik3, Xinzeng Wang3, Cristina Cozzini1, and László Ruskó4
1GE Healthcare, Munich, Germany, 2GE Healthcare, Stockholm, Sweden, 3GE Healthcare, Waukesha, WI, United States, 4GE Healthcare, Budapest, Hungary, 5Erasmus MC, Rotterdam, Netherlands, 6Newcastle University, Newcastle, United Kingdom, 7University of Szeged, Szeged, Hungary
Deep Learning provides powerful tools to address unsolved problems and unmet needs of MR-only Radiation Therapy Planning (RTP) in terms of synthetic CT conversion (required for acquired dose calculation) and time-consuming organ-at-risk (OAR) delineation.
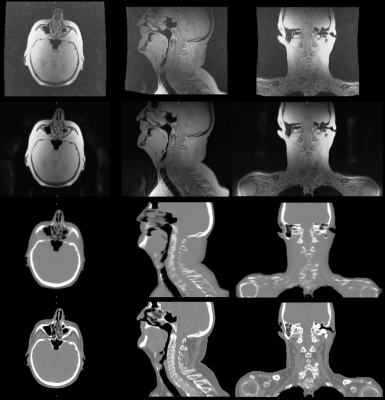
Figure 1: In-phase
ZTE without (top) and with 2xFOV extension plus DL image reconstruction (2nd
row) for head&neck, together with corresponding DL derived synthetic CT (3rd
row) and true CT (bottom row).
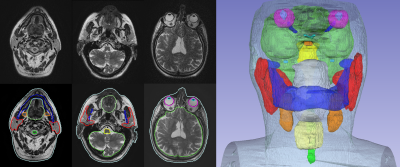
Figure 3: 2D T2 PROPELLER based
automated OAR segmentation in the head & neck (i.e. brain, brainstem, eyes,
lens, optic nerves, chiasm, pituitary gland, cochlea, parotid glands, mandible,
oral cavity, submandibular glands, larynx, spinal cord, and body contour).
-
Neural network based denoising of high temporal resolution cine images for tumor tracking in MR-guided radiotherapy
Florian Friedrich1,2, Juliane Hörner-Rieber3, Peter Bachert1,2, Mark E. Ladd1,2,4, and Benjamin R. Knowles1
1Medical Physics in Radiology, German Cancer Research Center (DKFZ), Heidelberg, Germany, 2Department of Physics and Astronomy, Heidelberg University, Heidelberg, Germany, 3Department of Radiation Oncology, University Hospital of Heidelberg, Heidelberg, Germany, 4Faculty of Medicine, Heidelberg University, Heidelberg, Germany
Image denoising and artifact suppression using U-net
increases tumor tracking stability in undersampled Cartesian and radial cine
acquisitions on MR-linac systems.
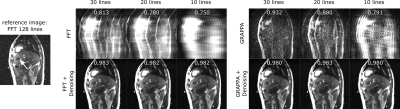
Figure 2: Denoising of undersampled Cartesian images of a
liver tumor (arrow).
Figure 3: Denoising of undersampled radial images of a liver
tumor (arrow).
-
Towards higher accuracy mapping of MRI to electron density using a 3D deep CNN for MRI-only radiotherapy treatment planning
Jessica E Scholey1, Abhejit Rajagopal2, Elena Grace Vasquez3, Atchar Sudhyadhom4, and Peder Eric Zufall Larson2
1Department of Radiation Oncology, University of California, San Francisco, San Francisco, CA, United States, 2Department of Radiology, University of California, San Francisco, San Francisco, CA, United States, 3Department of Physics, University of California, Berkeley, Berkeley, CA, United States, 4Department of Radiation Oncology, Harvard Medical School, Boston, MA, United States
A 3D deep convolutional neural network was used to synthetize CTs (acquired at MV energies) from MRIs for more mapping of accurate electron density (versus those acquired at kV energies) for radiotherapy treatment planning
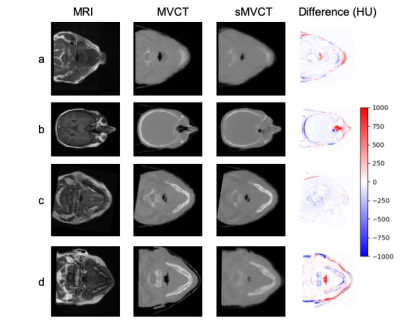
Figure 2: Transverse images for four representative test datasets with their corresponding a) MRI, b) MVCT, c) sMVCT, and d) HU difference (sMVCT-MVCT) maps.
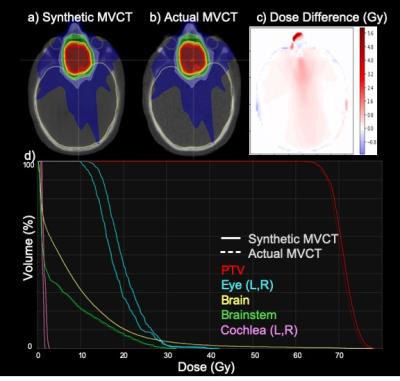
Figure 3: Transverse images of a) dose distribution calculated on the sMVCT, b) the identical plan calculated on the actual MVCT, c) the difference in dose distributions, and d) the dose volume histograms for the target and several organs-at-risk. In panel (d), DVHs are shown as dotted and solid lines for the sMVCT plan and MVCT plan, respectively.
-
Multi-Task MR Simulation for Abdominal Radiation Treatment Planning: Technical Development
Junzhou Chen1,2, Pei Han1,2, Fei Han3, Zhehao Hu1,2, Nan Wang1,2, Wensha Yang4, Anthony G Christodoulou1,2, Debiao Li1,2, and Zhaoyang Fan1,2,5
1Biomedical Imaging Research Institute, Cedars-Sinai Medical Center, Los Angeles, CA, United States, 2Department of Bioengineering, University of California, Los Angeles, Los Angeles, CA, United States, 3Siemens Medical Solutions USA, Inc., Los Angeles, CA, United States, 4Department of Radiation Oncology, University of Southern California, Los Angeles, CA, United States, 5Department of Radiology, University of Southern California, Los Angeles, CA, United States
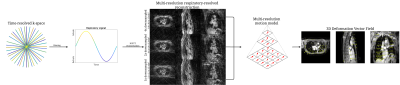
We present a MR platform for radiation therapy planning in the abdomen using MR Multitasking, which is able to generate volumetric, multi-contrast, respiratory motion-resolved images under free-breathing with less than a 10 min scan time.
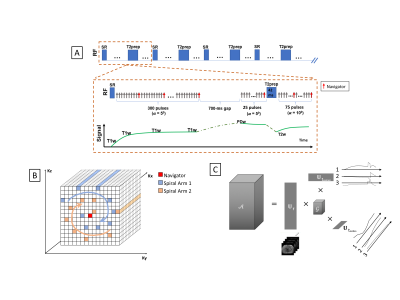
Fig.1 A) The pulse sequence diagram of the MR technique,
with the red arrows being the navigator line locations. B) Illustration of the
Cartesian spiral-in trajectory with Cartesian readout in Kx and spirals in
Ky-Kz (PE-Partition) plane. C) Illustration of three-way tensor factorization
to generate a multi-dimensional image 𝒜.
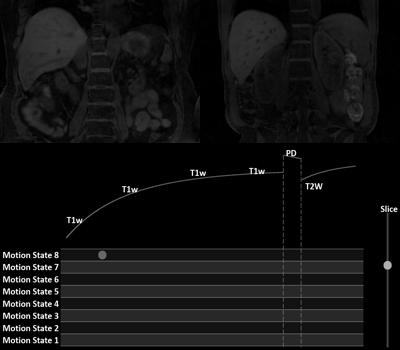
Figure 3[GIF]. In-vivo MT multi-dimensional image from two volunteers. A
user can view any contrasts, any motion states and any slice available in this
image.
-
Image quality comparisons of novel and commercial coil setups in MRI for head and neck radiotherapy simulation
Evangelia Kaza1, Jeffrey P Guenette2, Christian V Guthier1, Steven Hatch3, Alexander Marques3, Lisa Singer1, and Jonathan D Schoenfeld1
1Radiation Oncology, Brigham and Women’s Hospital, Dana-Farber Cancer Institute, Harvard Medical School, Boston, MA, United States, 2Division of Neuroradiology, Brigham and Women’s Hospital, Dana-Farber Cancer Institute, Harvard Medical School, Boston, MA, United States, 3Radiation Oncology, Brigham and Women’s Hospital, Dana-Farber Cancer Institute, Boston, MA, United States
A new UltraFlexLarge18
setup was more spacious and yielded higher SNR relative to a diagnostic
head/neck coil than a commercially
recommended FlexLarge4 coil setup for head images acquired in treatment
position. Its clinical application could benefit head/neck radiotherapy MR simulations.
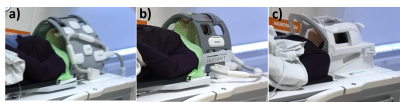
Figure 1. a) A
healthy volunteer in a radiotherapy
immobilization mask
fixed on a Qfix Portrait board placed on a modified Qfix Insight board. Two UFL18 coils attached by Velcro straps over and under the
Insight board encompassed the volunteer’s head. b) The same volunteer
and immobilization with the head surrounded by two attached FL4 coils placed in a Qfix
Insight holder. c) The same volunteer in standard head/neck diagnostic position
using a dedicated HN20 coil, where treatment masks do not fit.
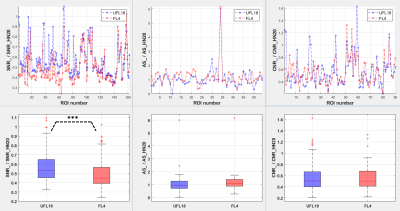
Figure 3. Graphs
(top) and boxplots (bottom) of ratios of image
quality parameters obtained using the flexible coil arrangements relative to
the parameters obtained using a diagnostic HN20 coil, over all subjects and
imaging sequences. From left to right: ratio of SNR, artifact size (AS) and CNR
from the UFL18 (blue) and FL4 (red) coil images over SNR, AS and CNR from the
HN20 coil images. ***:
statistically significant difference (p < 0.001) between SNR_UFL18/SNR_HN20 and SNR_FL4/SNR_HN20.
-
Real-Time B0 Correction in a MRI Guided Radiotherapy System
Austen Curcuru1, Deshan Yang1,2, and Michael Gach1,2,3
1Biomedical Engineering, Washinton University in Saint Louis, Saint Louis, MO, United States, 2Radiation Oncology, Washinton University in Saint Louis, Saint Louis, MO, United States, 3Radiology, Washinton University in Saint Louis, Saint Louis, MO, United States
Radiotherapy gantry rotation can cause artifacts and B0 fluctuations that impact tumor tracking and RT/MRI isocenter coincidence. Sequence parameters were
adjusted at run time to reduce these issues by integrating a
navigator into a bSSFP sequence and measuring B0 variations in
real-time.
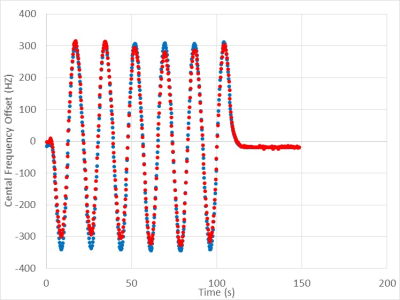
Figure 2: Resonant frequency offset during gantry rotation starting at 30° and
rotating around counterclockwise back to 33°. Offsets were calculated using a
navigator inserted into a bSSFP sequence (red) and by measuring the peak offset
in a FID sequence (blue).
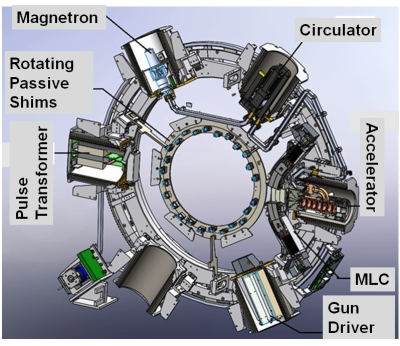
Figure 4: Illustration of the ViewRay MRI-Linac gantry
showing the six mu-metal buckets and rotating passive shim tray. The 60° radial
spacing between the buckets results in the periodic B0 offsets
observed at different gantry angles.
-
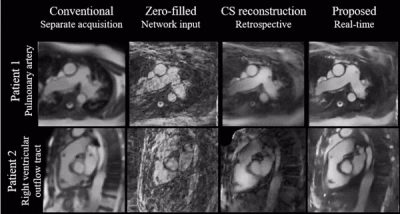
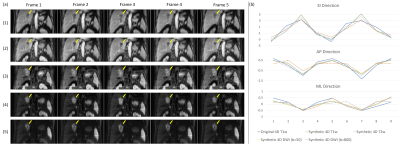
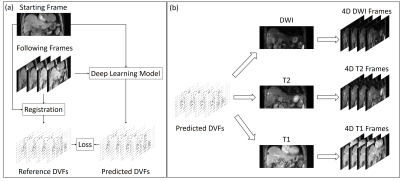
Respiratory Motion Detection and Reconstruction Using CAPTURE and Deep Learning for a 0.35T MRI-LINAC System: An Initial Study
Sihao Chen1, Cihat Eldeniz1, Weijie Gan1, Ulugbek Kamilov1, Deshan Yang1, Michael Gach1, and Hongyu An1
1Washington University in St. Louis, Saint Louis, MO, United States
A self-navigated respiratory motion detection (CAPTURE) and a deep learning 4D reconstruction method were used to derive the 3D deformable motion field for a 0.35 T MRI-LINAC system. Promising results were obtained despite the low SNR at 0.35 T.
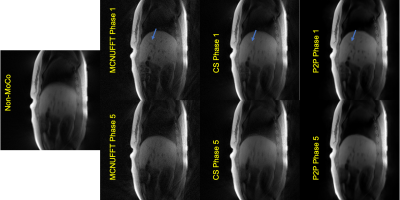
Figure 3. Images reconstructed using non-MoCo, MCNUFFT, CS and P2P from a healthy subject. The top row shows phase 1, corresponding to the end-of-expiration, and the bottom row shows phase 5, corresponding to the end-of-inspiration. Blue arrows point to a region of comparison for image quality among the three methods.
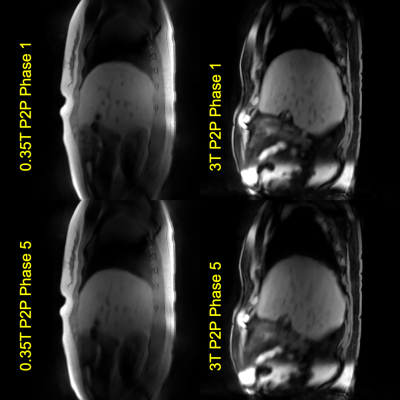
Figure 5. Images reconstructed using P2P at 0.35T and at 3T for different subjects for a rough qualitative assessment.
-
Joint Radial Trajectory Correction for Fast T2* Mapping on an MR-Linac
Wajiha Bano1,2, Will Holmes1,2, Mohammad Golbabaee3, Alison Tree1,2, Uwe Oelfke1,2, and Andreas Wetscherek1,2
1Joint Department of Physics, The Institute of Cancer Research, London, United Kingdom, 2The Royal Marsden NHS Foundation Trust, London, United Kingdom, 3Computer Science Department, The University of Bath, Bath, United Kingdom
The joint gradient delay correction and T2* mapping approach outperforms
the existing trajectory auto correction method. This will facilitate
integration of T2* mapping for hypoxia imaging in an MR-linac treatment work
flow.
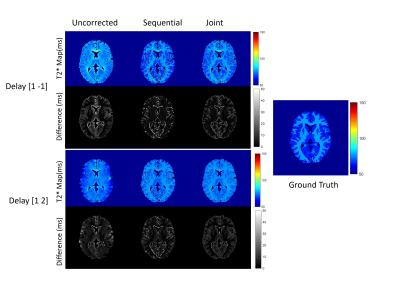
Figure 2: T2* maps obtained from fully sampled
numerical phantom with the noise level of 0.1 for gradient delays [1 -1] (top) and
[1 2] (bottom).
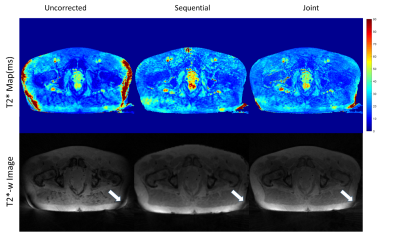
Figure
4: T2* maps (Top) and T2*-weighted images (TE=5 ms) reconstructed from the
in-vivo dataset without correction and with the sequential, respectively joint
approach. Arrows highlight a banding artifact, which disappeared on one side
after trajectory correction but partially remained on the other side.
-
Diffusion changes in prostate cancer patients undergoing radiation treatment on an MR-Linac system: Preliminary findings
Colleen Bailey1,2, Rachel W Chan1, Jay Detsky3,4, Danny Vesprini3,4, and Angus Z Lau1,2
1Odette Cancer Centre, Sunnybrook Research Institute, Toronto, ON, Canada, 2Medical Biophysics, University of Toronto, Toronto, ON, Canada, 3Department of Radiation Oncology, Sunnybrook Health Sciences Centre, Toronto, ON, Canada, 4Department of Radiation Oncology, University of Toronto, Toronto, ON, Canada
Prostate
cancer patients were scanned at five radiation treatment time points on an MR-Linac.
High b-value imaging revealed visible lesions in 6/8 patients. Significant ADC
increases were observed in 3/8 patients starting at the third treatment time point.
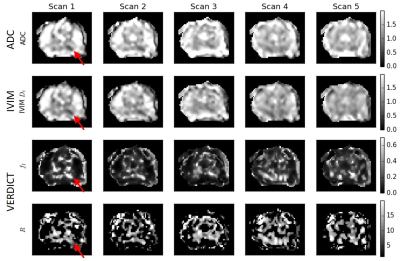
Figure
3 Selected parameter maps with heterogeneous low
ADC region identified as tumour (red arrow). The ADC and IVIM Dt
maps have similar features and become less hypointense at later time points.
The VERDICT intracellular fraction fI is higher in this region and
decreases over time. The data are not always sufficient to fit the R parameter,
particularly outside of the tumour ROI, resulting in dark sections in these
maps.
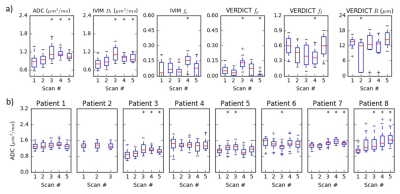
Figure
4 (a) Summary of parameter values in the tumour
ROI over the course of treatment for one patient. The ADC and Dt
are similar and increase at later treatment time points (* indicates
statistically significant increase over Scan 1). The fp from IVIM
and VERDICT parameters show more variability and do not demonstrate consistent
or statistically significant changes, although the fI trend is
inversely related to the ADC trend. (b) Changes in the ADC throughout treatment for
all eight patients.
-
MRI-based tumor localisation after tantalum clip placement for proton beam therapy planning of uveal melanoma
Myriam Jaarsma-Coes1,2, Teresa Ferreira1, Marina Marinkovic2, Khanh Vu2, Gre Luyten2, Coen Rasch3, Berit Verbist1, and Jan-Willem Beenakker1,2
1Radiology, Leiden University Medical Center, Leiden, Netherlands, 2Ophthalmology, Leiden University Medical Center, Leiden, Netherlands, 3Radiotherapy, Leiden University Medical Center, Leiden, Netherlands
A dedicated MRI protocol helps to improve proton beam radiation planning for uveal melanoma patients, as it provides a 3D visualisation of the radiographic marker-tumor relation compared to the conventional peroperative optical measurement.
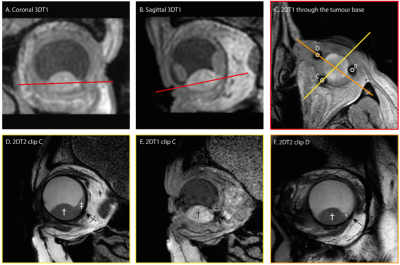
A,B). Coronal and sagittal view of the tumor are used to plan the scan to locate the clips.
C) 2DT1 scan trough the base clearly show the clips and is used to plan the subsequent scans perpendicular to the tumor base and through centre of the tumour and centre of clip C/D.
D,E). T2 spin echo sequence and T1 gradient echo showing the tumour (dagger), retinal detachment (double dagger) and clip (arrow). The clip location is better visualized on the gradient echo sequence, while a more accurate measurement can be made on the spin echo sequence.
F) T2 image of clip D.
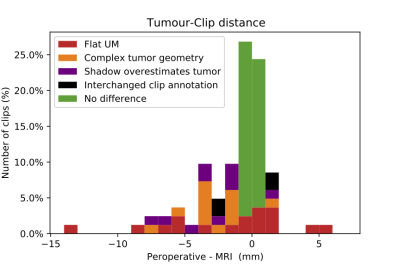
Summary of the differences in clip-tumor distances between the optical peroperative measurement and the MR-measurement. For 51% of the clips no clinically significant difference was found.
-
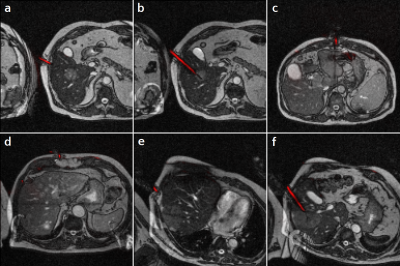
Deep learning based synthetic CT skull for transcranial MRgFUS interventions using 3D V-net–Transfer learning implications
Pan Su1,2, Sijia Guo2,3, Steven Roys2,3, Florian Maier4, Thomas Benkert4, Himanshu Bhat1, Elias R. Melhem2, Dheeraj Gandhi2, Rao P. Gullapalli2,3, and Jiachen Zhuo2,3
1Siemens Medical Solutions USA, Inc., Malvern, PA, United States, 2Department of Diagnostic Radiology and Nuclear Medicine, University of Maryland, School of Medicine, Baltimore, MD, United States, 3Center for Metabolic Imaging and Therapeutics (CMIT), University of Maryland Medical Center, Baltimore, MD, United States, 4Siemens Healthcare GmbH, Erlangen, Germany
Deep
learning can be used to generate synthetic CT skull, thereby simplifying
workflow of tcMRgFUS. 3D V-Net can take advantage of contextual information in
volumetric images. Furthermore, the pre-trained model can be applied in dataset
acquired using different sequence/protocols.
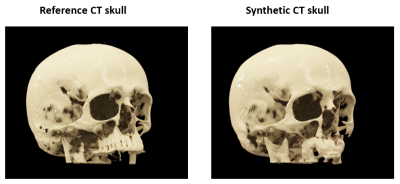
Figure
4: 3D cinematic rendering of the reference CT skull and synthetic CT skull from
a representative subject.
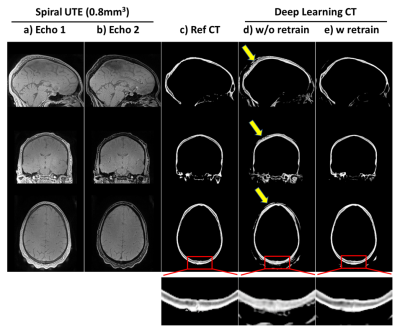
Figure 5: Transfer learning for 0.8mm3
isotropic synthetic CT skull: results of applying the trained model above to dual echo spiral UTE data (0.8mm3
isotropic) acquired on different 3T scanner. ab) dual echo spiral UTE; c) reference
CT skull; d) results of directly applying the previous model trained on radial UTE without any retraining of the spiral
UTE data; e)
results of applying the model after retraining with single spiral UTE data. Bottom
are zoom-in windows showing the details in posterior skulls. Note that all CTs here
are 0.8mm3 isotropic, as CT were coregistered to UTE space.
-
FMRI of Post High-Frequency Focused Ultrasound Ablation of ViM Shows Reduced Ipsilateral Thalamic and Cortical Motor Activation
Anna Crawford1, Mark Lowe1, Sean Nagel2, Daniel Lockwood1, Emmanuel Obusez1, Andre Machado2, and Stephen Jones1
1Imaging Institute, Cleveland Clinic Foundation, Cleveland, OH, United States, 2Neurological Institute, Cleveland Clinic Foundation, Cleveland, OH, United States
HIFU
treatment targets the thalamus using measurements and landmarks. We
explore an alternative method using 7T task-related fMRI and present
preliminary data of BOLD activation in patients before and after HIFU
treatment.
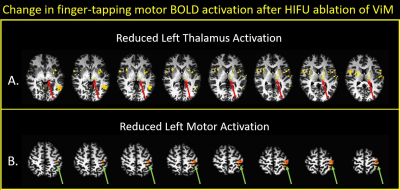
Figure 2: Mean statistical difference maps of pre-HIFU minus post-HIFU, using a finger tapping fMRI paradigm.
Arrows show regions with decreased activation after HIFU: green, motor
cortex in precentral gyrus; red, motor regions of thalamus; blue,
subthalamic nucleus; magenta, globus pallidus; orange, putamen.
Threshold for top panel is p=0.07; for bottom panel is p=0.02.
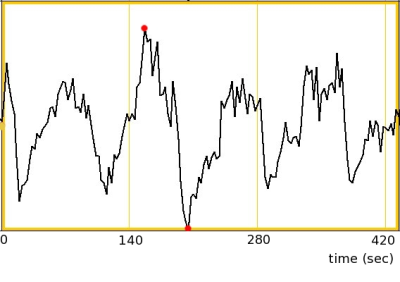
Figure 1: Single subject sample of finger tapping time series data from a voxel in the right motor cortex. The maximum and minimum values as indicated by red dots are 1396 and 1252 respectively.
-
Comparison of Automated Thalamic Segmentation Techniques: Applications in MRgFUS Planning
Kain Kyle1, Jerome Maller2, Yael Barnett3, Stephen Tisch3, Benjamin Jonker3, Michael Barnett1, Arkiev D'Souza1, and Chenyu Wang1
1University of Sydney, Sydney, Australia, 2GE Healthcare, Sydney, Australia, 3St Vincent's Hospital Sydney, Sydney, Australia
In this investigation the clinical utility of thalamic segmentation tools FreeSurfer and THOMAS for use in MRgFUS planning. We demonstrate that the ventral lateral nuclei segmented by FreeSurfer and THOMAS are consistent with the MRgFUS ablation target chosen by the treating clinician.
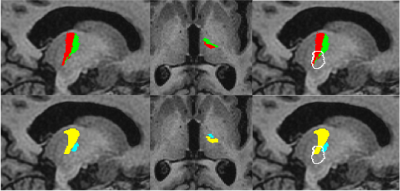
Figure 2. Comparison of typical Freesurfer and THOMAS thalamic segmentations. TopFreesurfer thalamic segmentation VLp (red) and VLa(green). Bottom THOMAS WMnMPRAGE thalamic segmentation, VLp (yellow) and VLa (blue). Ablation segmentation is overlayed in white.
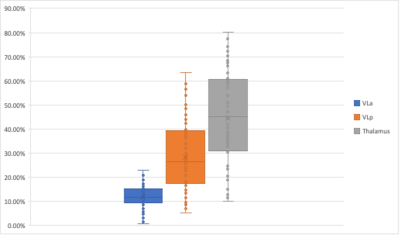
Figure 1. Volume of ablation in the FreeSurfer VLa, VLp and whole Thalamus, as a percentage of the total ablation volume.
-
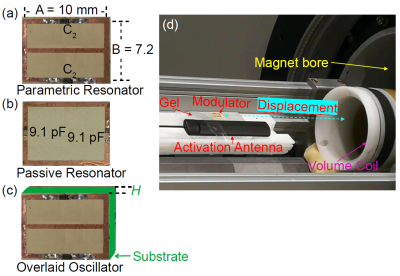
Reduced-FOV 3D MR-ARFI with a joint reconstruction for localizing the focused ultrasound beam in neuromodulation
Huiwen Luo1,2, Michelle K. Sigona1,2, Li Min Chen2,3, Charles F. Caskey2,3, and William A. Grissom1,2,3
1Biomedical Engineering, Vanderbilt University, Nashville, TN, United States, 2Vanderbilt University Institute of Imaging Science, Nashville, TN, United States, 3Radiology and Radiological Sciences, Vanderbilt University Medical Center, Nashville, TN, United States
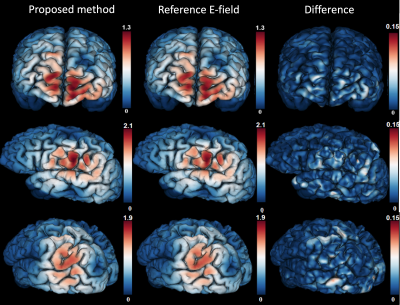
MR-ARFI can encode the ultrasound-induced displacements into the phase of an MR image. A two-minute reduced-FOV 3D MR-ARFI scan with a joint image reconstruction method at 3 Tesla was demonstrated to image and localize the entire focus in FUS neuromodulation with a low FUS duty-cycle of 0.85%.
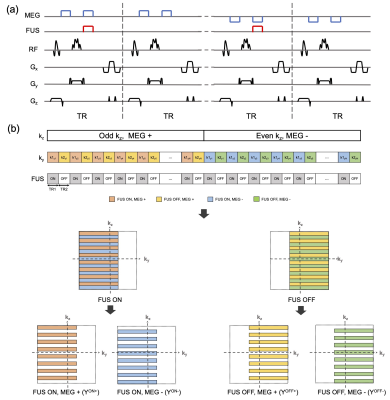
Figure 2. (a) 3D MR-ARFI sequence overview; (b) The proposed k-space undersampling scheme.
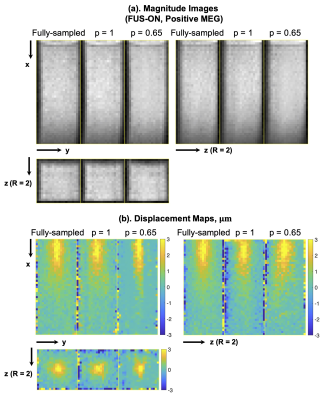
Figure 4. Representative reconstructed magnitude images (FUS-ON, positive MEGs) (a) and corresponding ARF displacement maps (b).