-
End-to-end Motion Corrected Reconstruction using Deep Learning for Accelerated Free-breathing Cardiac MRI
Haikun Qi1, Gastao Cruz1, Thomas Kuestner1, Karl Kunze2, Radhouene Neji2, René Botnar1, and Claudia Prieto1
1School of Biomedical Engineering and Imaging Sciences, King's College London, London, United Kingdom, 2MR Research Collaborations, Siemens Healthcare Limited, Frimley, United Kingdom
In this study, we propose an end-to-end deep learning non-rigid motion-corrected reconstruction technique for fast reconstruction of highly undersampled free-breathing CMRA.
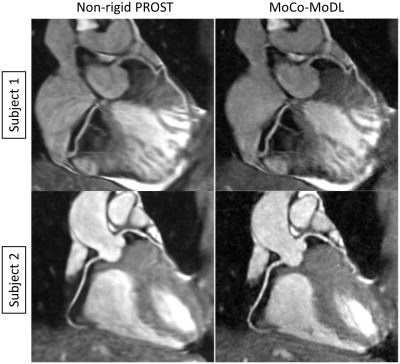
Fig. 5 Reformatted coronary arteries from 9x
accelerated CMRA reconstructed using non-rigid PROST and the proposed
MoCo-MoDL. First row: the test patient shown in Fig. 4; second row: one of the
test healthy subjects.
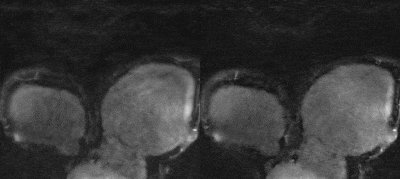
Fig. 4 Whole-heart 9x accelerated CMRA from one
representative test patient, reconstructed using non-rigid PROST (left) and the
proposed MoCo-MoDL (right).
-
Reduction of contrast agent dose in cardiovascular MR angiography using deep learning
Javier Montalt-Tordera1, Michael Quail1, Jennifer Anne Steeden1, and Vivek Muthurangu1
1Centre for Cardiovascular Imaging, UCL Institute of Cardiovascular Science, University College London, London, United Kingdom
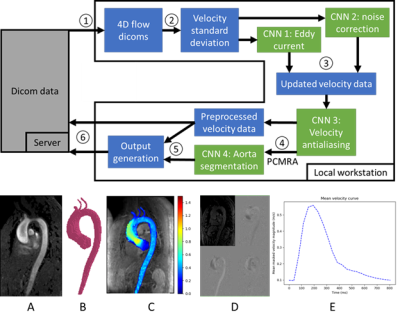
Deep learning enables an 80% reduction in contrast agent dose in cardiovascular contrast-enhanced MR angiography while maintaining image quality and clinical validity.
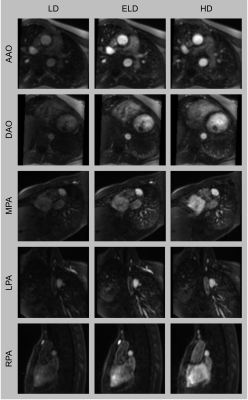
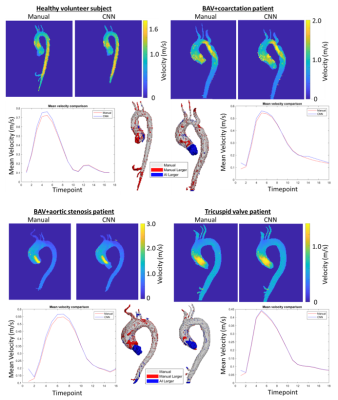
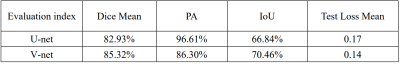
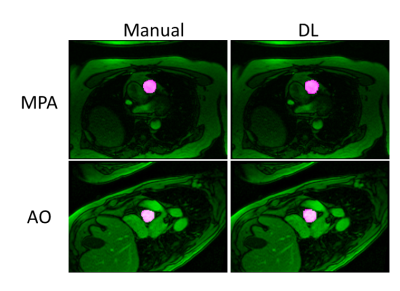
Figure 5. Representative images from the prospective study. Multiplanar reformats of the ascending aorta (AAO), descending aorta (DAO), main pulmonary artery (MPA), left pulmonary artery (LPA) and right pulmonary artery (RPA).
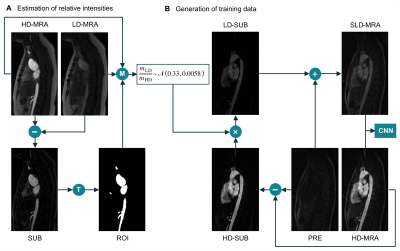
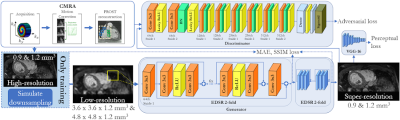
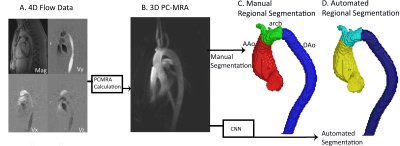
Figure 1. (A) Estimation of the intensity ratio between low-dose data (LD-MRA) and high-dose data (HD-MRA). T: thresholding followed by morphological opening. M: compute mean over ROI for both images. (B) Generation of synthetic low-dose (SLD-MRA) images, using the estimated intensity ratio, to be paired with the corresponding high-dose (HD-MRA) images for training.
-
Improving automated aneurysm detection on multi-site MRA data: lessons learnt from a public machine learning challenge
Tommaso Di Noto1, Guillaume Marie1, Sebastien Tourbier1, Yasser Alemán-Gómez1,2, Oscar Esteban1, Guillaume Saliou1, Meritxell Bach Cuadra1,3, Patric Hagmann1, and Jonas Richiardi1
1Department of Radiology, Lausanne University Hospital and University of Lausanne, Lausanne, Switzerland, 2Center for Psychiatric Neuroscience, Lausanne University Hospital and University of Lausanne, Lausanne, Switzerland, 3Medical Image Analysis Laboratory (MIAL), Centre d’Imagerie BioMédicale (CIBM), Lausanne, Switzerland
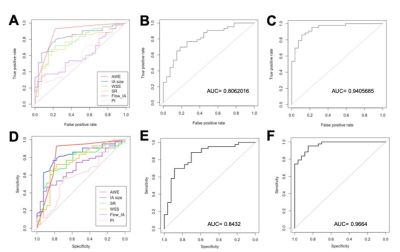
Participating in machine learning challenges provides valuable insights for medical imaging problems. In our case, the expedients learnt from a public challenge helped us to improve the sensitivity of our model both on one in-house test dataset and on the challenge test data.
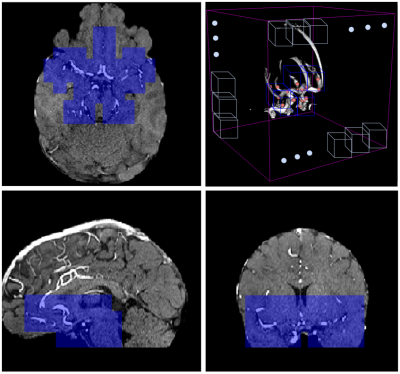
MRA orthogonal views of a 31-year-old female subject: blue patches are the ones which are retained in the anatomically-informed sliding-window approach. (top-right): 3D schematic representation of sliding-window approach; out of all the patches in the volume (white patches), we only retain those located in the proximity of the Willis polygon (blue ones).
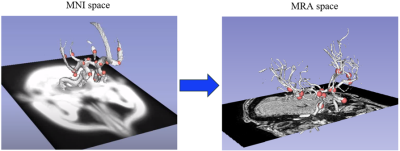
(left): 24 landmark points (in pink) located in specific positions of the Willis polygon (white segmentation) in MNI space. (right): same landmark points co-registered to the MRA space of one subject
-
Cardiac MRI feature tracking by deep learning from DENSE data
Yu Wang1, Sona Ghadimi1, Changyu Sun1, and Frederick H. Epstein1,2
1Biomedical Engineering, University of Virginia, Charlottesville, VA, United States, 2Radiology, University of Virginia, Charlottesville, VA, United States
A DENSE-trained deep network with through-time correction is a promising
new method to predict intramyocardial motion from contour motion.
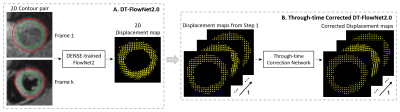
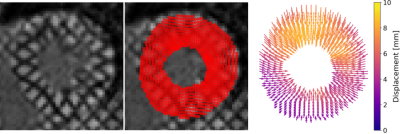
Figure 1: Overall
concept of using DL of DENSE datasets to predict intramyocardial displacement
from contour motion. (A) Training of FlowNet2 using DENSE data, and (B)
addition of a through-time correction network.
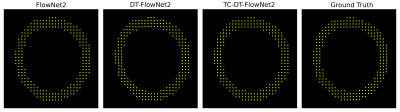
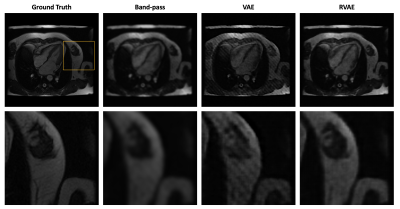
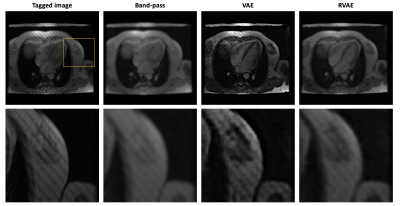
Figure 4: Example myocardial displacement
movies for FlowNet2, DT-FlowNet2, TC-DT-FlowNet2 and DENSE ground truth.
-
Fully Automated Myocardium Strain Analysis using Deep Learning
Xiao Chen1, Masoud Edalati2, Qi Liu2, Xingxian Shou2, Abhishek Sharma1, Mary P. Watkins3, Daniel J. Lenihan3, Linzhi Hu2, Gregory M. Lanza3, Terrence Chen1, and Shanhui Sun1
1United Imaging Intelligence, Cambridge, MA, United States, 2UIH America, Inc., Houston, TX, United States, 3Cardiology, Washington University School of Medicine, St. Louis, MO, United States
A deep-learning-based fully-automated myocardium strain assessment system is proposed and validated for accurate strain analyses on patient data.
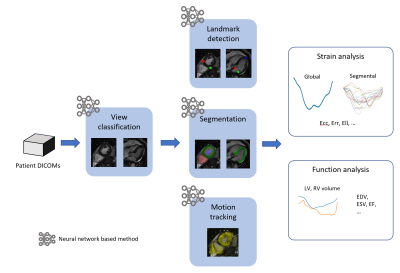
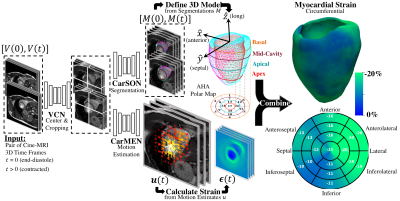
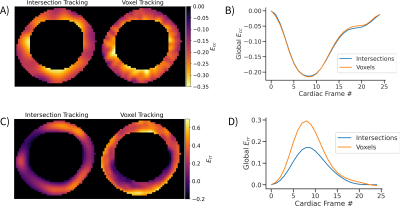
Workflow of the proposed fully automated cardiac strain and function analyses.
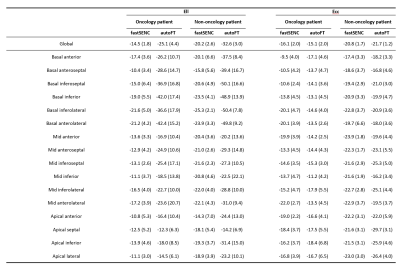
Summary of global and segmental Ell and Ecc using fastSENC and autoFT for oncology and non-oncology patients. Mean (std) numbers are reported.
-
Deep Learning-Based ESPIRiT Reconstruction for Accelerated 2D Phase Contrast MRI: Analysis of the Impact of Reconstruction Induced Phase Errors
Matthew J. Middione1, Julio A. Oscanoa1,2, Michael Loecher1, Christopher M. Sandino3, Shreyas S. Vasanawala1, and Daniel B. Ennis1,4
1Department of Radiology, Stanford University, Palo Alto, CA, United States, 2Department of Bioengineering, Stanford University, Palo Alto, CA, United States, 3Department of Electrical Engineering, Stanford University, Palo Alto, CA, United States, 4Cardiovascular Institute, Stanford University, Stanford, CA, United States
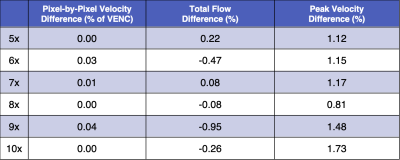
In this work we analyzed the impact of reconstruction induced phase bias to determine the maximum acceleration factor that could be used with CS and DL reconstruction frameworks for 2D PC-MRI while minimizing errors in peak velocity and total flow within ±5%.
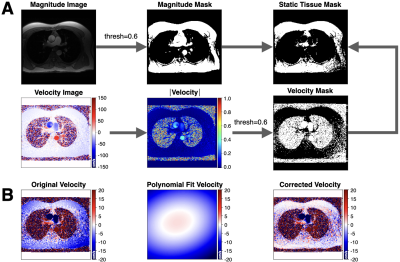
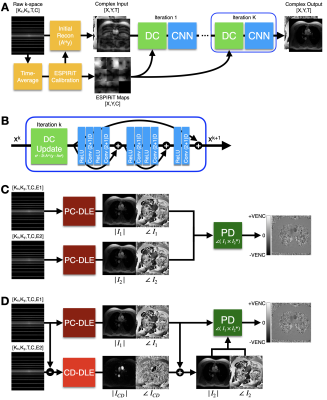
Figure 1. Overview of the background phase offset correction method. (A) Magnitude and velocity images were used as input to generate masked images of magnitude, velocity, and static tissue using a 60% signal intensity threshold. (B) The resulting static tissue mask was then used to generate a polynomial fit velocity image, which provides an estimated background phase offset image that can be used to correct the acquired velocity image.
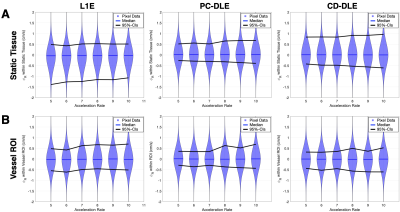
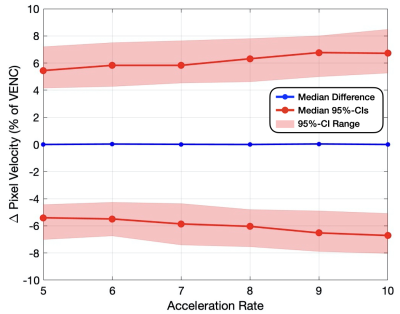
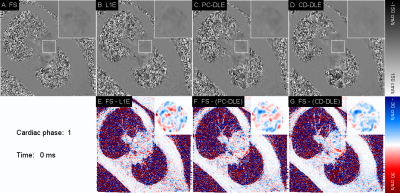
Figure 2. Pixel-by-pixel histogram differences demonstrate the magnitude of the reconstruction induced background phase offset bias, $$$\phi_{R}$$$ (cm/s), for L1E, PC-DLE and CD-DLE (A) within static tissue and (B) inside the vessel ROIs. The median (blue line) and 95%-CIs (lines) of $$$\phi_{R}$$$ are plotted as a function of the acceleration rate.
-
Exploring feature space of MR vessel images with limited data annotations through metric learning and episodic training
Kaiyue Tao1, Li Chen2, Niranjan Balu3, Gador Canton3, Wenjin Liu3, Thomas S. Hatsukami4, and Chun Yuan3
1University of Science and Technology of China, Hefei, China, 2Department of Electrical and Computer Engineering, University of Washington, Seattle, WA, United States, 3Department of Radiology, University of Washington, Seattle, WA, United States, 4Department of Surgery, University of Washington, Seattle, WA, United States
We explored vessel wall imaging information hidden in MRI images from the OAI dataset. We designed a metric learning network combined with an episodic training method to overcome the problem of limited annotations, and demonstrated its ability to learn a meaningful feature space.
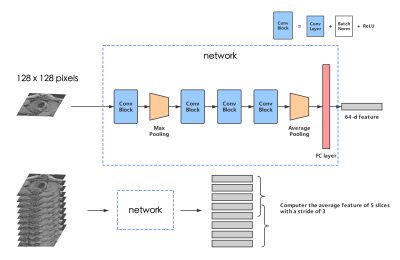
Figure 2 - The structure of our network. A Conv Block consists of a CNN layer, a batch normalization layer, and an active function ReLU. The kernel size of each convolution layer: 7*7, 3*3, 3*3, 3*3. A feature map with the size of (128, 7, 7) is outputted from the last Conv Block, and will then be reshaped into (128, 1) after max pooling. The number of total param of the network is 129600.
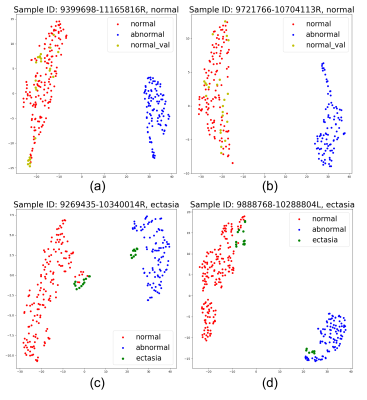
Figure 4 - Feature map of validation samples with normal/abnormal clusters in 2D space using t-SNE. Each dot represents an average feature of 5 slices in MRI scans, as described in the "inference" part. The colors (red for normal, blue for abnormal (aneurysm), green for ectasia, and yellow for normal validation samples) are painted to show the type of each dot. (a) and (b) show 2 normal validation samples, and (c) and (d) show 2 ectasia samples. The clusters' position can vary due to the t-SNE algorithm, as shown in (c) and (d), but the distance between features will be truly presented.
-
Deep learning-based reconstruction for 3D coronary MR angiography with a 3D variational neural network (3D-VNN)
Ioannis Valasakis1, Haikun Qi1, Kerstin Hammernik2, Gastao Lima da Cruz1, Daniel Rueckert2,3, Claudia Prieto1, and Rene Botnar1
1King's College London, London, United Kingdom, 2Technical University of Munich, Munich, Germany, 3Imperial College London, London, United Kingdom
A 3D variational deep neural network (3D-VNN) for the reconstruction of 3D whole-heart coronary MR angiography (CMRA) to fully capture the spatial redundancies in CMRA images.
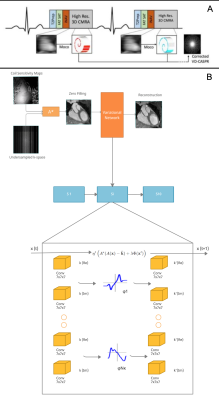
(A) The CMRA data acquisition and motion correction pipeline using a VD-CASPR trajectory and performing translational motion correction estimated from 2D iNAVs. (B) CSMs and the undersampled k-space data are used as network inputs. The variational network structure for one gradient step: the filters k are learned for the real and complex plane and a linear activation function combines the responses of the filters on those planes. The loss function is the MSE of the 3D-VNN reconstruction and the fully sampled.
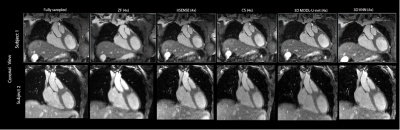
CMRA reconstructions for 5-fold undersampling for two representative subjects. 3D-VNN reconstruction is compared against the CS, iterative SENSE, CS and 3D CG MoDL-U-Net for a representative subject. Fully sampled and zero-filled reconstructions are also included for comparison.
-
Generalizability and Robustness of an Automated Deep Learning System for Cardiac MRI Plane Prescription
Kevin Blansit1, Tara Retson1, Naeim Bahrami2, Phillip Young3,4, Christopher Francois3, Lewis Hahn1, Michael Horowitz1, Seth Kligerman1, and Albert Hsiao1
1UC San Diego, La Jolla, CA, United States, 2GE Healthcare, Menlo Park, CA, United States, 3Mayo Clinic, Rochester, MN, United States, 4Mayo, Rochester, MN, United States
An automated deep learning system is capable of prescribing cardiac imaging planes comparable to those acquired by dedicated cardiac technologists, and is robust across MRIs from multiple sites and field strengths.
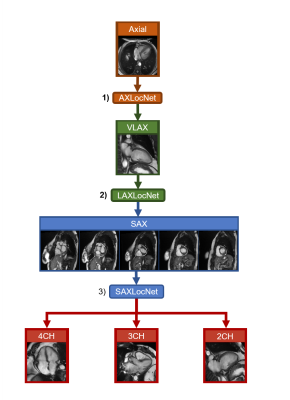
Schematic of automated, multi-stage system for prescribing cardiac imaging planes comprised of DCNN modules. 1) AXLocNet to localize the mitral valve (MV) and apex from the axial stack to prescribe a vertical long-axis, 2) LAXLocNet to localize the MV and apex from long-axis views to prescribe a SAX stack, 3) SAXLocNet to localize the mitral valve, tricuspid valve, and aortic valve to prescribe the 4, 3, and 2-chamber views.
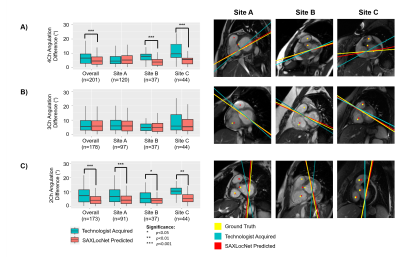
Left: Comparison of plane angulation differences from A) 4-chamber, B) 3-chamber, or C) 2-chamber planes acquired by an MRI technologist (teal) or SAXLocNet (coral).
Right: Exemplar vertical long-axis images displaying radiologist ground truth (yellow), technologist acquired (teal), and SAXLocNet predicted (red) A) 4-chamber, B) 3-chamber, or C) 2-chamber planes. Ground truth and SAXLocNet predicted localizations are shown as dots yellow and red, respectively.
-
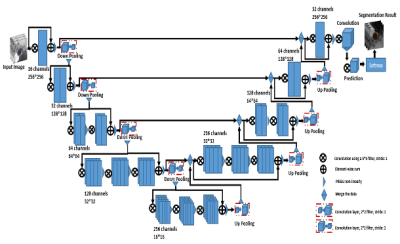
Automatic multilabel segmentation of large cerebral vessels from MR angiography images using deep learning
Félix Dumais1, Marco Perez Caceres1, Noémie Arès-Bruneau2, Christian Bocti2,3,4, and Kevin Whittingstall5
1Médecine nucléaire et radiobiologie, Université de Sherbrooke, Sherbrooke, QC, Canada, 2Faculté de Médecine et des Sciences de la Santé, Université de Sherbrooke, Sherbrooke, QC, Canada, 3Clinique de la Mémoire et Centre de Recherche sur le Vieillissement, CIUSSS de l’Estrie-CHUS, Sherbrooke, QC, Canada, 4Service de Neurologie, Département de Médecine, CHUS, Sherbrooke, QC, Canada, 5Radiologie diagnostique, Université de Sherbrooke, Sherbrooke, QC, Canada
Neural network performances are similar to those
obtained with trained annotators on large arteries. We can do a multilabel
brain artery segmentation by propagating CW annotation through the arterial
system. The variability of this algorithm to compute diameters is smaller than
1 voxel.
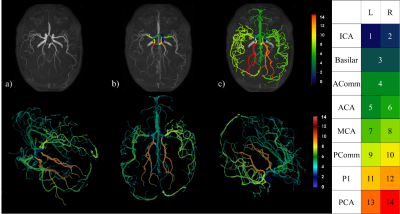
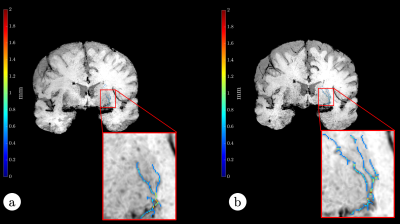
Figure 2: Top row : a) Raw TOF, b) CW segmentation,
c) Propagation of CW labels in the brain; Bottom row: 3D rendering of a full
arterial segmentation; Right: Legend indicating artery labels with their
corresponding color.
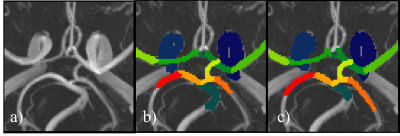
Figure 3: CW from a TOF-MRA raw (a) alongside its
manual annotation
(b) and the neural network
prediction (c)
-
Probing the Feasibility and Performance of Super-Resolution Head and Neck MRA Using Deep Machine Learning
Ioannis Koktzoglou1,2, Rong Huang1, William J Ankenbrandt1,2, Matthew T Walker1,2, and Robert R Edelman1,3
1Radiology, NorthShore University HealthSystem, Evanston, IL, United States, 2University of Chicago Pritzker School of Medicine, Chicago, IL, United States, 3Northwestern University Feinberg School of Medicine, Chicago, IL, United States
DNN-based
SR reconstruction of 3D tsSOS-QISS MRA of the head and neck is feasible, and
potentially enables scan time reductions of 2-fold and 4-fold for portraying
the intracranial and extracranial arteries, respectively.
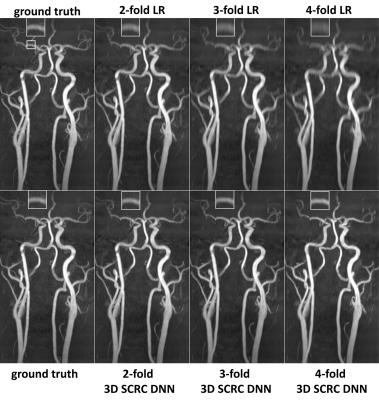
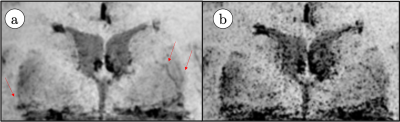
Figure 2. Coronal MIP 3D
tsSOS-QISS MRA images showing the impact of 3D SCRC SR DNN reconstruction on
image quality for 2- to 4-fold reduced of axial spatial resolution with respect
to ground truth data (left-most column) and input lower resolution (LR) data
(right-most upper panels). Insets show magnified views of the right middle
cerebral artery. Note the markedly improved image quality and spatial
resolution of the 3D SCRC SR DNN with respect to input LR volumes.
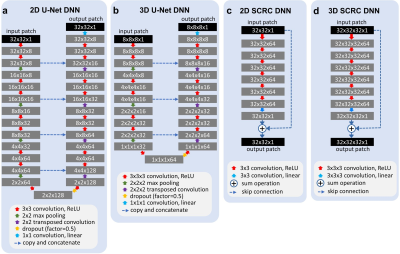
Figure 1. Architectures
of the deep neural networks used for super-resolution reconstruction. ReLU =
rectified linear unit. Training batch sizes for networks (a) through (d) were
400, 80, 400 and 20, whereas the number of trainable parameters for networks
were 540,073, 436,521, 185,857 and 556,801, respectively.
-
Fully automatic extraction of mitral valve annulus motion parameters on long axis CINE CMR using deep learning
Maria Monzon1,2, Seung Su Yoon1,2, Carola Fischer2, Andreas Maier1, Jens Wetzl2, and Daniel Giese2
1Friedrich-Alexander-Universität Erlangen-Nürnberg, Erlangen, Germany, 2Magnetic Resonance, Siemens Healthcare GmbH, Erlangen, Germany
..
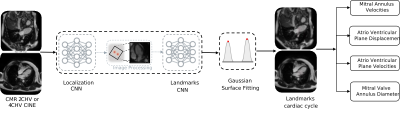
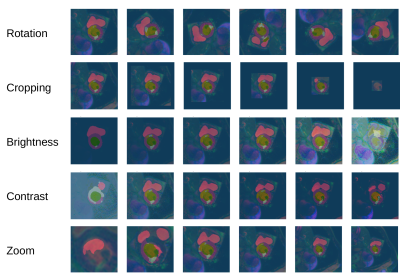
Figure 1: Proposed CNN system. The long-axis CMR images are forwarded to the first
CNN which localizes the region of interest. After cropping and rotation, the
second CNN regresses the time-resolved mitral valve annulus landmarks from Gaussian
heatmaps. Finally, the motion parameters are extracted.

Figure 2: a) Feature extraction 2D Residual and 3D convolution
blocks. Each residual block consists of a spatial convolution(CONV)(3x3), Batch Normalization (BN) and Leaky Rectified Linear Units (LReLU)
activation layers. The 3D block consist of double spatial and temporal CONV(3x3x3)-BN-LReLU operations. b) Localization CNN architecture based on 2-D UNet with 3 encoder-decoder blocks. c) Landmark tracking Fully CNN architecture details based on 3-D UNet.For down-sampling asymmetrical max-pooling layers were applied into temporal and spatial dimensions.
-
Intracranial aneurysm segmentation using a deep convolutional neural network
Miaoqi Zhang1, Qingchu Jin2, Mingzhu Fu1, Hanyu Wei1, and Rui Li1
1Center for Biomedical Imaging Research, Department of Biomedical Engineering, Tsinghua University, Beijing, China, 2Johns Hopkins University, Baltimore, MD, United States
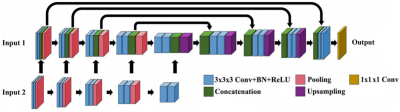
we successfully segmented IAs from dual inputs (TOF-MRA and T1-VISTA) using the hyperdense net with higher accuracy than a single input.
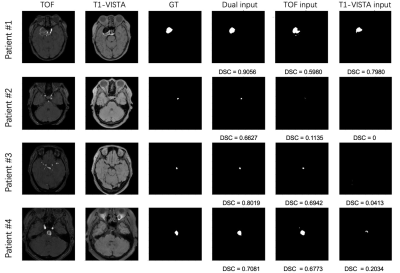
Figure 2. Four IA segmentation examples.
Each row represents a patient in the test set. Six columns from left to right
represent TOF-MRA, T1-VISTA, ground truth (GT), segmentation from the model
with dual inputs, segmentation from the model with TOF-MRA alone and
segmentation from the model with T1-VISTA alone.
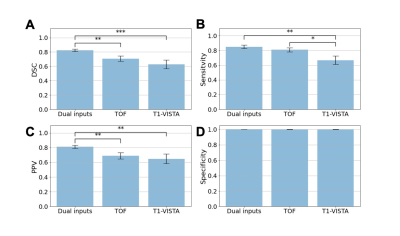
Figure 3. Aneurysm segmentation evaluation
across different combinations of image inputs: dual inputs, TOF-MRA alone and
T1-VISTA alone. (A) Sørensen–Dice coefficient (DSC); (B) sensitivity; (C) positive
predictive value (PPV); and (D) specificity. Paired Student’s t-tests were
performed with the notation *: P < 0.05; **: P < 0.005; ***: P <
0.0005.
-
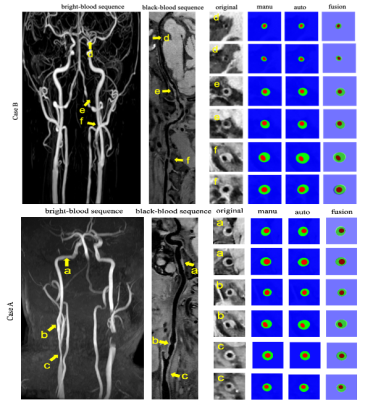
AI-based Computer-Aided System for Cardiovascular Disease Evaluation (AI-CASCADE) for carotid tissue quantification
Yin Guo1, Li Chen2, Dongxiang Xu3, Rui Li4, Xihai Zhao4, Thomas S. Hatsukami5, and Chun Yuan1,3
1Bioengineering, University of Washington, Seattle, WA, United States, 2Electrical Engineering, University of Washington, Seattle, WA, United States, 3Radiology, University of Washington, Seattle, WA, United States, 4Biomedical Engineering, Tsinghua University, Beijing, China, 5Surgery, University of Washington, Seattle, WA, United States
In this work, we developed AI-CASCADE, a fully automated solution for quantitative tissue characterization of carotid MRI, including artery localization, vessel wall segmentation, artery registration and plaque component segmentation.
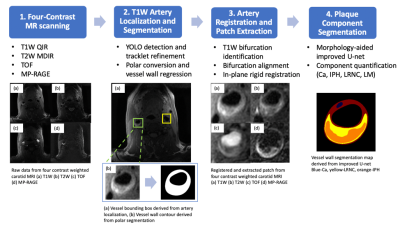
Fig 1. Workflow of AI-CASCADE
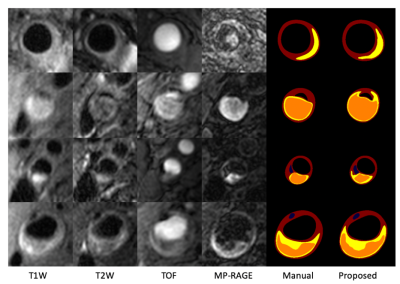
Fig 3. Visualization of composition segmentation. Blue-Ca, yellow-LRNC, orange-IPH.
-
Myocardial T2-weighted black-blood imaging with a deep learning constrained Compressed SENSE reconstruction
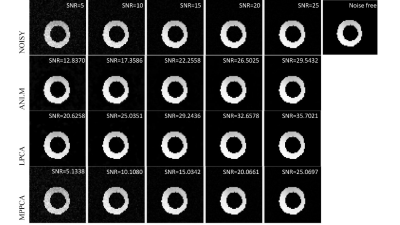
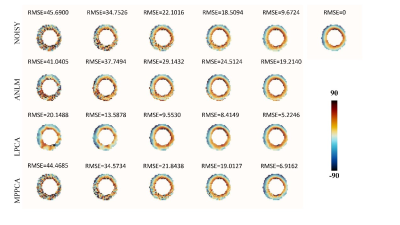
KOHEI YUDA1, Takashige Yoshida1, Yuki Furukawa1, Masami Yoneyama2, Jihun Kwon2, Nobuo Kawauchi1, Johannes M. Peeters 3, and Marc Van Cauteren3
1Radiology, Tokyo Metropolitan Police Hospital, nakanoku, Japan, 2Philips Japan, Tokyo, Japan, shinagwaku, Japan, 3Philips Healthcare, Best, Netherlands, Netherlands, Netherlands
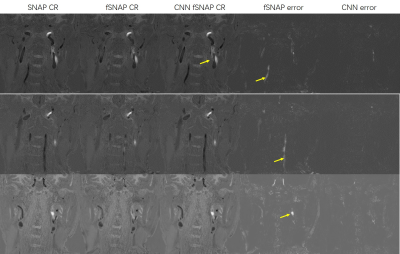
The CS-AI reduced the noise better compared to C-SENSE, and the depiction of the myocardium improved. Our results suggest that the application of CS-AI may be able to improve the image quality of myocardial T2W-BB.
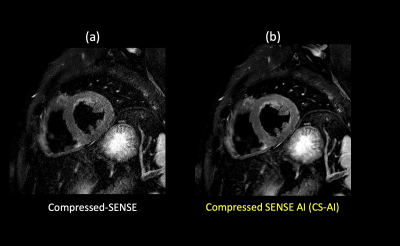
(a) C-SENSE T2W-BB (b) CS-AI-T2W-BB
Figure 1. Representative high resolution T2W-BB images using the C-SENSE and CS-AI reconstructions.
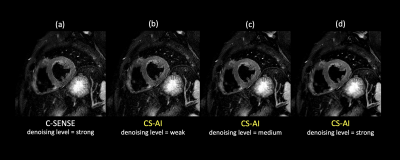
(a) C-SENSE strong (b) CS-AI weak (c) CS-AI medium (d) CS-AI strong
Figure 2. High resolution T2W-BB images reconstructed by C-SENSE with denoising level = strong (a) and CS-AI with denoising level = weak, medium, and strong for (b), (c), and (d), respectively.
-
Evaluation of a Deep Learning reconstruction framework for three-dimensional cardiac imaging
Gaspar Delso1, Marc Lebel2, Suryanarayanan Kaushik2, Graeme McKinnon2, Paz Garre3, Pere Pujol3, Daniel Lorenzatti3, José T Ortiz3, Susanna Prat3, Adelina Doltra3, Rosario J Perea3, Teresa M Caralt3, Lluis Mont3, and Marta Sitges3
1GE Healthcare, Barcelona, Spain, 2GE Healthcare, Waukesha, WI, United States, 3Hospital Clínic de Barcelona, Barcelona, Spain
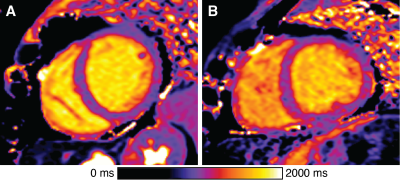
The Deep Learning framework was found to
provide equivalent diagnostic information content as state-of-the-art 3D
Cartesian reconstruction, with consistently superior image quality and
processing time compatible with clinical routine.
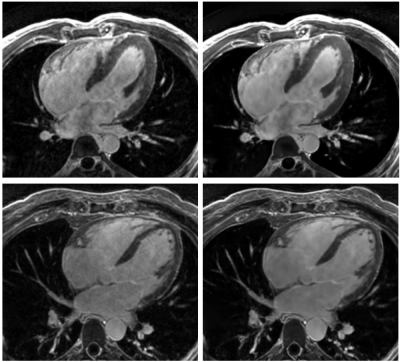
Figure
1.- Long axis views of 3D MDE series, reconstructed
with a standard 3D Cartesian method (left) and the proposed Deep Learning
framework (right).
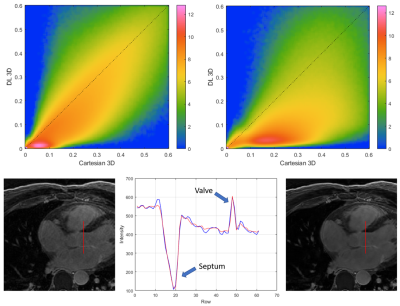
Figure
4.- Top: Logarithmic joint histograms of the
voxel-wise relative standard deviation, in the reference Cartesian and DL
reconstructions shown in figure 1. Notice how most voxels are located below the
identity line, indicating SNR improvement. Bottom: Line profile illustrating
the preservation of structure edges with the regularized reconstruction.
-
Automated Segmentation of the Left Atrium from 3D Late Gadolinium Enhancement Imaging using Deep Learning
Suvai Gunasekaran1, Julia Hwang1, Daming Shen1,2, Aggelos Katsaggelos1,3, Mohammed S.M. Elbaz1, Rod Passman4, and Daniel Kim1,2
1Radiology, Northwestern University, Feinberg School of Medicine, Chicago, IL, United States, 2Biomedical Engineering, Northwestern University, Evanston, IL, United States, 3Electrical and Computer Engineering, Northwestern University, Evanston, IL, United States, 4Cardiology, Northwestern University, Feinberg School of Medicine, Chicago, IL, United States
A proposed 2 s automated left atrial wall segmentation from 3D
late gadolinium enhancement imaging using deep learning provided comparable segmentation
performance to 16-30 min manual segmentation.
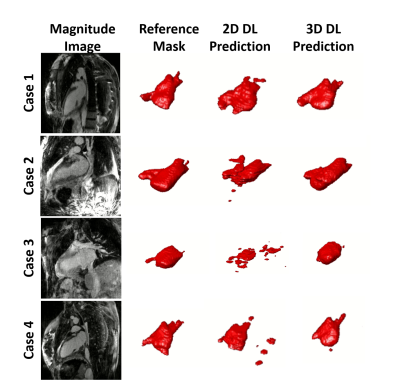
Figure 3. Examples of results for the different
DL networks from four testing cases. The segmentation results generated by the 3D
inputs are qualitatively better than those generated by the 2D inputs.
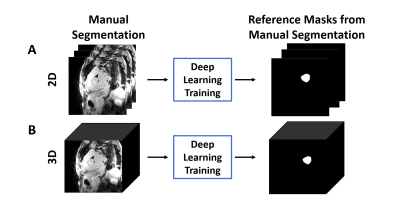
Figure 2. The overall process of DL
segmentation for (A) 2D and (B) 3D inputs. The LA LGE and reference masks
extracted from manual contours were used as input and reference to train the DL
network. For testing, the LA LGE images were fed into the trained network to
get the DL segmented masks.
-
Respiratory motion in DENSE MRI: Introduction of a new motion model and use of deep learning for motion correction
Mohamad Abdi1, Daniel S Weller1,2, and Frederick H Epstein1,3
1Biomedical Engineering, University of Virginia, Charlottesville, VA, United States, 2Electrical and Computer Engineering, University of Virginia, Charlottesville, VA, United States, 3Radiology, University of Virginia, Charlottesville, VA, United States
We introduce a new motion model for displacement
encoding with stimulated echoes imaging and a strategy for motion compensation in
segmented acquisitions. A Deep learning method is developed and shown to be an effective solution to estimate
the required parameters for motion compensation.
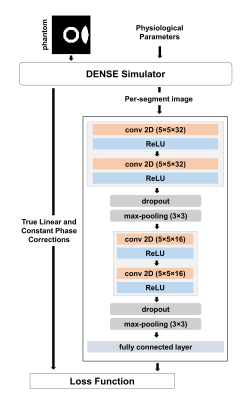
Diagram of an encoder-type
convolutional neural network to estimate linear and constant phase corrections
for motion-corrupted DENSE and it’s training using data generated with the
DENSE simulator.
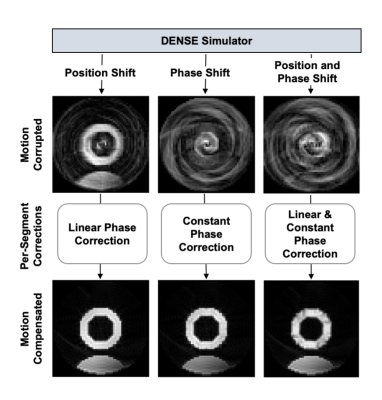
Bloch-equation-based
simulations show the various effects of free breathing during the acquisition
of DENSE images (top row of images). Motion-compensation based on Equation 4
demonstrates the validity of the motion model and its ability to achieve motion
correction if the phase correction values are known (bottom row of images).
-
Cardiac metabolism assessed by MR Spectroscopy to classify the diabetic and obese heart: a Random Forest and Bayesian network study
Ina Hanninger1, Eylem Levelt2,3, Jennifer J Rayner2, Christopher T Rodgers2,4, Stefan Neubauer2, Vicente Grau1, Oliver J Rider2, and Ladislav Valkovic2,5
1Oxford Institute of Biomedical Engineering, Oxford, United Kingdom, 2Radcliffe Department of Medicine, University of Oxford Centre for Clinical Magnetic Resonance Research, Oxford, United Kingdom, 3University of Leeds, Leeds, United Kingdom, 4Wolfson Brain Imaging Centre, Cambridge, United Kingdom, 5Slovak Academy of Sciences, Institute of Measurement Science, Bratislava, Slovakia
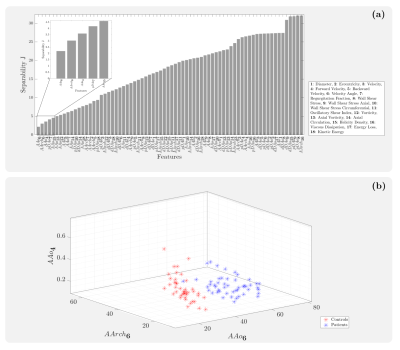
Random Forest classifiers and Bayesian networks applied to MR spectroscopy measures suggests a high predictive impact of cardiac metabolism in classifying diabetic and obese patients, further implying a causal mechanism with visceral fat, concentric LV remodeling and energy impairment
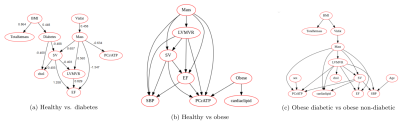
Figure 2(a,b,c): Bayesian networks learned through NOTEARS structure learning algorithm for each subgroup pair of the data. Each node represents a feature variable, and each directed edge encodes causal influence in the form of conditional probability dependence.
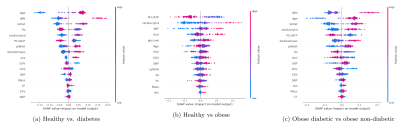
Figure 1(a,b,c): SHAP value plots computed for each Random Forest classification, representing a rank of feature importances. The x-axis gives the SHAP value, i.e. the impact on the model output (for a positive classification). Red indicates higher feature values, while blue indicates lower values.
-
Differentiation between cardiac amyloidosis and hypertrophic cardiomyopathy by texture analysis of T2-weighted CMR imaging
Shan Huang1, Yuan Li1, Ke Shi1, Yi Zhang1, Ying-kun Guo2, and Zhi-gang Yang1
1Radiology, West China Hospital, Chengdu, China, 2Radiology, West China Second University Hospital, Chengdu, China
Texture analysis was feasible and reproducible for
detecting myocardial tissue alterations on T2-weighted images. Our radiomics
model had a great performance in differentiating between CA and HCM patients,
which was comparable to LGE.
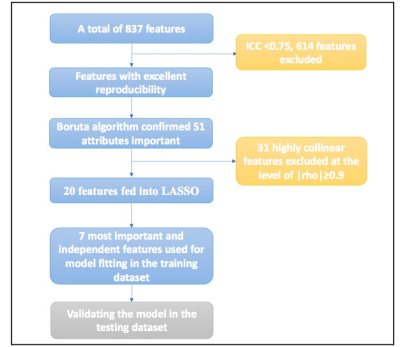
Figure1 Feature selection and dimension reduction
process.
ICC: intraclass correlation coefficient, LASSO:
the least absolute shrinkage and selection operator.
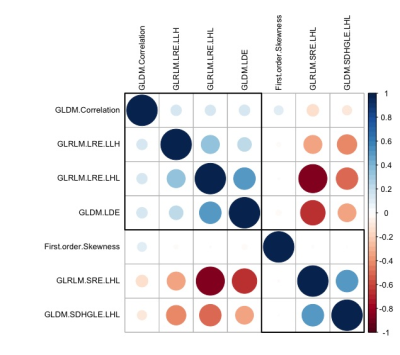
Figure 2 Correlogram of the relationship among the selected texture
features.
Smaller
and/or lighter circles represent lower correlation. On the contrary, larger
and/or darker circles indicate higher correlation. GLRLM: gray level run length matrix, GLDM: gray level dependence matrix,
GLCM: gray level co-occurrence matrix; LRE: Long Run Emphasis; SRE: Short Run
Emphasis; SDHGLE: Small Dependence High Gray Level Emphasis; LDE: Large
Dependence Emphasis; H: high wavelet filter; L: low wavelet filter