Artificial Intelligence (Machine Learning & Deep Learning) Applications to Neuroradiology
Neuro Wednesday, 19 May 2021

Oral Session - Artificial Intelligence (Machine Learning & Deep Learning) Applications to Neuroradiology
Neuro
Wednesday, 19 May 2021 16:00 - 18:00
  • CT-to-MR image synthesis: A generative adversarial network-based method for detecting hypoattenuating lesions in acute ischemic stroke
    Na Hu1, Tianwei Zhang2, Yifan Wu3, Biqiu Tang1, Minlong Li1, Qiyong Gong1, Shi Gu2, and Su Lui1
    1Huaxi MR Research Center (HMRRC), Department of Radiology, West China Hospital of Sichuan University, Chengdu, China, 2Department of Computer and Engineering, University of Electronic Science and Technology of China, Chengdu, China, 3Department of Bioengineering, University of Pennsylvania, Philadelphia, PA, United States
    With synthetic MRI compared to CT, sensitivity was improved by 116% in patient detection and 300% in lesion detection, and extra 75% of patients and 15% of lesions missed on CT were detected on synthetic MRI.
    Figure 3. Example of patient detection using synthetic MRI (syn-MRI) versus CT in the testing set. Brain baseline CT (left) fails to show any definite hypoattenuating lesions, although the gray-white matter junction of the right insula is suspected. Synthetic MRI (middle) shows distinct hyperintensity in the territory of middle cerebral artery on the right, which is corresponding to the finding on the follow-up MRI (right).
    Figure 1. Training and Testing of the generative adversarial network model.
  • Identifying Diffuse Intrinsic Pontine Glioma (DIPG) Subtypes via Radiomic Approaches
    Silu Zhang1, Zoltan Patay1, Bogdan Mitrea2, Angela Edwards1, Lydia McColl Makepeace1, and Matthew A. Scoggins1
    1Diagnostic Imaging, St. Jude Children's Research Hospital, Memphis, TN, United States, 2Activ Surgical, Boston, MA, United States
    In this study, we identified two subtypes of diffuse intrinsic pontine glioma (DIPG) based on radiomic features, with a significant difference in survival rates. Subtype 1 had a mean PFS and OS of 8.9 and 12.7 months, respectively. Subtype 2 had a mean PFS and OS of 5.7 and 9.1 months, respectively.
    Figure 1. Image preprocessing and analysis workflow. A) Images were first automatically segmented and then manually adjusted if necessary. B) Images were bias corrected, smoothed, and normalized. C) Radiomic features were extracted from original and filtered images. D) Patients were divided into training (80%) and validation (20%) sets. Feature selection was performed in only the training set. Subtypes were identified using selected features, and survival analysis was performed on the two subtypes identified.
    Figure 3. Survival rates of the two subtypes identified. A) & B), progression free survival (PFS). C) & D), overall survival (OS). A) & C) Training set. B) & D) Validation set.
  • Deep learning super-resolution for sub-50-micron MRI of genetically engineered mouse embryos
    Zihao Chen1,2, Yuhua Chen1,2, Ankur Saini3, William Devine3, Yibin Xie1, Cecilia Lo3, Debiao Li1,2, Yijen Wu3, and Anthony Christodoulou1
    1Biomedical Imaging Research Institute, Cedars-Sinai Medical Center, Los Angeles, CA, United States, 2Department of Bioengineering, UCLA, Los Angeles, CA, United States, 3Department of Developmental Biology, University of Pittsburgh, Pittsburgh, PA, United States
    We propose a deep learning based approach for 3x3 super-resolution (SR) of mouse embryo images (sub 50 μm resolution) using raw k-space data. Our method can reduce the scan time by a factor of 9 while preserving the diagnostic details and shows better quantitative results than previous SR methods.
    Figure 1. Magnitude resolution degradation (MD) vs. Complex resolution degradation (CD) in MR single image super-resolution (SISR).
    Figure 3. An example testing slice with LR image, bicubic interpolation image, HR ground truth and output images from different networks. The regions marked by green boxes are zoomed in.
  • Classification of Pediatric Posterior Fossa Tumors using Convolutional Neural Network and Tabular Data
    Moran Artzi1,2,3, Erez Redmard3, Oron Tzemach3, Jonathan Zeltser3, Omri Gropper4, Jonathan Roth2,5,6, Ben Shofty2,5,7, Danil A. Kozyrev5,7, Shlomi Constantini2,5,7, and Liat Ben-Sira2,8
    1Sagol Brain Institute, Tel Aviv Sourasky Medical Center, Tel Aviv, Israel, 2Sackler Faculty of Medicine, Tel Aviv University, Tel Aviv, Israel, 3Sagol School of Neuroscience, Tel Aviv University, Tel Aviv, Israel, 4The Iby and Aladar Fleischman Faculty of Engineering, Tel Aviv University, Tel Aviv, Israel, 5Department of Pediatric Neurosurgery, Tel Aviv Sourasky Medical Center, Tel Aviv, Israel, 6The Gilbert Israeli Neurofibromatosis Center, Tel Aviv University, Tel Aviv, Israel, 7The Gilbert Israeli Neurofibromatosis Center, Tel Aviv Sourasky Medical Center, Tel Aviv, Israel, 8Division of Radiology, Tel Aviv Sourasky Medical Center, Tel Aviv, Israel
    A fused architecture comprised of ResNet-50 CNN and tabular network is proposed for the classification of posterior fossa tumors. The model was tested given T1WI+C, FLAIR, diffusion MRI, and tabular data (age), achieving accuracy of 0.87 for the test dataset based on diffusion MRI and age
    Figure 2: Illustration of the fused CNN and tabular data architecture
    Figure 3: Model interpretation based on Gradient-weighted Class Activation Mapping (Grad-CAM).
  • Deep Learning Segmentation of Lenticulostriate Arteries Using 3T and 7T 3D Black-Blood MRI
    Samantha J Ma1,2, Mona Sharifi Sarabi2, Kai Wang2, Wenli Tan2, Huiting Wu3, Lei Hao3, Yulan Dong3, Hong Zhou3, Lirong Yan2, Yonggang Shi2, and Danny JJ Wang2
    1Siemens Medical Solutions USA, Inc., Los Angeles, CA, United States, 2University of Southern California, Los Angeles, CA, United States, 3Department of Radiology, The First Affiliated Hospital of University of South China, Hunan, China
    The current work demonstrates an exploratory deep learning framework trained with images acquired at 3T and 7T on two MRI vendor platforms for generality to improve automated segmentation of small arteries in non-invasive 3T black-blood images.
    Figure 1. Workflow of the images, pre-processing, data input, network training, and evaluation of the HighRes3DNet deep learning model. Black blood images from 2 vendor scanners were used for manual segmentation in ITK-SNAP, which served as supervision. Images were cropped to the same volume with subcortical coverage regardless of resolution, underwent non-local means filtering, and split into hemispheres to increase the sample size. The HighRes3DNet was trained with 10-fold cross-validation on the training set that included 3T and 7T images, and evaluated on a separate test set.
    Figure 3. 3D renderings by ITK-SNAP of LSA segmentation results using ten-fold validated HighRes3DNet from the test group never seen by the model during training. The outputs generally agree well with the identification of vessels by manual labeling, although there is still some disagreement regarding the distal portions of the vessels. Note the manual segmentation is subject to human interpretation.
  • Disability Prediction in Multiple Sclerosis using Ensemble of Machine Learning Models and DTI Brain Connectivity
    Berardino Barile1, Aldo Marzullo2, Claudio Stamile3, Françoise Durand-Dubief4, and Dominique Sappey-Marinier1,5
    1CREATIS (UMR 5220 CNRS & U1206 INSERM), Université Claude Bernard Lyon 1, Villeurbanne, France, 2Department of Mathematics and Computer Science, University of Calabria, Rende, Italy, 3R&D Department, CGnal, Milan, Italy, 4Hôpital Neurologique, Hospices Civils de Lyon, Bron, France, 5MRI, CERMEP - Imagerie du Vivant, Bron, France
    The proposed Stacking Ensemble scheme provided excellent prediction performance in predicting MS disability, using connectome data and fiber-bundles data. The counterfactual model highlighted WM links usually associated with disability increasing the accountability of the method.
    Figure 1: Pipeline of the proposed Ensemble and Interpretability models for EDSS prediction and visualization of the brain networks responsible for the prediction.
    Figure 2: Comparison of measured (red) and estimated (blue) EDSS score in MS patients.
  • The feasibility of an optimized Faster R-CNN in detection and differentiation HT from PTMC Using high b-value DWI with RESOLVE
    ChengLong Deng1,2, BingChao Wu1,2, QingJun Wang3, QingLei Shi4, Bei Guan1,2, DaCheng Qu5, and YongJi Wang*1,2,6
    1Collaborative Innovation Center, Institute of Software, Chinese Academy of Sciences, Beijing, China, 2University of Chinese Academy of Sciences, Beijing, China, 3Department of Radiology, PLA 6th medical center, Beijing, China, 4MR Scientific Marketing, Siemens Healthcare, Beijing, China, 5School of Computer Science and Technology, Beijing Institute of Technology, Beijing, China, 6State Key Laboratory of Computer Science, Institute of Software, Chinese Academy of Sciences, Beijing, China
    Based on high b-value (2000 sec/mm2) DWI images, we optimize the Faster R-CNN model and studied the diagnostic performance of it, and a higher accuracy in differentiating benign and malignant thyroid micronodules was gained.
    Figure 3: Schematic diagram of an optimized Faster R-CNN for automated detection and classification between HT and PTMC.
    Figure 2: A papillary thyroid microcarcinoma (arrow-heads) in the right lobe (zoom in twice) on DW-MRIs and ADC maps with b=0,800,2000 sec/mm2.
  • Identification of diffusion-based micro-structural measures most sensitive to multiple sclerosis focal damage using GAMER-MRI
    Po-Jui Lu1,2,3, Muhamed Barakovic1,2,3, Matthias Weigel1,2,3,4, Reza Rahmanzadeh1,2,3, Riccardo Galbusera1,2,3, Simona Schiavi5, Alessandro Daducci5, Francesco La Rosa6,7,8, Meritxell Bach Cuadra6,7,8, Robin Sandkühler9, Jens Kuhle2,3, Ludwig Kappos2,3, Philippe Cattin9, and Cristina Granziera1,2,3
    1Translational Imaging in Neurology (ThINk) Basel, Department of Biomedical Engineering, University Hospital Basel and University of Basel, Basel, Switzerland, 2Neurology Clinic and Policlinic, Departments of Medicine, Clinical Research and Biomedical Engineering, University Hospital Basel and University of Basel, Basel, Switzerland, 3Research Center for Clinical Neuroimmunology and Neuroscience (RC2NB) Basel, University Hospital Basel and University of Basel, Basel, Switzerland, 4Division of Radiological Physics, Department of Radiology, University Hospital Basel, Basel, Switzerland, 5Department of Computer Science, University of Verona, Verona, Italy, 6Signal Processing Laboratory (LTS5), Ecole Polytechnique Fédérale de Lausanne, Lausanne, Switzerland, 7Medical Image Analysis Laboratory, Center for Biomedical Imaging (CIBM), University of Lausanne, Lausanne, Switzerland, 8Department of Radiology, Lausanne University Hospital and University of Lausanne, Lausanne, Switzerland, 9Center for medical Image Analysis & Navigation, Department of Biomedical Engineering, University of Basel, Allschwil, Switzerland
    GAMER MRI can select discriminating diffusion measures from diffusion models in the classification of multiple sclerosis lesions. The combinations of selected measures have strong correlation with the Expanded Disability Status Scale and the serum level of neurofilament light chain.
    Fig. 1: Flowchart for using GAMER-MRI to select the most discriminating subject-wise normalized diffusion measures and correlating the combinations of selected diffusion measures with the Expanded Disability Status Scale and the serum level of neurofilament light chain.
    Fig. 2: GAMER-MRI. (A) The neural network. Conv is a convolutional block consisting of a 3x3x3 convolutional layer, exponential leaky units and batch normalization. FC is a fully connected layer. Attention weights are obtained from the softmax function after the attention blocks. Each diffusion measure is encoded parallelly before the softmax function. The hidden features of diffusion measures are linearly combined with the attention weights and input to the classifier. (B) Attention block. ⊙ represents an element-wise multiplication.
  • Deep Learning-based high-resolution pseudo-CT to detect cranial bone abnormalities for pediatric patients using MRI
    Parna Eshraghi Boroojeni1, Yasheng Chen2, Paul K. Commean1, Cihat Eldeniz1, Udayabhanu Jammalamadaka1, Gary B. Skolnick3, Kamlesh B. Patel3, and Hongyu An1
    1Mallinckrodt Institute of Radiology, Washington University in St. Louis, Saint louis, MO, United States, 2Department of Neurology, Washington University in St. Louis, Saint louis, MO, United States, 3Division of Plastic and Reconstructive Surgery, Washington University in St. Louis, Saint louis, MO, United States
    A deep learning-based method was developed to derive pseudo-CT from MR to provide cranial bone information for pediatric patients with head trauma and craniosynostosis without radiation exposure. The pCT closely resembles the gold standard CT images.
    Fig 1 ResUNetModel training scheme. Two networks: whole head ResUNet and bone enhanced networks were trained. The patches were randomly selected from the whole head. For the bone enhanced network the placement of the patch is determined by the patches center voxels located within the bone.
    Fig 3 ResUNet Model testing scheme. The final pCT output was created by combining the pCT from the two networks. The whole head network pCT output was multiplied by brain mask and the bone enhanced network pCT output was multiplied by one minus the brain mask. The results of both multiplications were added for the final pCT output.
  • A unsupervised machine learning approach for classification of white matter hyperintensity patterns applied to Systemic Lupus Erythematosus.
    Theodor Rumetshofer1, Francesca Inglese2, Jeroen de Bresser2, Peter Mannfolk3, Olof Strandberg4, Markus Nilsson1, Itamar Ronen2, Andreas Jönsen5, Linda Knutsson6,7, Tom Huizinga8, Gerda Steup-Beekman8, and Pia Sundgren1,9,10
    1Clinical Science Lund / Diagnostic Radiology, Lund University, Lund, Sweden, 2Department of Radiology, Leiden University Medical Center, Leiden, Netherlands, 3Department of Medical Imaging and Physiology, Skåne University Hospital, Lund, Sweden, 4Clinical Memory Research Unit, Department of Clinical Sciences, Malmö, Lund University, Lund, Sweden, 5Department of Rheumatology, Lund University, Skåne University Hospital, Lund, Sweden, 6Department of Medical Radiation Physics, Lund University, Lund, Sweden, 7Russell H. Morgan Department of Radiology and Radiological Science, Johns Hopkins University School of Medicine, Baltimore, MD, United States, 8Department of Rheumatology, Leiden University Medical Center, Leiden, Netherlands, 9Department of Clinical Sciences/Centre for Imaging and Function, Skåne University Hospital, Lund, Sweden, 10Lund University BioImaging Center, Lund University, Lund, Sweden
    MRI phenotypes obtained by cluster analysis on White Matter Hyperintensities (WMH) distribution in Systemic Lupus Erythematosus can be assigned to a distinct pattern and WM tract. This approach reduces the influence of the total WMH burden and MRI acquisition parameters.
    Figure 2 Heatmaps showing the 5 different MRI phenotypes after cluster analysis. Subjects are shown on the x-axis and the JHU WM tracts on the y-axis. HC are shown on the left and are not included in the clustering as well as SLE patients without WMH. (Top) l2-normalized WMH pattern on which the clustering was performed. Non-normalized WMH load sorted by cohorts and clinical labels (Middle) summed lesion burden (Bottom).The colour bars at the top indicate cohorts (Leiden = brown), FLAIR information (3D = pink) and clinical labels (Healthy controls (HC) = green, nonNPSLE = blue, NPSLE = red).
    Figure 3 Lesion frequency map for HC and each cluster in MNI-space. WMH in cluster 1 can be mainly assigned to Forceps Major, cluster 2 to right Anterior Thalamic Radiation, cluster 3 to Forceps Minor and 4 to the left Anterior Thalamic Radiation. Cluster 5 cannot be assigned to any specific WMH tract due to high WMH burden. The main WMH which corresponds to the WM tracts (copper colour) are emphasised with red arrows.
Back to Top
Digital Poster Session - New Frontiers of AI in Neuroimaging
Neuro
Wednesday, 19 May 2021 17:00 - 18:00
  • Classification Between Epilepsy Patients and Healthy Controls Using Multi-Modal Structure-Function Brain Network
    Yael Jacob1, Gaurav Verma1, Lara Marcuse1, Madeline Fields1, and Priti Balchandani1
    1Icahn School of Medicine at Mount Sinai, New York, NY, United States
    The ability to identify epilepsy patients (EP) early in the course of disease is greatly needed. Using multi-modal structure-function network hierarchy features as predictors in a machine learning algorithm we were able to classify EP and controls with overall accuracy of 84%.
    Figure 1. Connectome analysis procedure. Subject-level structural network is derived from DWI MRI data using probabilistic fiber tracking between the segmented regions of interest. Subject-level functional network is derived from resting state fMRI data based on the pairwise correlations between the regions of interest. Graph theoretical nodal centrality features are computed for both structural and functional networks and their coupling using multilayer analysis.
    Figure 3. Classification comparison. The multi-modal multilayer based SVM classification model resulted in higher predictive values compared to classification models based on single layer of structural or functional connectomes. These results indicate the ability of the multilayer approach to provide improved classification between EP and HC. *p<0.001
  • No-Reference Quality Assessment of MRIs for Clinical Application
    Ke Lei1, Shreyas Vasanawala2, and John Pauly1
    1Electrical Engineering, Stanford University, Stanford, CA, United States, 2Radiology, Stanford University, Stanford, CA, United States
    We proposed a CNN model that automatically assesses image quality within seconds after a scan to reduce the number of patient recalls and inadequate images. Our model is deployed to the clinics where it alerts technicians to take action in real time for highly corrupted images. 
    Figure 2. Three samples of the nine image rulers in use. From top to bottom: for F/S elbow, hip, and F/S brain scans.
    Figure 3. Plots shown to technicians on scanner. The red threshold line is chosen by radiologists, and the two class scores around it are defined as moderate for the pie chart.
  • Importance of Clinical MRI Features in Predicting Epilepsy Drug Treatment Outcome for Pediatric Tuberous Sclerosis Complex
    Jun Yang1,2, Cailei Zhao3, Shi Su4, Zhanqi Hu5, Jianxiang Liao5, Dong Liang1,2,4, and Haifeng Wang2,4
    1Research Centre for Medical AI, Shenzhen Institute of Advanced Technology, Chinese Academy of Sciences, Shenzhen, China, 2University of Chinese Academy of Sciences, Beijing, China, 3Department of Radiology, Shenzhen Children’s Hospital, Shenzhen, China, 4Paul C. Lauterbur Research Centre for Biomedical Imaging, Shenzhen Institute of Advanced Technology, Chinese Academy of Sciences, Shenzhen, China, 5Department of Neurology, Shenzhen Children’s Hospital, Shenzhen, China
    We explored the feature importance in a machine learning model predicting epilepsy drug treatment outcome of tuberous sclerosis complex patients. The results showed that some features were more important than others, and MRI features contributed more than non-MRI features in prediction.
    Fig. 5. Mean ROC curves of 4 settings of feature permutation. Mean AUCs and their 95% CIs are shown in the legend.
    Fig. 4. PIMPs with their 95% CIs and F-values of the selected 30 features.
  • Brain tissues have single-voxel signatures in multi-spectral MRI
    Alexander German1, Angelika Mennecke1, Jan Martin2, Jannis Hanspach1, Andrzej Liebert1, Jürgen Herrler1, Tristan Anselm Kuder3, Manuel Schmidt1, Armin Nagel1, Michael Uder1, Arnd Dörfler1, Jürgen Winkler1, Moritz Zaiss1,4, and Frederik Laun1
    1University Hospital Erlangen, Erlangen, Germany, 2Lund University, Lund, Sweden, 3German Cancer Research Center, Heidelberg, Germany, 4Max Planck Institute for Biological Cybernetics, Tübingen, Germany
    Single-voxel classification of brain tissues based on high-field diffusion and CEST features achieves high accuracy. This indicates that unique features of brain regions are not only discernable by histology, but also by single-voxel MR signatures.
    Fig. 2. Visualization of the segmentation. A slice from the test participant is classified using single-voxel information only (right) and compared to the gold-standard segmentation in the image domain (left).
    Fig. 1. Visualization of the classification approach.
  • Deep Learning Approach for Lumbosacral Plexus Segmentation from Magnetic Resonance Neurography: Initial Study
    Jian Wang1, Guohui Ruan2,3, Yingjie Mei4, Yanjun Chen1, Jialing Chen1, Yanqiu Feng2,3, and Xiaodong Zhang1
    1Department of Medical Imaging, The Third Affiliated Hospital of Southern Medical University, Guangzhou, China, 2Guangdong Provincial Key Laboratory of Medical Image Processing, Southern Medical University, Guangzhou, China, 3School of Biomedical Engineering, Southern Medical University, Guangzhou, China, 4China International Center, Philips Healthcare, Guangzhou, China
    A fully automatic U-net model was able to segment lumbosacral plexus accurately and shorten the segmentation time significantly.
    Figure 3. Segmentation results of the 3D lumbosacral plexus. 3D model of manual segmentation (a,b) and U-Net algorithm segmentation (c,d) of a 53 years old woman with degeneration of lumbar vertebrae and disc herniation. The DCE, PPV and SEN between the U-net and rater is 0.867, 0.884, and 0.850, respectively.
    Figure 2. Segmentation results of the 2D lumbosacral plexus. Masks of manual segmentation (red line) and U-Net algorithm segmentation (yellow line) of a 63 years old woman with degeneration of lumbar vertebrae. The DCE, PPV and SEN between the U-net and rater is 0.873, 0.907, and 0.841, respectively.
  • Differentiating hemorrhage and vasculature ITSS in SWI-magnitude images in intracranial Glioma: machine-learning and radiomic based approach
    Rupsa Bhattacharjee1,2, Rakesh Kumar Gupta3, Suhail P Parvaze4, Rana Patir5, Sandeep Vaishya5, Sunita Ahlawat6, and Anup Singh1,7
    1Center for Biomedical Engineering, Indian Institute of Technology (IIT) Delhi, New Delhi, India, 2Philips Health Systems, Philips India Limited, Gurugram, India, 3Department of Radiology, Fortis Memorial Research Institute, Gurugram, India, 4Philips Health Systems, Philips Innovation Campus, Bangalore, India, 5Department of Neurosurgery, Fortis Memorial Research Institute, Gurugram, India, 6SRL Diagnostics, Gurugram, India, 7Department of Biomedical Engineering, All India Institute of Medical Sciences, New Delhi, India
    One of the first retrospective studies exploring radiomic feature extraction and machine-learning to know whether radiomic features can significantly differentiate between 3Dvasculature and 3DHemorrhage mask regions in SWI-magnitude images.
    Figure-2: Representative feature value comparisons between SMagvasculature and SMaghemorrhage for the top-ranked four features
    Figure-1: Flowchart of methodology
  • Reduction of J-difference Edited Magnetic Resonance Spectroscopy Acquisition Times Using Deep Learning
    Roberto Souza1,2, Jordan McEwen3, Carissa Chung3, and Ashley D. Harris2,4
    1Electrical and Computer Engineering, University of Calgary, Calgary, AB, Canada, 2Hotchkiss Brain Institute, Calgary, AB, Canada, 3Biomedical Engineering, University of Calgary, Calgary, AB, Canada, 4Radiology, University of Calgary, Calgary, AB, Canada
    A simple flat Convolutional Neural Network architecture investigated in the context of reducing J-difference edited MRS acquisition times by factors of 4, 8, and 16 shows great potential reduce acquisition times for edited-MRS.
    Figure 1. Architecture of the CNN model used in the experiments. The model processes the ON and OFF transients separately and subtracts the results to obtain the final J-difference edited spectrum.
    Figure 4. Sample spectra reconstructed by the different CNN models for the different samples in the test set.
  • Defacing and Refacing Brain MRI Using a Cycle Generative Adversarial Network
    Zuojun Wang1, Peng Xia1, Wenming Cao2, Kui Kai, Gary Lau1, Henry Ka Fung Mak3, and Peng Cao1
    1Diagnostic Radiology, Department of Diagnostic Radiology, HKU, Hong Kong, China, 2Department of Diagnostic Radiology, HKU, HongKong, China, 3Department of Diagnostic Radiology, HKU, Hong Kong, China
    In this study, we utilized a cycle generative adversarial network to anonymize brain MRI data. The model showed reliable performance when testing on T1-weighted images, and we also extend our network application to the unseen MPRAGE images, targeting different brain MRI contrasts.
    Figure 3: One case from testing on T1w images. The model performs well regarding face removal without destroying irrelevant tissues, such as the skull base and bottom of the frontal brain lobe. The raw and deface-refaced images were unidentical, showing the deface was irreversible. Difference maps were from the subtraction of the raw and deface-refaced images. (red arrows).
    Figure 4: Face removal results done on unseen MPRAGE images, targeting different MRI contrasts. The face was mostly removed, while other tissues were retained.
  • Deep Image Synthesis for Extraction of Vascular and Gray Matter Metrics
    Farnaz Orooji1, Xinyang Wang1, Mohammed Ayoub Alaoui Mhamdi1, and Russell Butler1
    1Computer Science, Bishop's University, Sherbrooke, QC, Canada
    Using 2D UNET architecture, we show it is possible to extract measures of vascular diameter from T1-weighted images and measures of gray matter from T2-weighted images. 
    Figure 1
    Figure 4
  • Substantia Nigra Abnormalities in Early Parkinson’s Disease Patients using Convolutional Neural Networks in Neuromelanin MRI
    Rahul Gaurav1,2,3, Romain Valabregue1,2, Nadya Pyatigorskaya1,2,3,4, Lydia Yahia-Cherif1,2, Emma Biondetti1,2,3, Graziella Mangone2,5, R. Matthew Hutchison6, Jean-Christophe Corvol2,5,7, Marie Vidailhet2,3,7, and Stephane Lehericy1,2,3,4
    1CENIR, ICM Paris, Paris, France, 2Paris Brain Institute (ICM), Sorbonne University, UPMC Univ Paris 06, Inserm U1127, CNRS UMR 7225, Paris, France, 3ICM Team “Movement Investigations and Therapeutics” (MOV’IT), Paris, France, 4Department of Neuroradiology, Pitié-Salpêtrière Hospital, AP-HP, Paris, France, 5INSERM, Clinical Investigation Center for Neurosciences, Pitié-Salpêtrière Hospital, Paris, France, 6Biogen Inc., Cambridge, MA, United States, 7Department of Neurology, APHP, Pitié-Salpêtrière Hospital, Paris, France
    Using our proposed automated segmentation, we found a highly significant difference in substantia nigra pars compacta volume and signal between Parkinson’s disease patients and healthy volunteers on the basis of neuromelanin-sensitive MRI.
    Figure 1: Substantia Nigra Pars Compacta (SNc) regions of interest (ROI) using ConvNet and manual segmentations for a representative Parkinson's disease patient and a healthy volunteer.
    Table 1: Demographic and clinical characteristics of early Parkinson's Disease patients and healthy volunteers.
  • Deep learning based high resolution IVIM parameter mapping in lacunar infarction patients
    Hui Zhang1, Junqi Xu1, Xutong Kuang2, Shuai Xu2, Xuchen Yu1, Weibo Chen3, Chengyan Wang2, and He Wang1
    1Institute of Science and Technology for Brain-Inspired Intelligence, Fudan University, Shanghai, China, 2Human Phenome Institute, Fudan University, Shanghai, China, 3Philips Healthcare, Shanghai, China
    The proposed deep-learning based high resolution IVIM method can qualitatively and quantitatively improve the assessment of lacunar infarction patients.
    Fig.1 The network architecture of our proposed deep learning-based MSH-EPI reconstruction method.
    Fig. 3: Representative diffusion weighted images from a patient with old cerebral lacunar infarction with SSH-EPI, conventional and deep learning-based MSH-EPI reconstructions, T1-weighted and T2-weighted images.
  • Outcome prediction in Mild Traumatic Brain Injury patients using conventional and diffusion MRI via Support Vector Machine: A CENTER-TBI study
    Maira Siqueira Pinto1,2, Stefan Winzeck3,4, Marta M. Correia5, Evgenios N. Kornaropoulos4,6, David K. Menon4, Ben Glocker3, Arnold J. den Dekker2, Jan Sijbers2, Pieter-Jan Guns7, Pieter Van Dyck1, and Virginia F. J. Newcombe4
    1Radiology, UZA - Antwerp University Hospital, Antwerpen, Belgium, 2imec-Vision Lab, University of Antwerp, Antwerpen, Belgium, 3BioMedIA Group, Department of Computing, Imperial College London, London, United Kingdom, 4Division of Anaesthesia, Department of Medicine, University of Cambridge, Cambridge, United Kingdom, 5MRC Cognition and Brain Sciences Unit, University of Cambridge, Cambridge, United Kingdom, 6Clinical Sciences, Diagnostic Radiology, Lund University, Lund, Sweden, 7Physiopharmacology, University of Antwerp, Antwerpen, Belgium
    Using multi-modal MRI data (FA, MD, T2w and SWI) from the CENTER-TBI study, SVMs were employed to predict patient outcome after mTBI. Z-scoring of image intensities was found beneficial resulting in a prediction accuracy of 67.7%.
    Figure 1. Mean Z-scored FA and MD distribution across the discriminative voxels selected via RFE-SVM.
    Figure 2. Selected voxels for outcome prediction. Color-coding according to the image modalities from which each voxel was selected. Radiological orientation.
  • Synthesize Quantitative Susceptibility Mapping from Susceptibility Weighting Imaging Using a Cycle Generative Adversarial Network
    Zuojun Wang1, Peng Xia1, Henry Ka Fung Mak2, and Peng Cao1
    1Diagnostic Radiology, Department of Diagnostic Radiology, HKU, Hong Kong, China, 2Department of Diagnostic Radiology, HKU, Hong Kong, China
    Here, we apply the cycle generative adversarial network with a perceptual loss to synthesize QSM images from SWI images. The predicted QSM images showed their application in brain microbleed detection.
    Figure 2: Training results on the dataset from PD cohort. Most brain structures were delineated accurately by S2Q, compared with real QSM calculated from STAR-QSM. Furthermore, some residual artifacts near the boundary (red arrows) were disappeared in S2Q.
    Figure 3: Testing results on another dataset from PD cohort. The residual artifacts near the nasal cavity were all removed. The testing set's model performance was comparable with that on the training set, suggesting minimal generalization error.
  • Diagnosis of Parkinson’s disease using a radiomics approach based on STrategically Acquired Gradient Echo (STAGE)
    Yi Duan1, Yida Wang1, Naying He2, Yan Li2, Zenghui Cheng2, Yu Liu2, Zhijia Jin2, Pei Huang3, Shengdi Chen3, Ewart Mark Haacke2,4, Fuhua Yan2, and Guang Yang1
    1East China Normal University, Shanghai Key Laboratory of Magnetic Resonance, Shanghai, China, 2Department of Radiology, Ruijin Hospital, Shanghai Jiao Tong University School of Medicine, Shanghai, China, 3Department of Neurology, Ruijin Hospital, Shanghai Jiao Tong University School of Medicine, Shanghai, China, 4Department of Biomedical Engineering, Wayne State University, Detroit, MI, United States
    We proposed a machine learning method to distinguish Parkinson’s disease from normal controls based on five brain nuclei visualized in STAGE imaging. The final radiomics model achieved an AUC of 0.948 in the testing dataset.
    Figure 2. Flowchart for the radiomics experiments. The last inset on the right contains the tuning feature number in the model with 5-fold cross-validation. A total of 28 features were kept in the final model when the 1-SE rule was used (top). The ROC curves for the final model over training and testing datasets (bottom).
    Table 3. Six most important features and their corresponding coefficients in the final model.
  • Prognostic value of MR imaging features derived from automatic segmentation in glioblastoma
    Quan Dou1, Xue Feng1, Sohil Patel2, and Craig H. Meyer1
    1Biomedical Engineering, University of Virginia, Charlottesville, VA, United States, 2Radiology & Medical Imaging, University of Virginia, Charlottesville, VA, United States
    In this study, we analyzed the relationships between glioblastoma patients overall survival and several automatic segmentation-based MR imaging features. Results showed that combining imaging features with clinical factors improved the survival prediction.
    Figure 1. Deep learning-based automatic segmentation. A pre-trained DCNN5 takes in pre- and post-contrast T1-weighted, T2-weighted and T2-FLAIR images, and generates segmentation results including three subregions: peritumoral edema, enhancing tumor, and necrotic & non-enhancing tumor core.
    Figure 3. Receiver operating characteristic curve analyses for OS classification models.
  • Neural Network for Autonomous Segmentation and Volumetric Assessment of Clot and Edema in Intracerebral Hemorrhages
    Thomas Lilieholm1, Matt Henningsen2, Azam Ahmed3, Alan McMillan1,4, and Walter F Block1,4,5
    1Medical Physics, University of Wisconsin at Madison, Madison, WI, United States, 2Electrical Engineering, University of Wisconsin at Madison, Madison, WI, United States, 3Neurological Surgery, University of Wisconsin at Madison, Madison, WI, United States, 4Radiology, University of Wisconsin at Madison, Madison, WI, United States, 5Biomedical Engineering, University of Wisconsin at Madison, Madison, WI, United States
    ML-driven autonomous segmentation of intracerebral hemorrhages (ICH) can be used to quantify hematoma volume for use in image-guided minimally-invasive surgical evacuation. We built a model to detect and segment clot and edema from ICH MR scans.
    (Left) input T2-W images, (middle) manual segmentation, (right) automatic segmentation of a case from the testing dataset. Green and red regions correspond to tissue identified as clot and edema, respectively, and demonstrate good agreement between the manual and automated segmentations.
    After autonomous-generation of a set of clot and edema segmentations in the axial view, coronal and sagittal views can be extrapolated from the known dimensions of the original dataset. This allows for better visualization and localization of clot components, and their relevant volumes. The small blue region is uncertain- the model identifies it as either clot or edema, but cannot distinguish between the two categories.
  • A comparative study between multi-view 2D CNN and multi-view 3D anisotropic CNN for brain tumor segmentation
    Ritu Lahoti1, Lakshay Agarwal1, Neelam Sinha1, and Vinod Reddy1
    1International Institute of Information Technology Bangalore (IIITB), Bengaluru, India
    On comparing the performance of multi-view 2D CNN and 3D anisotropic CNN on BraTS dataset for brain tumor segmentation, we report using four metrics that anisotropic CNN outperforms 2D CNN with higher sensitivity as it takes into account both global and local features efficiently.
    Fig. 1. Flow diagram for first approach: Multi-view 2D CNN
    Fig. 2. Flow diagram for second approach: Multi-view 3D anisotropic CNN
  • Machine Learning Automatic Segmentation of Spinal Cord Lesions in Multiple Sclerosis Patients
    Peter Hsu1, Sindhuja Govindarajan1, Nikhil Chettipally1, Lev Bangiyev2, Robert Peyster2, Giuseppe Cruciata2, Patricia Coyle2, Haifang Li2, Hasan Saffiudin1, Ryan Merritt1, Eric Wei1, Almighty Ironnah1, and Kwan Chen1
    1Stony Brook University, Stony Brook, NY, United States, 2Stony Brook University Hospital, Stony Brook, NY, United States
    Machine Learning techniques have the ability to identify MS lesions in the spinal cord from MR images. We propose a Convolutional Neural Network that can perform fast and accurate segmentation of spinal cord lesions with high overlap compared to attending radiologists.
    Segmentations made by our model, SCT, and three radiology residents in comparison to the consensus ground truth on an MR image of the spine with lesions. The DSC for this case is highlighted for each rater.
    Comparison of the U-Net++, SCT, and three radiology residents on the 20 testing images of the cervical spinal cord. 15 images had lesions present and 5 had no lesions. Some control cases had other imaging artifacts to represent difficult or uncertain cases. The best performance is highlighted in bold.
  • What we can learn from adults: Usability of two AI algorithms for Brain and tumor segmentation in a pediatric population.
    Maxime DRAI1, GILLES BRUN1, Nadine GIRARD1,2, Benoit TESTUD1,3, and Jan-Patrick STELLMANN1,3
    1Neuroradiology, APHM, Marseille, France, 2CRMBM-CEMEREM, Aix-Marseille Université, Marseille, France, 3CNRS, CRMBM-CEMEREM, UMR 7339, Aix-Marseille Université, Marseille, France
    Borrowing strength from adult population might allow developing AI based segmentation algorithms for routine clinical care in rare pediatric populations such as brain tumors.
    Figure 2 – Comparison of Dice coefficients between the tumor segmentation algorithm (HD-GLIOMA) and expert masks: Histograms showing the distribution of the values (100% indicates a perfect overlap and 0 a complete lack of overlap).
    Figure 1 – Comparison of Dice coefficients between different brain extraction tools HD-BET and expert masks: Histograms showing the distribution of the values where values of 100% indicate e perfect overlap and 0 a complete lack of overlap.
  • Deep-learning-based noise reduction incorporating inhomogeneous spatial distribution of noise in parallel MRI imaging
    Atsuro Suzuki1, Chizue Ishihara1, Yukio Kaneko1, Tomoki Amemiya1, Yoshitaka Bito1, and Toru Shirai1
    1Healthcare Business Unit, Hitachi, Ltd., Kokubunji-shi, Japan
    To reduce the inhomogeneous noise, we developed a noise reduction method by using multiple convolutional neural networks (CNNs) optimized for noise intensity. Denoised brain images  demonstrated improved mean square error (MSE) and signal to noise ratio (SNR) throughout the brain regions.
    Deep-learning-based noise reduction incorporating spatial distribution of noise. Parallel imaging creates a low sensitivity region in the center of the reconstructed image (indicated by the dashed line in the g-factor map), so the thresholds segmenting the high g-factor region in the g-factor map include the central low sensitivity region. The two g-factor regions were segmented by using thresholds of 1.4 and 2.0 for R of 3 and 4, respectively.
    T2 weighed brain image: (a) full sampling image, (b) input image with acceleration rate of 3; input image denoised by (c) conventional method and (d) MA-CNNR; (e) high g-factor region registered in full sampling image. Due to the higher g-factor, the noise in the central region of the input image (b) was higher than that in the peripheral region.
Back to Top
Digital Poster Session - Explorations of AI in Neuroimaging
Neuro
Wednesday, 19 May 2021 17:00 - 18:00
  • Stratifying ischaemic stroke patients across 3 treatment windows using T2 relaxation times, ordinal regression and cumulative probabilities
    Bryony L. McGarry1,2, Elizabeth Hunter1, Robin A. Damion2, Michael J. Knight2, Philip L. Clatworthy3, George Harston4, Keith W. Muir5, Risto A. Kauppinen6, and John D. Kelleher1
    1PRECISE4Q Predictive Modelling in Stroke, Information Communications and Entertainment Institute, Technological University Dublin, Dublin, Ireland, 2School of Psychological Science, University of Bristol, Bristol, United Kingdom, 3Stroke Neurology, North Bristol NHS Trust, Bristol, United Kingdom, 4Acute Stroke Programme, Radcliffe Department of Medicine, University of Oxford, Oxford, United Kingdom, 5Institue of Neuroscience and Psychology, University of Glasgow, Glasgow, United Kingdom, 6Faculty of Engineering, University of Bristol, Bristol, United Kingdom
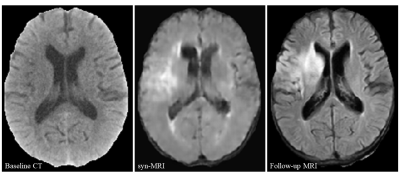
    Using ordinal logistic regression, T2 relaxation times can be used to calculate the probabilities of an acute ischaemic stroke patient with unknown onset time being within treatment time-windows for intravenous thrombolysis, intra-arterial thrombolysis and mechanical thrombectomy. 
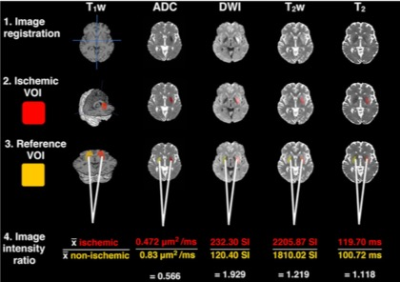
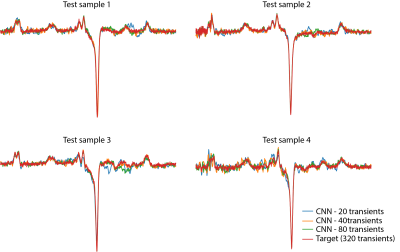
    1. All images were resampled to 1mm isotropic resolution and co-registered to the MNI registered T1W image. 2. Ischaemic VOIs were created using previously described ADC and T2 limits to reduce CSF contribution.2,10 3. Non-ischaemic VOIs were created by reflecting the ischaemic VOI across the vertical axis and applying the ADC and T2 limits. 4. Image intensity ratios were computed by dividing the mean values of ischaemic VOIs by mean non-ischaemic VOIs. SI = signal intensity.
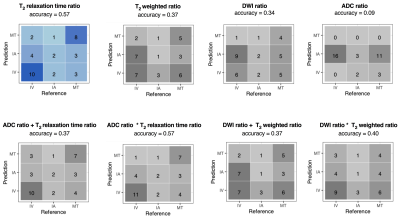
    Accuracy and confusion matrices for cumulative ordinal regression models. Darker shades indicate the higher number of correct predictions. The standardised T2 relaxation time ratio was the most accurate at identifying patients within each treatment window. All models identified patients within the middle IA treatment window. In this figure, a + indicates a linear combination of input features, and * indicates the inclusion of an interaction term.
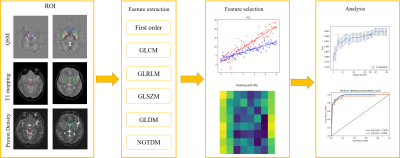
  • Distribution indices of QSM values in M1 enable to classify ALS patients and healthy controls
    Mauro Costagli1,2, Graziella Donatelli3,4, Paolo Cecchi3,4, Gabriele Siciliano4,5, and Mirco Cosottini3,4,5
    1University of Genova, Genova, Italy, 2IRCCS Stella Maris, Pisa, Italy, 3IMAGO 7 Research Foundation, Pisa, Italy, 4Azienda Ospedaliero Universitaria Pisana, Pisa, Italy, 5University of Pisa, Pisa, Italy
    The joint use of different distribution indices of M1 QSM values in a Support Vector Machine enables to discriminate between patients with ALS and controls with high diagnostic accuracy.
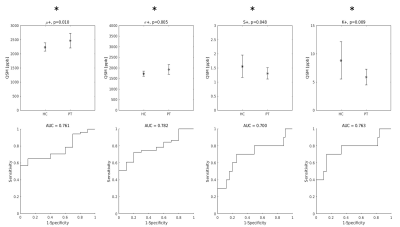
    Top row: group differences in the distribution indices of M1 QSM positive values. Asterisks indicate that all differences were statistically significant. Bottom row: diagnostic accuracy of each feature.
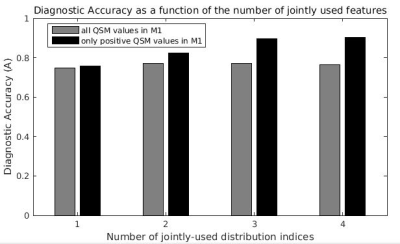
    Maximum diagnostic accuracy of SVM classifiers as a function of the number of QSM distibution indices jointly considered. For example, the last black bar on the right indicates the maximum diagnostic accuracy (A = 0.90) obtained with the joint use of all four distribution indices of QSM positive values in M1.
  • 4D flow MRI hemodynamic quantification of pediatric patients with multi-site, multi-vender, and multi-channel machine learning segmentation
    Takashi Fujiwara1, Haben Berhane2,3, Michael Baran Scott3, Zachary King2, Michal Schafer4, Brian Fonseca4, Joshua Robinson3, Cynthia Rigsby2,3, Lorna Browne4, Michael Markl3, and Alex Barker1,5
    1Department of Radiology, Children's Hospital Colorado, University of Colorado Anschutz Medical Campus, Aurora, CO, United States, 2Lurie Children's Hospital of Chicago, Chicago, IL, United States, 3Northwestern University, Evanston, IL, United States, 4Children's Hospital Colorado, University of Colorado Anschutz Medical Campus, Aurora, CO, United States, 5Department of Bioengineering, University of Colorado Anschutz Medical Campus, Aurora, CO, United States
    We found multi-site, multi-vender 4D flow MRI datasets improved performance in cases with challenging anatomy  in segmenting large arteries, improving flow quantification of difficult cases as well as overall performance.
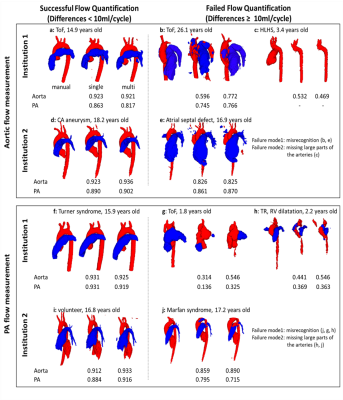
    Fig. 3 Some examples of successful/failed (differences ≥ 10ml/cycle) hemodynamic measurements in multi-site training. Segmentations of aorta (red) and pulmonary arteries (PA, blue) from both single-site and multi-site CNN are presented with Dice scores. The letters correspond to those in Fig. 2. ToF, tetralogy of Fallot; TR, tricuspid regurgitation; HLHS, hypoplastic left heart syndrome.
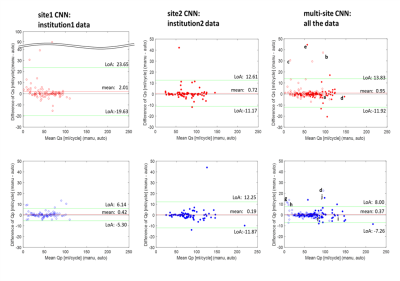
    Fig. 2 Bland-Altman plots for net flow in the ascending aorta (Qs, upper row) and main pulmonary trunk (Qp, lower row) quantified by site1 CNN, site2 CNN, and multi-site CNN. Institution1 data are plotted by open circles while institution2 data are shown by solid circles. Limits of agreement and mean differences are presented as green and red lines. The letter labels indicate successful and failed (differences ≥ 10ml/cycle) examples for flow quantification. The labels correspond to the segmentations shown in Fig. 3.
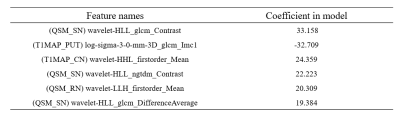
  • Delineating parkinsonian disorders using T1-weighted MRI based radiomics
    Priyanka Tupe Waghmare1, Archith Rajan2, Shweta Prasad3, Jitender Saini4, Pramod Kumar Pal5, and Madhura Ingalhalikar6
    1E &TC, Symbiosis Institute of Technology, Pune, India, 2Symbiosis Centre for Medical Image Analysis, Symbiosis Centre for Medical Image Analysis, Pune, India, 3Department of Clinical Neurosciences and Neurology, National Institute of Mental Health & Neurosciences, Bangalore, India, 4Department of Neuroimaging & Interventional Radiology, National Institute of Mental Health & Neurosciences, Bangalore, India, 5Department of Neurology, National Institute of Mental Health & Neurosciences, Bangalore, India, 6Symbiosis Center for Medical Image Analysis and Symbiosis Institute of Technology, Pune, India
    This study establishes the utility of radiomics to differentiate Parkinson’s disease and atypical Parkinsonian syndromes using routine T1 weighted images.  
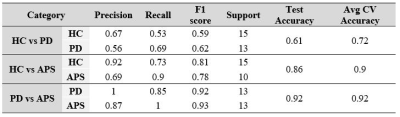
PD and APS were classified at an accuracy of 92% using random forest classifiers.
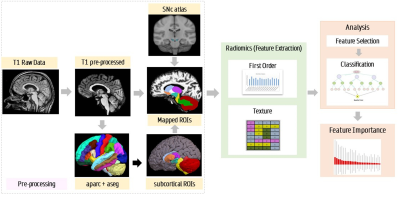
    Pipeline for radiomics analysis and feature extraction
    Classification results based on T1 radiomics
  • Automatic segmentation of arterial vessel wall on undersampled MR image using deep learning
    Shuai Shen1,2,3,4, Xiong Yang5, Jin Fang6, Guihua Jiang6, Shuheng Zhang5, Yanqun Teng5, Xiaomin Ren5, Lele Zhao5, Jiayu Zhu5, Qiang He5, Hairong Zheng1,3,4, Xin Liu1,3,4, and Na Zhang1,3,4
    1Paul C. Lauterbur Research Center for Biomedical Imaging, Shenzhen Institutes of Advanced Technology, Chinese Academy of Sciences, shenzhen, China, 2College of Software, Xinjiang University, Urumqi,, China, 3Key Laboratory for Magnetic Resonance and Multimodality Imaging of Guangdong Province, Shenzhen Institutes of Advanced Technology, Chinese Academy of Sciences, shenzhen, China, 4CAS key laboratory of health informatics, Shenzhen Institutes of Advanced Technology, Chinese Academy of Sciences, shenzhen, China, 5Shanghai United Imaging Healthcare Co., Ltd., shanghai, China, 6Department of Radiology, Guangdong Second Provincial General Hospital, guangdong, China
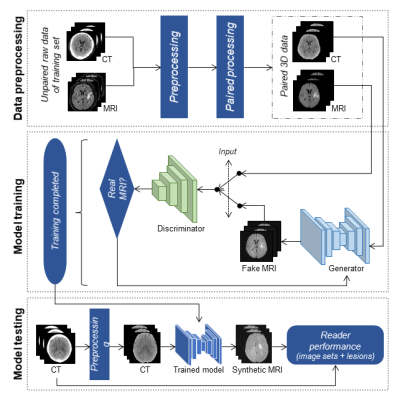
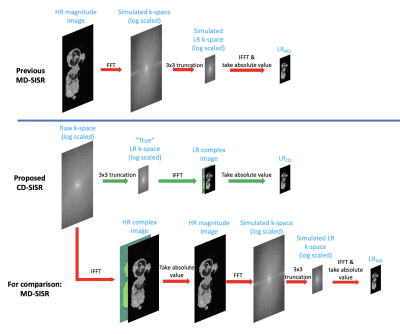
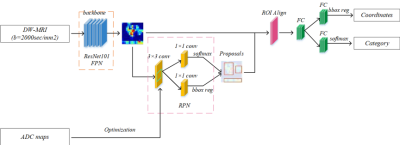
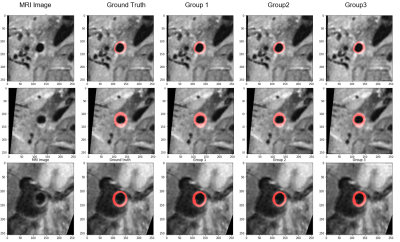
    In this study, we developed and evaluated a U-net neural network architecture to segment the arterial vessel wall on original acquired MR vessel wall images and the corresponding images reconstructed from undersampled K-space data.The obtained results for different groups were similar.
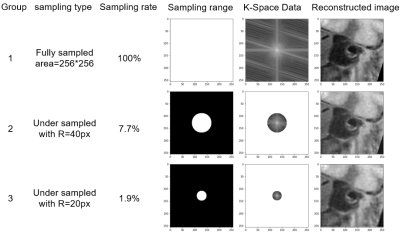
    Figure 1 Representative original images and undersampled images with different undersampled rate.
    Figure 2 Representative images of the segmentation results of different three group experiments.
  • Automatic Vascular Function Estimation using Deep Learning for Dynamic Contrast-enhanced Magnetic Resonance Imaging
    Wallace Souza Loos1,2, Roberto Souza2,3, Linda Andersen1,2, R. Marc Lebel2,4, and Richard Frayne1,2
    1Radiology and Clinical Neuroscience, Hotchkiss Brain Institute, University of Calgary, Calgary, AB, Canada, 2Seaman Family MR Research Centre, Foothills Medical Centre, Calgary, AB, Canada, 3Electrical and Computer Engineering, Hotchkiss Brain Institute, University of Calgary, Calgary, AB, Canada, 4General Electric Healthcare, Calgary, AB, Canada
    A deep learning approach was used to estimate a vascular function from dynamic contrast magnetic images. Our model was able to generalize well for unseen data and achieved a good overall performance without requiring manual intervention or major preprocessing steps.
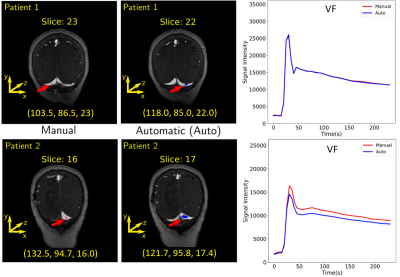
    Estimation of the region and the VF for two patients. The first column shows where the manual region was drawn. The coordinate of the center of mass (in voxels) is placed below each image. The second column shows the predicted region. It is possible to observe that different regions over the transverse sinus can yield similar vascular functions, as illustrated in the plots of the third column. Plots: Red = manual VF and blue = predicted VF.
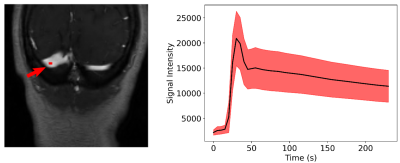
    A region of interest is selected manually over the transverse sinus (left) to estimate the VF (right). To compute the VF, the region was propagated across the dynamic T1-weighted images and the average of the intensities of the pixels was computed for each time point. The mean (black line) and standard deviation (red shaded region) of the 155 VF curves is presented on the right image.
  • Pattern-based features extraction algorithm in the diagnosis of neurodegenerative diseases from diffusion MRI
    Sung-han Lin1, Chih-Chien Tsai1, Yi-Chun Chen2,3, and Jiun-Jie Wang1
    1Department of Medical Imaging and Radiological Sciences, Chang-Gung University, TaoYuan, Taiwan, 2Department of Neurology, Chang Gung Memorial Hospital Linkou Medical Center, TaoYuan, Taiwan, 3College of Medicine, Chang Gung University, TaoYuan, Taiwan
    The current study developed a novel feature extraction algorithm which based on disease pathological changes and the spatial information of disease affected pattern and its surrounding regions. Newly extracted features showed improved diagnostic accuracy, especially for MCI patients.
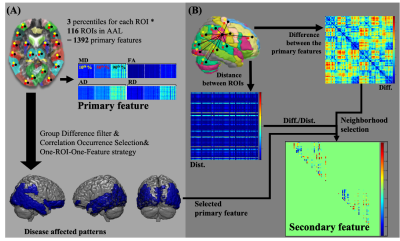
    Figure 1. Flowchart of feature extraction. For all four DTI derived indices in each subject, the feature extraction procedure can be divided into the primary feature from each anatomical region in the brain (panel A), and the secondary feature set (panel B), which was derived from the disease affected pattern. The secondary features were calculated from the product of the value difference to the distance between two primary features. Only features were involved in the disease affected pattern and passed the neighborhood selection were selected.
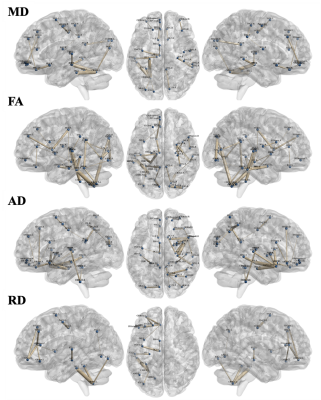
    Figure 3. The selected secondary feature set in four DTI derived indices. The selected secondary feature set was showed in mean diffusivity (21 links), fractional anisotropy (37 links), axial diffusivity (31 links), and radial diffusivity (13 links), respectively. Blue nodes indicate the anatomical regions in the AAL template. Links between nodes indelicate the secondary features and the thicker link means the more significance among classes.
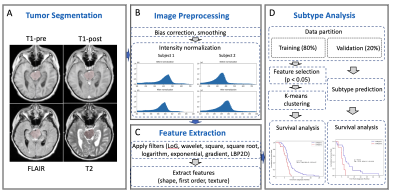
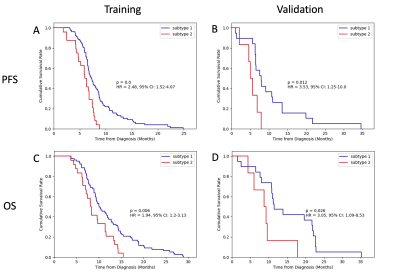
  • Early prediction of progression free survival and overall survival of patients with glioblastoma using machine learning and multiparametric MRI
    Nate Tran1,2, Tracy Luks1, Devika Nair1, Angela Jakary1, Yan Li1, Janine Lupo1, Javier Villanueva-Meyer1, Nicholas Butowski3, Jennifer Clarke3, and Susan Chang3
    1Department of Radiology & Biomedical Imaging, University of California, San Francisco, SAN FRANCISCO, CA, United States, 2UCSF/UC Berkeley Graduate Program in Bioengineering, SAN FRANCISCO, CA, United States, 3Department of Neurological Surgery, University of California, San Francisco, SAN FRANCISCO, CA, United States
    We trained and tested random forest models using metabolic, perfusion, and diffusion images at both preRT and midRT scans, and found that not confining these metrics to the anatomical lesion boundaries improved outcome prediction.
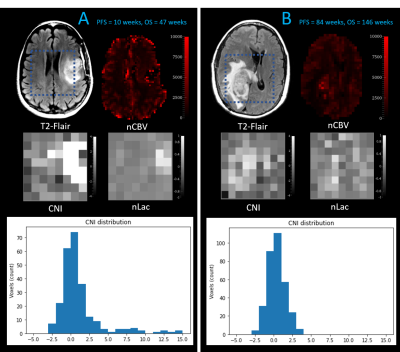
    Figure 1: Patient B has a CEL volume of 28.4 cm3, progressed at 84 weeks, and died at 146 weeks. Although Patient A has smaller CEL & T2L volumes (CEL=10.9 cm3), they progressed much sooner at 10 weeks, and died at only 47 weeks
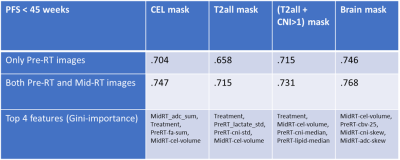
    Table 1: Performance of RandomForest model to predict whether or not OS<45 weeks for each mask using just pre-RT images, and both pre-RT and mid-RT images
  • Exploring Brain Regions Involved in Working Memory using Interpretable Deep Learning
    Mario Serrano-Sosa1, Jared Van Snellenberg2, and Chuan Huang2,3
    1Biomedical Engineering, Stony Brook University, Stony Brook, NY, United States, 2Psychiatry, Renaissance School of Medicine at Stony Brook University, Stony Brook, NY, United States, 3Radiology, Renaissance School of Medicine at Stony Brook University, Stony Brook, NY, United States
    We have developed an interpretable deep learning algorithm to predict working memory scores from 2-back fMRI data that was able to create averaged saliency maps highlighting regions most predictive of working memory scores.
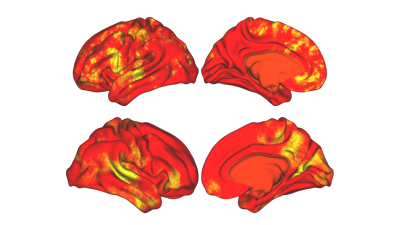
    Figure 3: Averaged saliency maps obtained after training and optimizing the CNN to predict WM subconstruct scores.
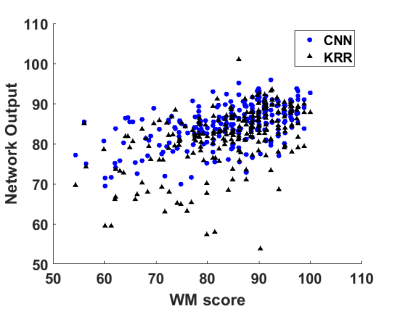
    Figure 2: Network outputs for both CNN and KRR vs ground truth WM score. Blue dots are CNN outputs and black triangles are KRR outputs.
  • Multi-layer backpropagation of classification information with Grad-CAM to enhance the interpretation of deep learning models
    Daphne Hong1 and Yunyan Zhang1
    1University of Calgary, Calgary, AB, Canada
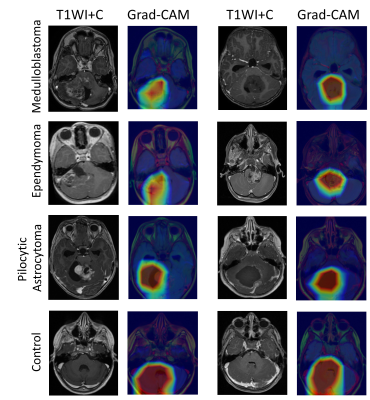
    Using Grad-CAM, it is feasible to backpropagate classification information into arbitrary layers of convolutional neural networks trained on standard brain MRI. Backpropagation into lower-level layers showed greater localization, and higher levels with greater generalization.
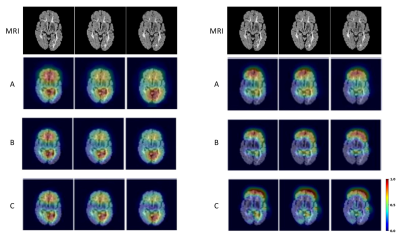
    Heatmaps from MRI of a SPMS patient. Shown are FLAIR image slices 57-59 (left to right, top row) out of 135, and corresponding Grad-CAM heatmaps from VGG16 (left) and VGG19 with GAP (right). The CNN layers highlighted in VGG16 with GAP are: A) last convolutional layer – ‘block5_conv3’, B) second last convolutional layer – ‘block5_conv2’, and C) first convolutional layer of the last convolutional block – ‘block5_conv1’; and in VGG19 with GAP: A) last max pooling layer – ‘block5_pool’, B) last convolutional layer – ‘block5_conv4’, and C) second last convolutional layer – ‘block5_conv3’.
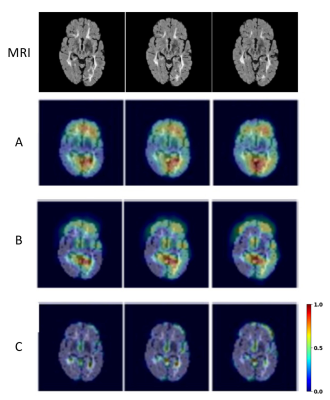
    Further heatmaps generated from the brain MRI of the same SPMS patient using VGG19 with GAP. Shown are also MRI slices at 57-59 (left to right, top row) out of 135. The CNN layers highlighted are: A) third last convolutional layer – ‘block5_conv2’, B) first convolutional layer of last convolutional block – ‘block5_conv1’, and C) last convolutional layer of second last convolutional block – ‘block4_conv4’.
  • Improved Outcome prediction in mild Traumatic Brain Injury using Latent Feature Extraction from Volumetric MRI
    Sanjay Purushotham1, Ashwathy Samivel Sureshkumar1, Li Jiang2, Shiyu Tang2, Steven Roys2, Chandler Sours Rhodes2,3, Rao P. Gullapalli2, and Jiachen Zhuo2
    1Department of Information System, University of Maryland, Baltimore County, Baltimore, MD, United States, 2Diagnostic Radiology and Nuclear Medicine, University of Maryland School of Medicine, Baltimore, MD, United States, 3National Intrepid Center of Excellence, Walter Reed National Military Medical Center, Bethesda, MD, United States
    Mild traumatic brain injury (mTBI) patients account for over 70% of all TBI, with some experiencing persistent post concussive symptoms. Here we present a novel method for latent feature extraction from acute volumetric MRI and show how it improved our 18-month symptom prediction in patients. 
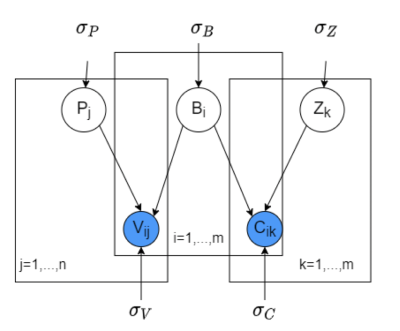
    Figure 1: Graphical Model for the brain region volumetric matrix factorization. C = {Cik} is brain region adjacency matrix, B and Z are latent brain region and factor feature matrices with Bi and Zk representing brain-region specific and factor-specific latent feature vectors. Pj represents patient latent vector for patient j. Rij represents the volumetric observation (value) of brain region i for patient j.
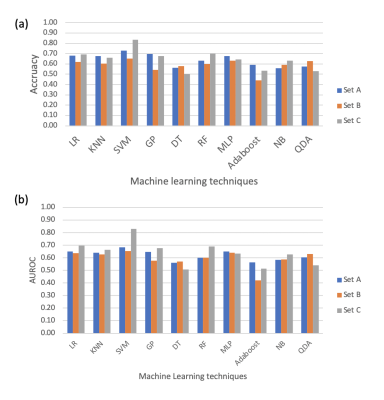
    Figure 2: AUROC and Accuracy plots for predicting patient long-term outcome (PCS labels) using different feature sets.
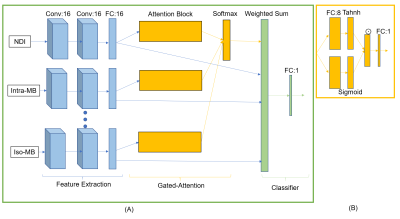
  • Prediction of iron rim lesions in multiple sclerosis using convolutional neural networks and multi-contrast 7T MRI data
    René Schranzer1,2, Steffen Bollmann3, Simon Hametner2, Christian Menard1, Siegfried Trattnig4, Fritz Leutmezer2, Paulus Stefan Rommer2, Thomas Berger2, Assunta Dal-Bianco2, and Günther Grabner1,2,4
    1Department of Medical Engineering, Carinthia University of Applied Sciences, Klagenfurt, Austria, 2Department of Neurology, Medical University of Vienna, Vienna, Austria, 3School of Information Technology and Electrical Engineering, The University of Queensland, Brisbane, Australia, 4Department of Biomedical Imaging and Image-guided Therapy, High Field Magnetic Resonance Centre, Vienna, Austria
    We developed a pipeline, based on neural networks, that provides high quality lesion segmentation and automatic classification of MS lesions based on the presence or absence of an iron-rim.
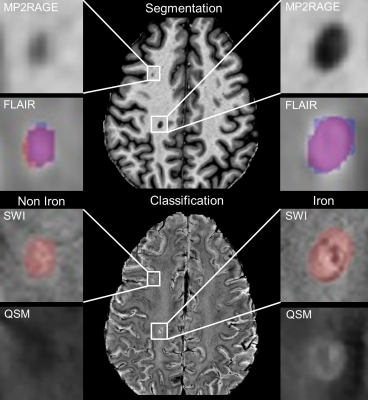
    Figure 1.: Lesion segmentation and iron classification results of the CNNs from the same slice of one representative MS patient: A segmentation comparison for two MS lesions, between manual expert labeling (blue) and CNN labeling (red) is shown in the top image. An example for a non-iron (left) and iron lesion (right) classification from the same area as above is shown on the bottom. A prominent hypointense and hyperintense iron-rim is visible in the SWI and QSM image, respectively.
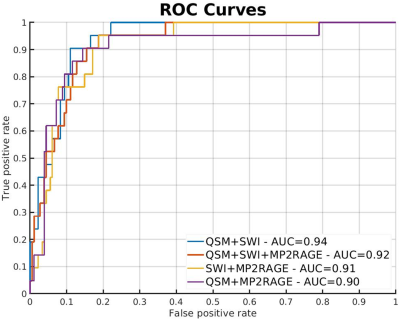
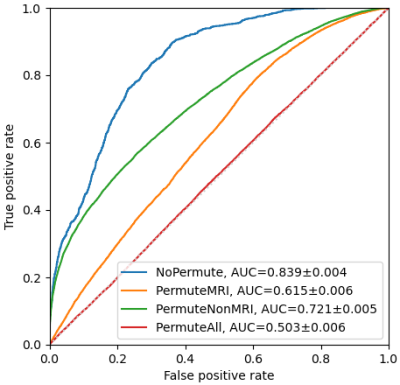
    Figure 2.: Receiver operating characteristic curves for all network combinations: The Graph shows ROC curves with true-positive rate plotted against false-positive rate for lesion-wise prediction of iron.
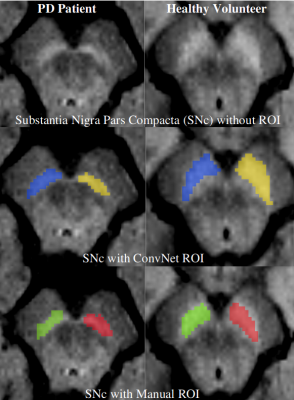
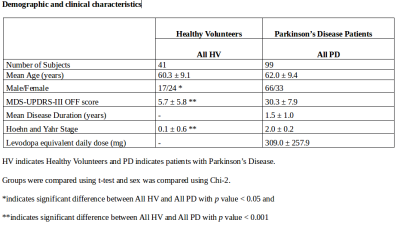
  • MRI-ASL Perfusion patterns may predict deep brain stimulation outcome in de novo Parkinson’s Disease
    Hanyu Wei1, Le He1, Rongsong Zhou2, Shuo Chen1, Miaoqi Zhang1, Wenwen Chen1, Xuesong Li3, Yu Ma2, and Rui Li1
    1Center for biomedical imaging research, Tsinghua University, Beijing, China, 2Department of Neurosurgery, Tsinghua University Yuquan Hospital, Beijing, China, 3School of Computer Science and Technology, Beijing Institute of Technology, Beijing, China
    Pre-surgical medication “on” and “off” MR perfusion patterns may predict the DBS outcome in PD patients by machine learning models.
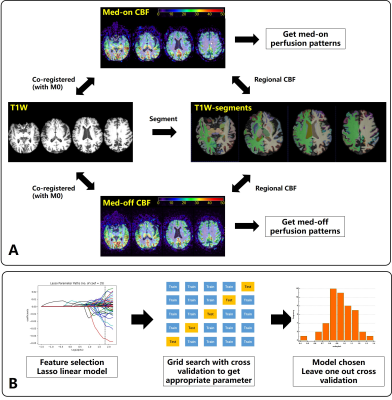
    Figure. 1 A: Flow chart of the image-analysis pipeline. B Main procedures of predictive model construction and evaluation.
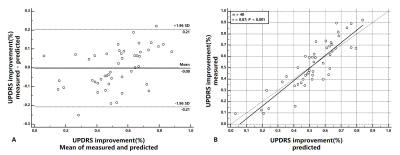
    Figure. 2 A: Bland-Altman analysis of measured and predicted UPDRS improvement, the paired t-test significance p=0.94 and mean prediction error of 9.0% UPDRS improvement. B: Correlation analysis of measured and predicted UPDRS improvement, the correlation r=0.87, p<0.001.
  • Using MRI and Radiomics to Predict Pain in a Cohort of Trigeminal Neuralgia Patients Treated With Radiosurgery
    Kellen Mulford1, Sean Moen2, Andrew W. Grande2, Donald R. Nixdorf3, and Pierre-Francois Van de Moortele1
    1Center for Magnetic Resonance Imaging, University of Minnesota, Minneapolis, MN, United States, 2Department of Neurosurgery, University of Minnesota, Minneapolis, MN, United States, 3Department of Diagnostic and Biological Science, University of Minnesota, Minneapolis, MN, United States
    There is a lack of objective measures for diagnosing and classifying trigeminal neuralgia. In this work, we developed a radiomics based model for predicting whether a nerve was affected by pain.
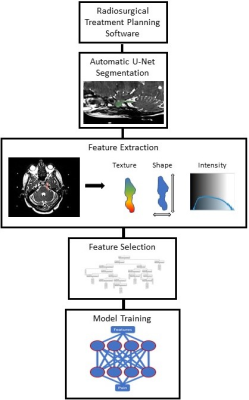
    Figure 1: Flowchart detailing the methods used to build the predictive model.
  • Stacked hybrid learning U-NET for segmentation of multiple articulators in speech MRI
    SUBIN ERATTAKULANGARA1, KARTHIKA KELAT2, JUNJIE LIU3, and SAJAN GOUD LINGALA1,4
    1Roy J Carver Department of Biomedical Engineering, University of Iowa, Iowa City, IA, United States, 2Government Engineering College Kozhikode, Kozhikode, India, 3Department of Neurology, University of Iowa, Iowa City, IA, United States, 4Department of Radiology, University of Iowa, Iowa City, IA, United States
    We propose a stacked hybrid learning U-NET architecture that automatically segments the tongue, velum, and airway in speech MRI. The segmentation accuracy of our stacked U-NET is comparable to a manual annotator. Also, the model can segment images at a speed of 0.21s/ image.
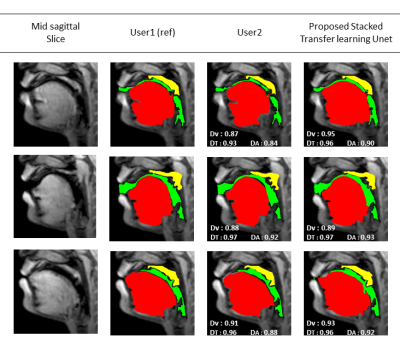
    Figure 2: Results of multiple articulator segmentation on the test data. Three sample postures are shown in the figure. Reference segmentation from User1 is compared against segmentation from User2 and the proposed stacked transfer learned based U-NET. The DICE similarities for the tongue (T), airway (A), and the velum (V) are embedded. These segmentations demonstrate good quality from the proposed U-NET scheme with variability in the range of differences between user1-user2 segmentations.
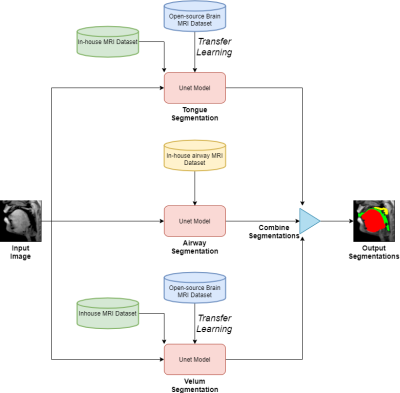
    Figure1: Stacked U-net architecture with hybrid learning. Each of the red boxes represents the U-NET model. The U-NET models for the tongue and velum segmentation are pre-trained with an open-source brain MRI dataset [6], and the UNET model for the airway is trained with an In-house airway MRI dataset. Later the velum and tongue U-nets are trained with an in-house MRI dataset which has few manually labeled (~60 images) articulator segmentations. The final output airway, tongue, velum, segmentation is the concatenated segmentations from the individual U-NET outputs.
  • Use scout models for effective dimension reduction and feature selection in radiomics study
    Yibo Dan1, Hongyue Tao2, Yida Wang1, Chengxiu Zhang1, Chenglong Wang1, Shuang Chen2, and Guang Yang1
    1Shanghai Key Laboratory of Magnetic Resonance, East China Normal University, shanghai, China, 2Department of Radiology, Huashan Hospital, Fudan University, shanghai, China
    We proposed a heuristic method for effective dimension reduction and feature selection, which built scout models for each categories of features to select useful features for final model building.
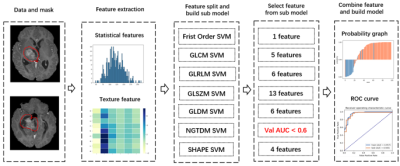
    Figure 1. Flowchart of the modeling process for BraTS 2019 dataset. Pipeline for CAI dataset is similar but for the number of selected features from each category.
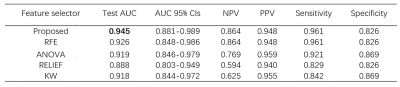
    Table 1. Comparison of performance of proposed approach with classic feature selectors over BraTS2019 dataset.
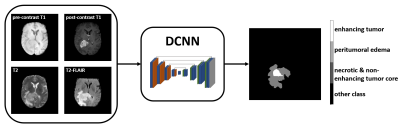
  • EVALUATION OF A CONVOLUTIONAL NEURAL NETWORK FOR AUTOMATED SEGMENTATION OF LOW-GRADE GLIOMAS
    Margaux Verdier1,2, Justine Belko1, Jeremy Deverdun1, Nicolas Menjot de Champfleur1,3, Thomas Troalen2, Bénédicte Maréchal4,5,6, Emmanuelle Le Bars1, and Till Huelnhagen4,5,6
    1I2FH , Neuroradiology, CHU Montpellier, Montpellier University, France, Montpellier, France, 2Siemens Healthcare, Saint Denis, France, 3Laboratoire Charles Coulomb, University of Montpellier, France, Montpellier, France, 4Advanced Clinical Imaging Technology, Siemens Healthcare AG, Lausanne, Switzerland, 5LTS5, Ecole Polytechnique Fédérale de Lausanne, Lausanne, Switzerland, 6Radiology Department, Lausanne University Hospital and University of Lausanne, Switzerland, Lausanne, Switzerland
    Convolutional neural network correctly segments low-grade gliomas using common clinical T1 and T2-FLAIR sequences, facilitating efficient tumor growth evaluation. Segmentation errors can occur when gliomas show strong heterogeneous intensity patterns.
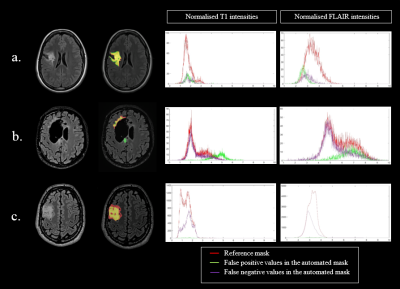
    Figure 3: Three different profiles (left column) with the native FLAIR images and the segmentation masks overlaid on FLAIR images; reference mask in red, automated mask in green and common area in yellow. Corresponding histograms of the normalized T1 and FLAIR signal intensities with manual mask (red), false positive values in the automated mask (green), and false negative values in the automated mask (purple). a : Best automated segmentation; b : Poorest automated segmentation; c : Moderate automated segmentation.
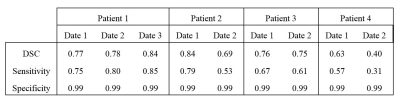
    Table 2: Performance of the automated tumor segmentation in the test patients.
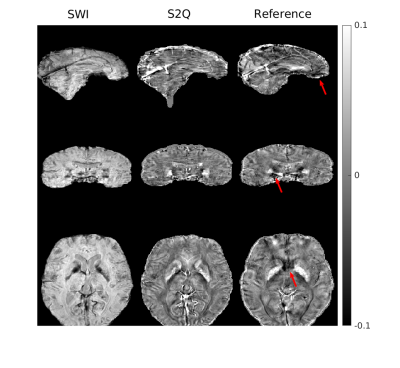
  • IMPROVING THE CONTRAST OF CEREBRAL MICROBLEEDS ON T2*-WEIGHTED IMAGES USING DEEP LEARNING
    Ozan Genc1, Sivakami Avadiappan1, Yicheng Chen2, Christopher Hess1, and Janine M. Lupo1
    1Department of Radiology and Biomedical Imaging, University of California San Francisco, San Francisco, CA, United States, 2Facebook Inc., Mountain View, CA, United States
    Synthetic SWI data was generated from T2* magnitude images using an LSGAN deep learning model. Findings suggest that our deep learning model is able to improve microbleed contrast on T2* magnitude images.
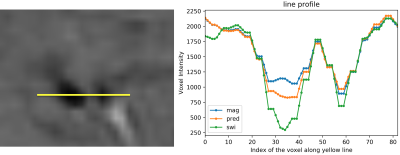
    On the left, two CMBs are shown on a SWI image. On the right, voxel intensities of original SWI (green), predicted SWI (orange) and magnitude image (blue) along the yellow line are shown.
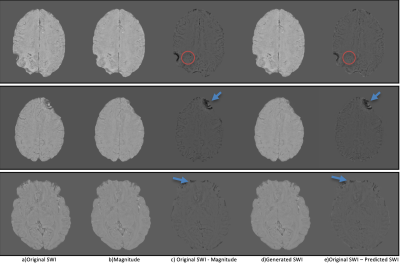
    (a) Original SWI, (b) magnitude image, (c) difference image of original SWI and magnitude image, (d) predicted SWI, (e) difference image of original SWI and predicted SWI. Red circles show CMBs in difference images. Blue arrows show phase artifacts in difference images.
  • Automatic Prediction of MGMT and IDH Genotype for Gliomas from MR Images via Multi-task Deep Learning Network
    Xiaoyuan Hou1,2, Hui Zhang1,2, Yan Tan3, Zhenchao Tang1,2, Hui Zhang3, and Jie Tian1,2
    1Beijing Advanced Innovation Center for Big Data-Based Precision Medicine(BDBPM) ,Beihang University,100083, Beijing, China, 2Key Laboratory of Molecular Imaging, Institute of Automation, Chinese Academy of Sciences,100190, Beijing, China, 3Department of Radiology, First Clinical Medical College, Shanxi Medical University,030001, Taiyuan, China
    We found that the proposed multi-task learning model was potent in predicting multiple genotype of gliomas preoperatively based on MR images. It indicated that multi-task learning model reached the level of state-of-the-art machine learning method in predicting genotype.
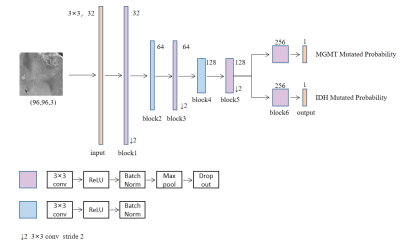
    Figure1. Best-performed multi-task learning model predicting multiple genotype of gliomas preoperatively based on MR images. The figure beside the convolution block means the number of convolution kernel.

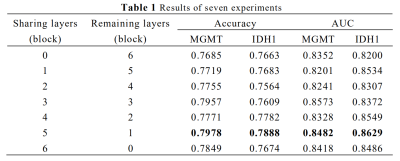
    AUC, Area Under Receiver Operating Characteristic Curve

    Sharing blocks means the number of blocks different branches owned jointly

    Remaining blocks means the number of blocks different branches owned respectively