-
The correlation between type 2 diabetes and fat fraction in liver and pancreas: a study using MR Dixon technique
Yu Shun1, Jieqin Lv2, Zhongshuai Zhang3, Ma Mingping1, and Lin Min-gui1
1Radiology department, Fujian Provincial Hospital, fuzhou, China, 2Department of Biomedical Engineering, Southern Medical University, Guangzhou, China, 3Diagnostic Imaging, SIEMENS Healthcare, Shanghai, China
This study demonstrated that the tissue FF, which has a close relationship with T2DM, can be accessed by MR Dixon technique. The results show that all T2DM patients should pay attention to tissue fat content regardless of BMI values.
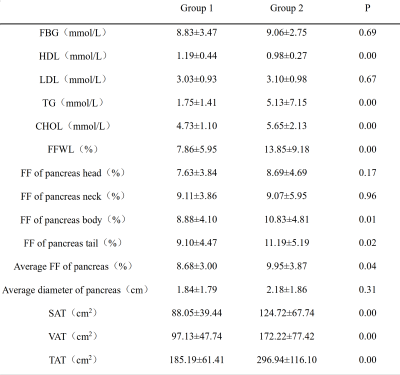
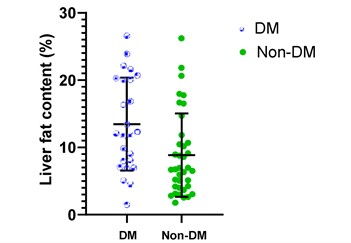
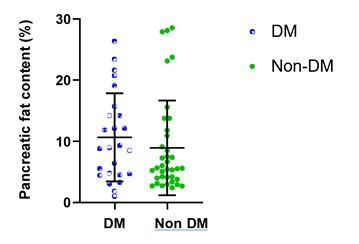
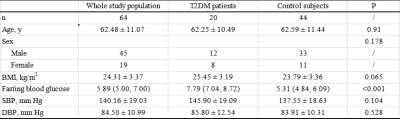
Comparison of tissue FF and clinical indicators
between Group 1 and Group 2
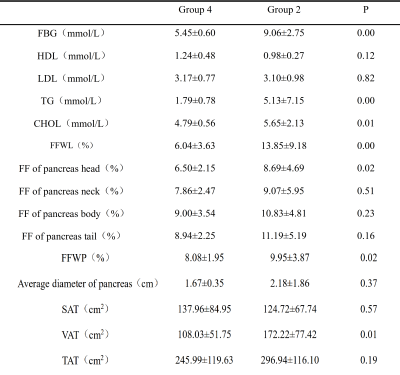
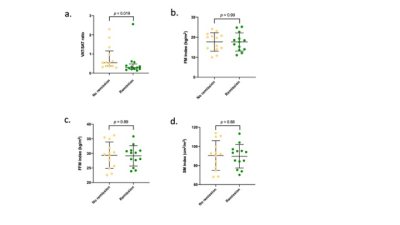
Comparison
of tissue FF and clinical indicators between Group 2 and Group 4
-
Evaluation of Modified Convolutional Neural Network for Automatic Measurement of Pancreas Volume and Pancreatic Fat Deposition
Zhiyong John Yang1, Dech Dokpuang 2, Rinki Murphy 3, Reza Nemati 4, Xavier Yin 5, Kevin Haokun He 5, and Jun Lu1
1School of Biomedical Science, Auckland University of Technology, Auckland, New Zealand, 2Auckland University of Technology, Auckland, New Zealand, 3University of Auckland, Auckland, New Zealand, 4. Canterbury Health Laboratories, Christchurch, New Zealand, 5Saint Kentigern College, Auckland, New Zealand
It now can become a
faster way using AI to recognize the pancreatic fat changes and correlate them
to metabolic disorders. This also provides a possibility that prognose any
latency diseases via software or online in the near future.
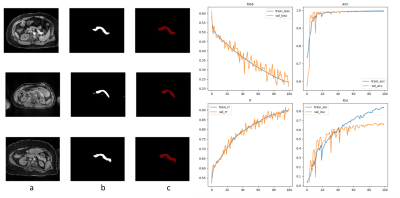
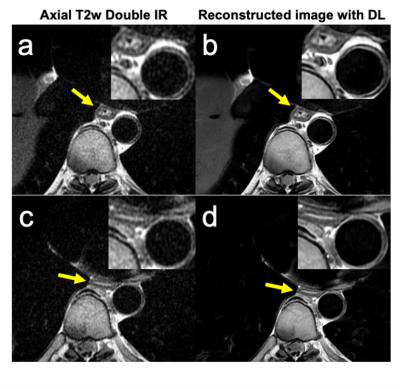
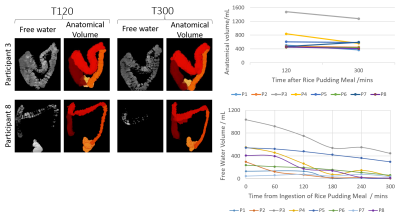
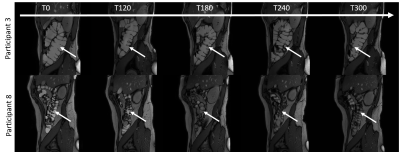
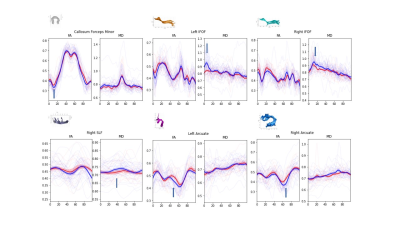
Fig.3 Auto segmentation results are shown in a. original water image; b.
auto segmentation results; c. artificial segmentation results, respectively.
Loss values, accuracy rate, rr values are shown in the line chart
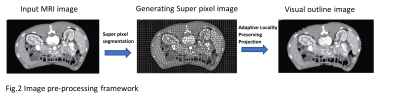
Fig.2 Image pre-processing framework
-
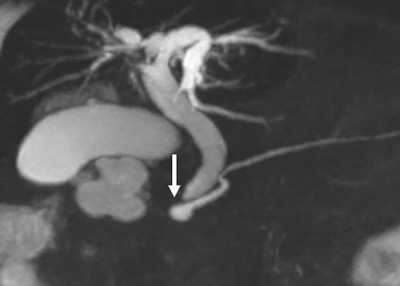
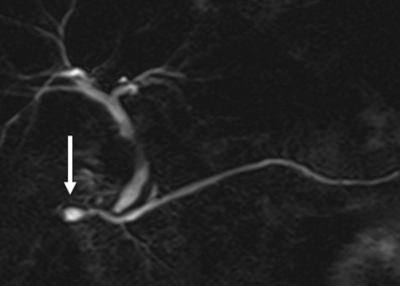
Pancreatic fat fraction is a marker of altered glucidic metabolism in thalassemia major
Antonella Meloni1, Mario Nobile2, Laura Pistoia1, Vincenzo Positano1, Emanuele Grassedonio2, Petra Keilberg1, Costanza Bosi3, Luciana Rigoli4, Giulia Guerrini5, Alessandra De Mitrio6, Massimo Midiri2, and Alessia Pepe1
1MRI Unit, Fondazione G. Monasterio CNR-Regione Toscana, Pisa, Italy, 2Policlinico "Paolo Giaccone", Palermo, Italy, 3Ospedale “G. Da Saliceto”, Piacenza, Italy, 4Policlinico "G. Martino", Messina, Italy, 5P.O. Misericordia Grosseto, Grosseto, Italy, 6A.S.L. di Bari, Bari, Italy
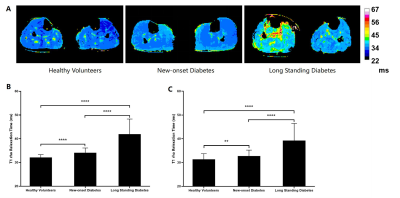
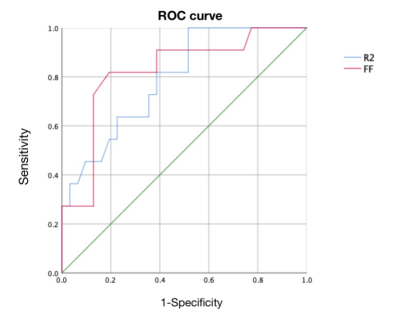
Increased pancreatic fat fraction is
associated with an higher risk of impaired
glucose tolerance and overt diabetes mellitus in thalassemia major.
Figure 1
-
Automated pancreas sub-segmentation by groupwise registration and minimal annotation enables regional assessment of disease
Alexandre Triay Bagur1,2, Ged Ridgway2, Sir Michael Brady2,3, and Daniel Bulte1
1Department of Engineering Science, The University of Oxford, Oxford, United Kingdom, 2Perspectum Ltd, Oxford, United Kingdom, 3Department of Oncology, The University of Oxford, Oxford, United Kingdom
Automated pancreas parts segmentation using groupwise registration is feasible on healthy male volunteers of UK Biobank, with comparable performance to reference annotations. The method enables regional quantification of heterogeneous disease.
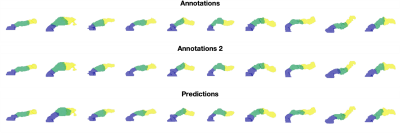
Figure 2. Variability in parts segmentation for the first 10 out of N=20 validation subjects for the first annotations (top), second annotations (middle), and our method’s predictions (bottom).
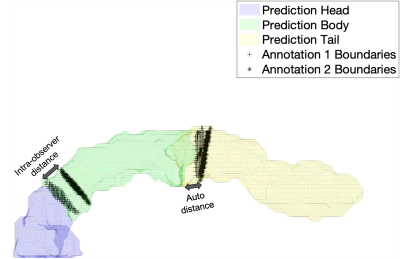
Figure 3. Illustration of the evaluation of parts segmentation using root mean squared error (RMSE) of the Euclidean distance between the annotation boundaries (black markers) and the predicted boundaries (solid colors). Illustrations for the intra-observer distance (left arrow), as well as distance between annotation 1 and prediction (right arrow), are shown.
-
Pancreatic fatty infiltration and iron in thalassemia major
Antonella Meloni1, Mario Nobile2, Laura Pistoia1, Vincenzo Positano1, Emanuele Grassedonio2, Petra Keilberg1, Francesco Sorrentino3, Maurizio Caniglia4, Annamaria Carrà5, Domenico Visceglie6, Massimo Midiri2, and Alessia Pepe1
1MRI Unit, Fondazione G. Monasterio CNR-Regione Toscana, Pisa, Italy, 2Policlinico "Paolo Giaccone", Palermo, Italy, 3Ospedale "Sant'Eugenio", Roma, Italy, 4Azienda Ospedaliera "S. Maria Misericordia" di Perugia, Perugia, Italy, 5Ospedale “G. Da Saliceto”, Piacenza, Italy, 6Ospedale “Di Venere”, Bari, Italy
In thalassemia major patients pancreatic fatty replacement is associated
with ageing and pancreatic iron overload.
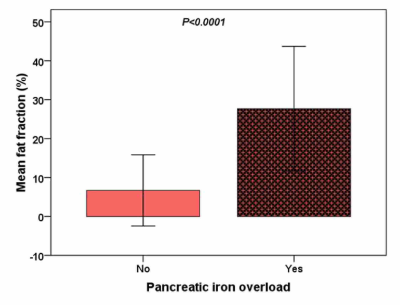
Figure 1
Figure 2
-
Relationship Between Pancreatic Proton Density Fat Fraction and HOMA-IR in Individuals With and Without HIV Infection
Edgar Adrian Castellanos1, Susan Noworolski2, Diana Alba3, Peter Hunt3, and Suneil Koliwad3
1Department of Radiology and Biomedical Imaging, University of California , San Francisco, San Francisco, CA, United States, 2Department of Radiology and Biomedical Imaging, University of California, San Francisco, San Francisco, CA, United States, 3Department of Medicine and Diabetes Center, University of California, San Francisco, San Francisco, CA, United States
Pancreatic fat fraction measures were higher in those with high HOMA-IR versus low in a HIV+ cohort, but not in controls.
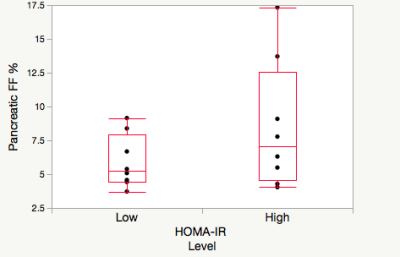
Figure 1 Pancreatic fat fraction in high (>2.2ml/mU) HOMA-IR (n=8) and low (<2.2 mmol/mU) HOMA-IR (n=8) in the HIV- cohort.
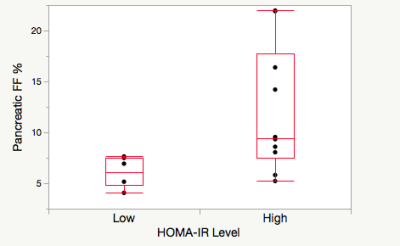
Pancreatic fat fraction in high (>2.2ml/mU) HOMA-IR (n=6) and low (<2.2 mmol/mU) HOMA-IR (n=10) in the cohort with HIV+.
-
Optimization of Flip Angle Modulated Motion Robust 2D Chemical Shift Encoded MRI of the Liver
Ruiyang Zhao1,2, Jitka Starekova1, Scott B Reeder1,2,3,4,5, and Diego Hernando1,2
1Radiology, University of Wisconsin-Madison, Madison, WI, United States, 2Medical Physics, University of Wisconsin-Madison, Madison, WI, United States, 3Biomedical Engineering, University of Wisconsin-Madison, Madison, WI, United States, 4Medicine, University of Wisconsin-Madison, Madison, WI, United States, 5Emergency Medicine, University of Wisconsin-Madison, Madison, WI, United States
Optimized coronal and sagittal free breathing 2D FAM CSE techniques accurately map PDFF and R2* in the liver, while enabling free-breathing acquisitions with whole-liver coverage and without motion-related tissue slice gaps.
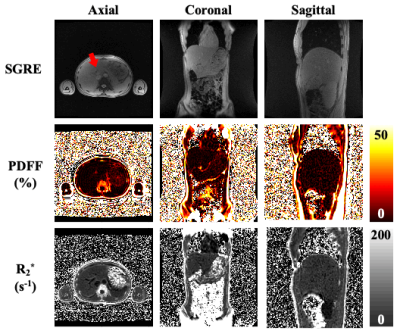
Figure 1. PDFF and R2* maps comparisons between scans with axial, coronal, and sagittal acquisitions using optimized CSE FAM sequences. The first row includes movies from real-time SGRE acquisition. The red arrow indicates the potential missing tissue in axial acquisition due to through-plane motion during free breathing. However, in both coronal and sagittal acquisitions, the liver is captured without obvious missing tissue while performing free breathing scanning (first row), which may enable whole-liver PDFF/R2* mapping while minimizing missed tissue (second/ third rows).
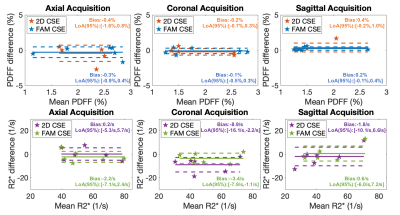
Figure 3. Bland-Altman plots between PDFF/R2* measurements from 2D CSE technique and FAM CSE technique with reference PDFF/R2* obtained from 3D CSE in all three acquisition directions (axial, coronal, and sagittal). Low bias in PDFF/R2*, with narrow limits of agreement are observed for both 2D CSE and FAM CSE.
-
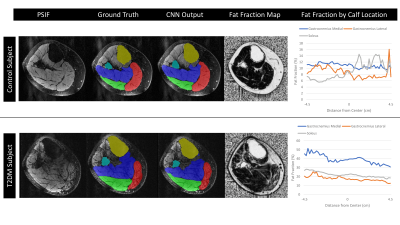
A Deep Learning Approach for Robust Segmentation of Livers with High Iron Content from MR Images of Pediatric Patients
Zhoubing Xu1, Guillaume Chabin2, Robert Grimm3, Stephan Kannengiesser3, Li Pan4, Vibhas Deshpande5, Gregor Thoermer3, Sasa Grbic1, and Cara Morin6
1Siemens Healthineers, Princeton, NJ, United States, 2Siemens Healthineers, Paris, France, 3Siemens Healthineers, Erlangen, Germany, 4Siemens Healthineers, Baltimore, MD, United States, 5Siemens Healthineers, Austin, TX, United States, 6St. Jude Children's Research Hospital, Memphis, TN, United States
A deep learning-based solution was developed for liver segmentation on T1-weighted MRI with improved performance compared to a commercially available solution and robustness on a challenging cohort of pediatric patients including cases with high iron content.
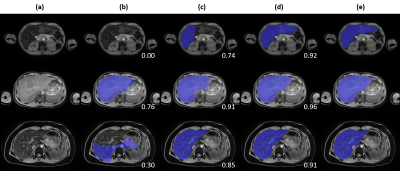
Figure 4. Qualitative
comparison across tested approaches on three representative cases. (a) T1-weighted
water image, (b) baseline approach, (c) deep learning approach, (d) deep
learning with pediatric and high iron case augmentation, (e) manual annotation.
DSC against manual annotation is provided at the bottom left corner for each
case of (b, c, d).
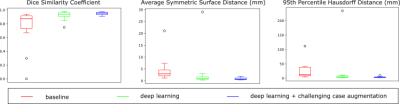
Figure 3. Quantitative comparison across tested approaches on DSC,
ASSD, and 95th HD.
-
Multi-Parametric Relationships in Subjects with Liver Iron Overload Obtained using STEAM-MRS at 1.5T and 3T
Gregory Simchick1,2, Ruiyang Zhao1,2, Gavin Hamilton3, Scott Reeder1,2,4,5,6, and Diego Hernando1,2,4
1Radiology, University of Wisconsin-Madison, Madison, WI, United States, 2Medical Physics, University of Wisconsin-Madison, Madison, WI, United States, 3Radiology, University of California-San Diego, San Diego, CA, United States, 4Biomedical Engineering, University of Wisconsin-Madison, Madison, WI, United States, 5Medicine, University of Wisconsin-Madison, Madison, WI, United States, 6Emergency Medicine, University of Wisconsin-Madison, Madison, WI, United States
Several biomarkers of diffuse liver disease, including R1, R2, and FWHM (as a surrogate for R2*) estimated using STEAM-MRS demonstrated moderate to high correlations with each other at 1.5T and 3T in subjects with liver iron overload.
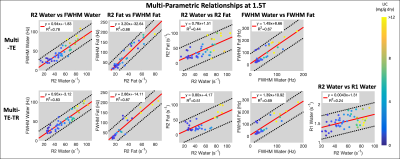
Figure 2: Multi-parametric linear relationships obtained using multi-TE (first row) and multi-TE-TR (second row) STEAM-MRS at 1.5T. The line of best fit (solid red line) and 95% confidence intervals (dashed black lines) are displayed. Individual data points are color coded based on liver iron concentration (mg of Fe per g of dry tissue) measured by Ferriscan. High (R2 > 0.75) and moderate correlations (R2 = 0.44 – 0.69) were observed between various parameters. Similar slopes were observed across sequences, and R1water demonstrated less of a dependence on LIC than R2 and FWHM.
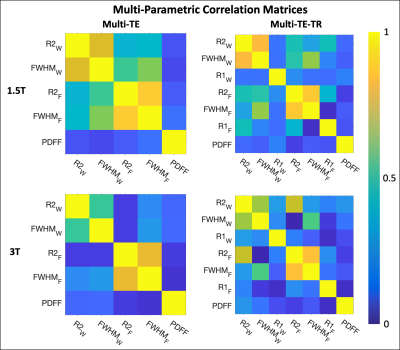
Figure 1: Multi-parametric coefficient of determination (R2) correlation matrices for parameters obtained using multi-TE (first column) and multi-TE-TR (second column) STEAM-MRS at 1.5T (first row) and 3T (second row). The subscripts W and F indicate the parameters associated with the water and fat resonance peaks, respectively. The linear relationships (slopes and intercepts) associated with these correlation matrices are given in Table 1, except for the PDFF relationships. These were excluded due to inconsistent results across the multi-TE and multi-TE-TR sequences.
-
The Effect of Hepatic Fat on T2 of water signal in single voxel multi-echo MRS and fat-suppressed radial TSE T2 mapping.
Diana Bencikova1,2, Marcus Raudner1, Sarah Poetter-Lang1, Nina Bastati1, Ahmed Ba-Ssalamah1, Siegfried Trattnig1,2, and Martin Krššák2,3
1Department of Radiology, Medical University Vienna, Vienna, Austria, 2Christian Doppler Laboratory for Clinical Molecular Imaging, MOLIMA, Vienna, Austria, 3Division of Endocrinology and Metabolism, Department of Medicine III, Medical University of Vienna, Vienna, Austria
The
goal of this study was to investigate the effect of hepatic fat accumulation on
water T2 values in phantoms and patients. MRS and MRI T2 mapping measurements
were analyzed. No significant influence of fat accumulation on in vivo T2
values in the range of hepatic FF ≤ 15% was detected.
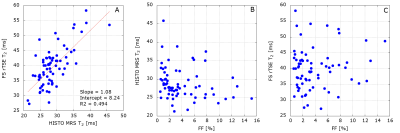
Figure 2: Patient results. A: There is a statistically significantly strong correlation between HISTO MRS
T2 and FS rTSE T2 with r = 0.71, P < 0.0001. B: a statistically not
significant weak negative correlation between hepatic FF and HISTO MRS T2 with r
= -0.22, P = 0.0734 and C: a statistically not significant weak positive
correlation between FF and FS rTSE T2 with r = 0.11, P = 0.3617.
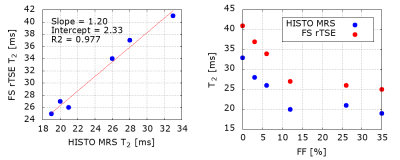
Figure 1: Phantom results. A:
HISTO MRS T2 values strongly correlate with FS rTSE T2 values. B: Systematic
difference between the two acquisitions can be observed. A decrease in T2
values can be detected with increasing FF up to 10 %, then the decrease levels
out. Phantom composition, as the samples were constructed in 50ml tubes with
the given FF filled up with MnCl2 solution, can be a potential explanation.
-
R2* mapping in liver iron quantification using multi-echo ultra-short echo time MRI: a rabbit model study
Hongru Jia1, Chang Liu1, Weiqiang Dou2, Jing Ye1, and Xianfu Luo1
1Northern Jiangsu People’s Hospital, Yangzhou, China., Yangzhou, China, 2GE Healthcare,MR Research China, Beijing, China., Beijing, China
Multi-TE UTE imaging has been demonstrated to accurate measure R2* value at severe iron accumulation. It might be useful for clinical diagnosis of grading liver iron overload to guide iron chelation therapy.
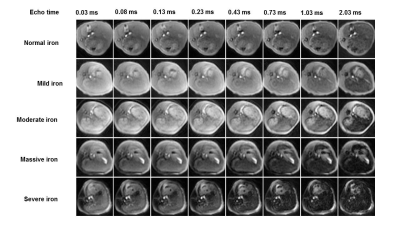
Figure 1. Representative multi-echo UTE liver images at varied degrees of iron overload in a rabbit model. With the iron deposition degree increasing, UTE liver signal decreased gradually. With the increase of echo times, UTE liver signal decreased gradually.
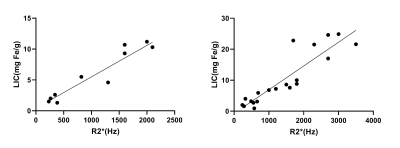
Figure 2. Correlation between hepatic R2* and liver iron content (LIC) in the normal fat liver group (A) and fatty liver group(B). The correlation coefficients were 0.911 and 0.811, respectively.
-
Isotropic resolution volumetric liver T2 weighted imaging and T2 mapping using a navigator-gated radial stack-of-stars T2 prepared acquisition
Mark Zamskiy1, Dominik Weidlich1, Kilian Weiss2, Marcus Makowski1, Rickmer Braren1, and Dimitrios Karampinos1
1Department of Diagnostic and Interventional Radiology, School of Medicine, Technical University of Munich, Munich, Germany, 2Philips Healthcare, Hamburg, Germany
The present work introduced a novel T2-prepared radial SoS gradient echo sequence and demonstrated its applications: fat suppressed volumetric T2-weighted imaging in the combination with a 2-echo DIXON readout and the possibility for 3D isotropic resolution T2 mapping in the liver.
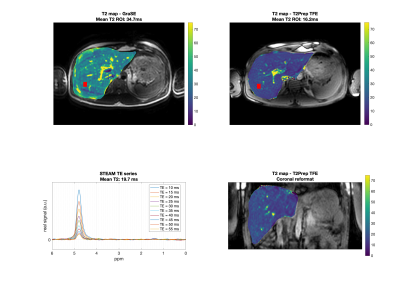
Fig.4. First row: Axial T2 maps obtained from GraSE and T2-prepared TFE. The red box represents the MRS voxel. Second row: MRS and the T2-prepared TFE coronal reformatted T2 map. Mean ROI value represents the mean value within the MRS acquisition voxel. T2 values from the imaging sequences deviate by 76 % (GraSE) and 18% (T2-prepared TFE) from MRS. Artifacts due to motion are visible in the GraSE but not in the T2-prepared TFE sequence.
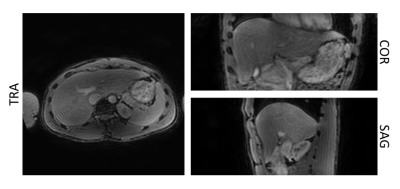
Fig.3. Separated T2-weighted water images obtained from the T2-prepared TFE acquisition with DIXON readout for with an effective echo time of the T2-preparation of 15ms. The fat signal is effectively suppressed, and the resulting isotropic resolution T2-weighted image allows reformatting in all 3 planes.
-
T2 Quantification in Liver Iron Overload Using RF Phase Modulated Gradient Echo MRI
Ruvini Navaratna1,2, Daiki Tamada2, Gregory Simchick2, Diego Hernando1,2, and Scott B Reeder1,2,3,4,5
1Medical Physics, University of Wisconsin - Madison, Madison, WI, United States, 2Radiology, University of Wisconsin - Madison, Madison, WI, United States, 3Biomedical Engineering, University of Wisconsin - Madison, Madison, WI, United States, 4Medicine, University of Wisconsin - Madison, Madison, WI, United States, 5Emergency Medicine, University of Wisconsin - Madison, Madison, WI, United States
We present a
modified 3D phase-based T2 mapping approach to quantify short T2 values seen in
liver iron overload within a breath-hold. Short T2 values were successfully
quantified in simulations, phantom experiments, and in vivo studies.
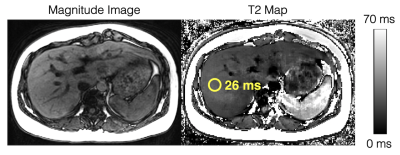
Figure
4. In vivo feasibility studies demonstrate diagnostic image quality for T2
estimation in the liver using the modified phase-based T2 mapping method. An
ROI drawn in the liver shows a T2 estimate of 26ms. Multi-TE STEAM-MRS shows a
T2 estimate of 28ms. The phase-based T2 map is generated assuming T1 = 1000ms, while the T2 estimate in the ROI is estimated using "average first, fit second" and a T1-corrected T2 estimation.
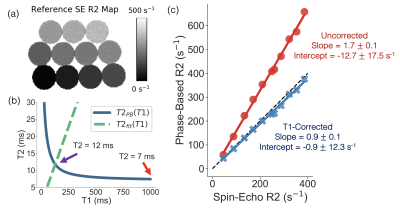
Figure
3. Phantom experiments demonstrate improved T2/R2 estimation with the
T1-corrected phase-based T2 mapping method. (a) Reference R2 map generated from
a single-echo SE sequence. (b) An example of T2PB(T1), T2fit(T1), and
the uncorrected (red arrow) and corrected (purple arrow) T2 estimate are
plotted for a single vial (reference T2 = 11ms). (c) Linear regressions of
phase-based R2 as a function of single-echo SE R2 for the uncorrected
(assuming T1 = 1000ms) and T1-corrected phase-based T2 method are shown. Slope and intercept are shown with their 95% confidence
interval.
-
Performance of Radial Dual-Echo Inversion Recovery SPGR T1 mapping in comparison to SMART1 and MOLLI for the Evaluation of Liver Parenchyma.
Manoj Mathew1, Zhitao Li2, Ali B Syed3, Shreyas S Vasanawala1, and Ryan L Brunsing1
1Department of Radiology, Stanford University, Palo Alto, CA, United States, 2Department of Radiology and Electrical Engineering, Stanford University, Palo Alto, CA, United States, 3Stanford University, Palo Alto, CA, United States
Radial Dual-Echo Inversion Recovery SPGR T1 mapping is a technique that yields water and fat separated parametric maps that is superior to MOLLI technique in the differentiation of patients with and without hepatic cirrhosis.
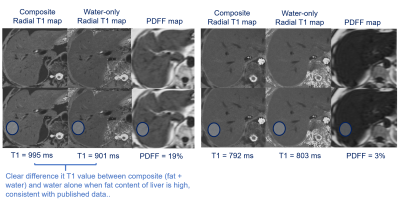
Isolation of water T1 values
using radial T1 mapping in a patient with 19% and 3% PDFF.
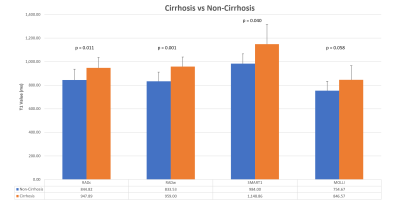
Comparison
of the mean T1 values between techniques in patients with and without
cirrhosis.
-
Feasibility of T1 Mapping with Histogram Analysis for the Diagnosis and Staging of Liver Fibrosis: Preclinical Results
Qing Wang1, Ye Sheng2, HaiFeng Liu2, Zuhui Zhu2, wei Xing2, and Jilei Zhang3
1Radiology, Third Affiliated Hospital of Soochow University & First People's Hospital of Changzhou, changzhou, China, 2Third Affiliated Hospital of Soochow University & First People's Hospital of Changzhou, changzhou, China, 3Healthcare,Shanghai,China, shanghai, China
Histogram analysis have advantages over conventional representative ROI selection for LF.Entropy
characterizes image complexity by evaluating fibrosis heterogeneity and Entropy20min has a
substantial advantage as a biomarker of LF.
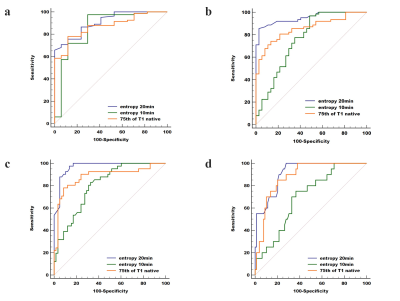
Comparisons of the
diagnostic ability of three optimal parameters (75th of T1native, entropy20min
and entropy10min) for discriminating LF ≥ F1 (a), ≥ F2 (b), ≥ F3
(c) and F4 (d), respectively. Entropy20min showed
the highest diagnostic
performance, with AUC=0.908, 0.951, 0.969, and 0.914, respectively.
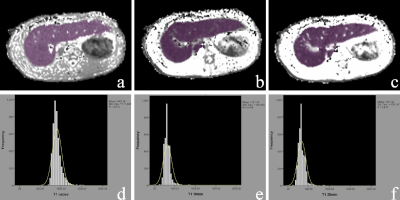
Examples of ROIs
drawn over T1 maps of F1 liver tissue. The liver borders, major vessels, and
gallbladder were manually excluded. The ROIs were delineated to include the
whole liver on all slices for T1native (a), T110min (b), and T120min (c), and a minor adjustment was adopted to update the ROI. The histogram curves of T1native (d), T110min (e), and T120min (f) are shown.
-
Intenso MRE: 3D volumetric GRE-based MR Elastography of the liver in a single breath-hold
Omar Isam Darwish1,2,3, Sami Jeljeli1, Daniel Staeb4, Peter Speier5, Ralph Sinkus1,2, and Radhouene Neji1,3
1King's College London, London, United Kingdom, 2INSERM U1148, LVTS, University Paris Diderot, Paris, France, 3MR Research Collaborations, Siemens Healthcare Limited, Frimley, United Kingdom, 4MR Research Collaborations, Siemens Healthcare Limited, Melbourne, Australia, 5MR Application Predevelopment, Siemens Healthcare GmbH, Erlangen, Germany
To design and validate a rapid, single breath-hold 3D volumetric GRE-MRE
sequence that is capable of estimating viscoelastic tissue properties in the
liver.
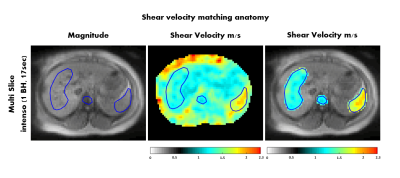
Figure 4: Shear
velocity map in the abdomen for volunteer 1. The shear velocity values are
acquired with Intenso,
averaged over the four inner-most slices and matched with the abdominal anatomy
(e.g. liver, spleen and spine are highlighted).
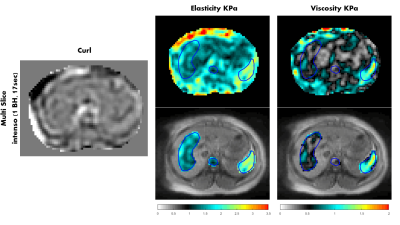
Figure 5: Elasticity
and viscosity maps (KPa) in the abdomen for volunteer 1, and one component of
the curl of the displacement field is shown as well. The maps were
acquired with Intenso,
and the viscoelastic values are averaged over the four inner-most slices. The
viscoelastic maps are matching with the abdominal anatomy (e.g. liver, spleen
and spine are highlighted).
-
Longitudinal MRI and MR Elastography (MRE) Assessment in Patients with Diagnosed Nonalcoholic Fatty Liver Disease (NAFLD)
Zheng Zhu1, Alina M. Allen2, Terry Therneau3, Xin Lu1, Kevin J. Glaser1, Jiahui Li1, Jingbiao Chen1,4, Jie Chen1,5, Safa Hoodeshenas1, Sudhakar K. Venkatesh1, Armando Manduca1,6, Richard L. Ehman1, and Meng Yin1
1Department of Radiology, Mayo Clinic, Rochester, MN, United States, 2Devision of Gastroenterology and Hepatology, Mayo Clinic, Rochester, MN, United States, 3Devision of Biomedical Statistics and Informatics, Mayo Clinic, Rochester, MN, United States, 4Department of Radiology, the Third Affiliated Hospital of Sun Yat-Sen University, Guangdong, China, 5Department of Radiology, West China Hospital, Chengdu, Sichuan, China, 6Devision of Physiology and Biomedical Engineering, Mayo Clinic, Rochester, MN, United States
In the clinical management of nonalcoholic fatty liver disease, longitudinal fat fraction and liver stiffness measurements have the potential to predict fibrosis progression rate, thus identifying individuals at high risk of rapid progression.
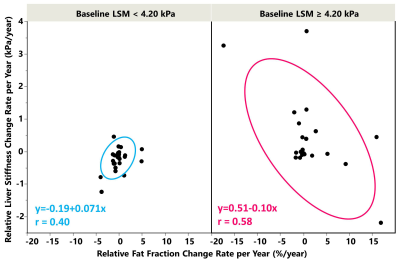
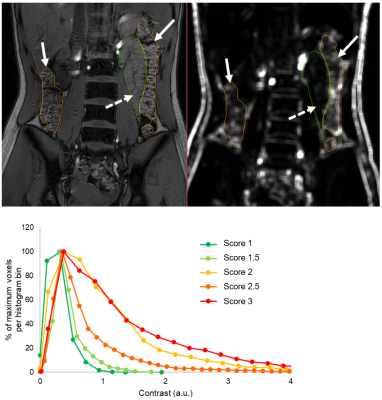
The scatter plots of ΔLSM and ΔPDFF per year
and their relationship in the noncirrhotic (left) and cirrhotic (right) groups.
In the noncirrhotic group, low change rates and a positive correlation were
observed. In the cirrhotic group, high
change rates and a negative correlation were observed.
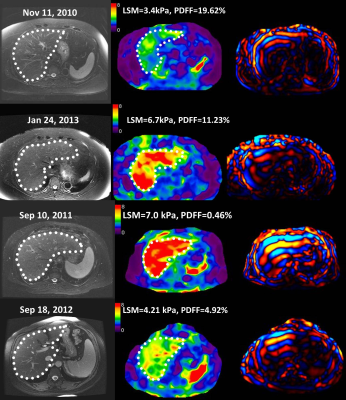
(Top) The T2WI/FS,
MRE elatograms, and wave image from 3 years of follow-up examinations of a 72-year-old
female with a noncirrhotic liver with typical small and positive changes in LSM,
her BMI increased from 31.5 to 35.0..
(Bottom) The T2WI/FS, MRE elatograms, and wave image in a 57 year-old female
with a cirrhotic liver with typical large and negative changes in LSM in one
year of follow-up examinations, her BMI increased from 28.7 to 31.1.
-
A Preliminary Assessment of Hepatic Fibrosis with Ultrashort Echo Time (UTE): A comparative study with Magnetic Resonance Elastography (MRE)
Jie Yuan1, Fan Mo2, Yongming Dai2, Suhao Qiu3, Yuan Feng3, Songhua Zhan1, Yanwen Huang1, and Hui Wang1
1Department of Radiology, Shuguang Hospital Affiliated to Shanghai University of Traditional Chinese Medicine, 201203, Shanghai, China, 2MR Collaboration, United Imaging Healthcare, Shanghai, China, 3Institute for Medical Imaging Technology, School of Biomedical Engineering, Shanghai Jiao Tong University, 200240, Shanghai, China
We investigated the potential of Ultrashort Echo Time (UTE) to accurately assess hepatic fibrosis in patients with chronic liver disease. Our study demonstrated that UTE has the potential to assess the hepatic fibrosis.
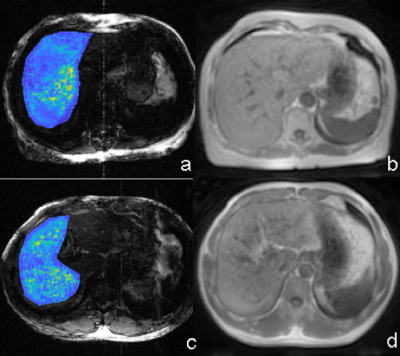
Figure 2: MRE image (a) and UTE image (b) in a 63-year-old woman with fibrosis F1. The UTE signal is 1122 and liver stiffness was 2.55 kPa. MRE image (c) and UTE image (d) in a 48-year-old man with fibrosis F3. The UTE signal is 692 and liver stiffness was 3.11 kPa.
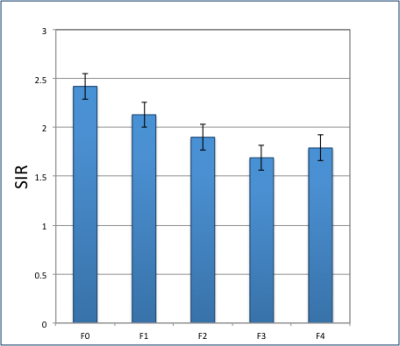
Figure 5. Mean UTE SIR in patients for different stages (F0, F1, F2, F3 and F4).
-
Non-Alcoholic Fatty Liver Disease: Association Between the Biomechanics and Inflammation Severity in Early-Stage Diffuse Liver Disease
Christian Simonsson1,2, Markus Karlsson1, Patrik Nasr3, Ralph Sinkus4, Simone Ignatova5, Nils Dahlström1, Mattias Ekstedt2,3, Stergios Kechagias3, and Peter Lundberg1,2
1Department of Radiation Physics, Radiology, Linköping University, Linköping, Sweden, 2Center for Medical Image Science and Visualization (CMIV), Linköping University, Linköping, Sweden, 3Department of Medical and Health Sciences, Linköping University, Linköping, Sweden, 4Imaging Sciences & Biomedical Engineering, Kings College London,, London, United Kingdom, 5Linköping University, Linköping, Sweden
We have shown correlations between 3D-MRE
biomechanical properties (GI, α and cs) and histopathological features in a liver disease
cohort, with patients expressing various degrees of hepatic inflammation.
References
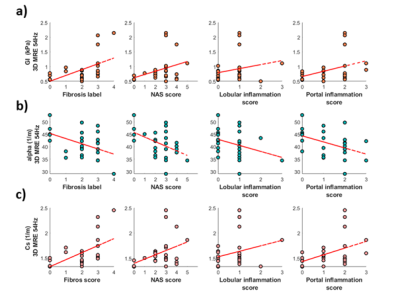
Fig 3. a) The tissue viscosity, GI , plotted against fibrosis labels and inflammation score. b) the shear wave absorption, α, plotted against fibrosis labels and inflammation score. c) shear wave speed, cs, plotted against fibrosis labels and inflammation score.
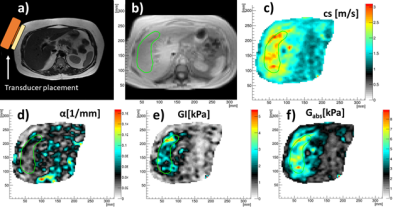
Fig 2. a) Anatomy and MRE transducer placement. b) ROI in magnitude image. c) shear wave speed, cs. d) shear wave absorption, α. e) tissue viscosity, GI. f) tissue elasticity Gabs.
-
Role of mDixon quant imaging in evaluation of treatment outcome with vitamin K2 in non-alcoholic fatty liver disease
Zhiying Xue1, Xiuzheng Yue2, Yishi Wang2, and Tong Zhang1
1Radiology, No.4 Hospital of Harbin Medical University, Harbin, China, 2Philips Healthcare, Beijing, China
We investigated the effects of VK2 supplementation on NAFLD and related serum biomarkers. PDFF were used as a tool for determining the degree of fatty infiltration of the liver. After the one-year supplementation the blood biomarker and liver fat infiltration were improved to some degree.
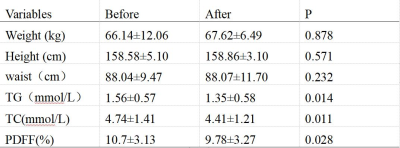
figure1
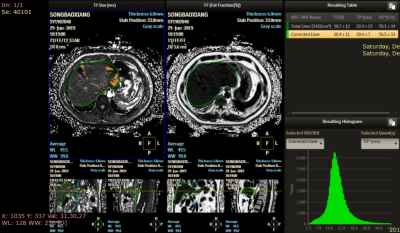
figure2